AB ZoneMatrix
- 지표
- 버전: 1.0

How it works
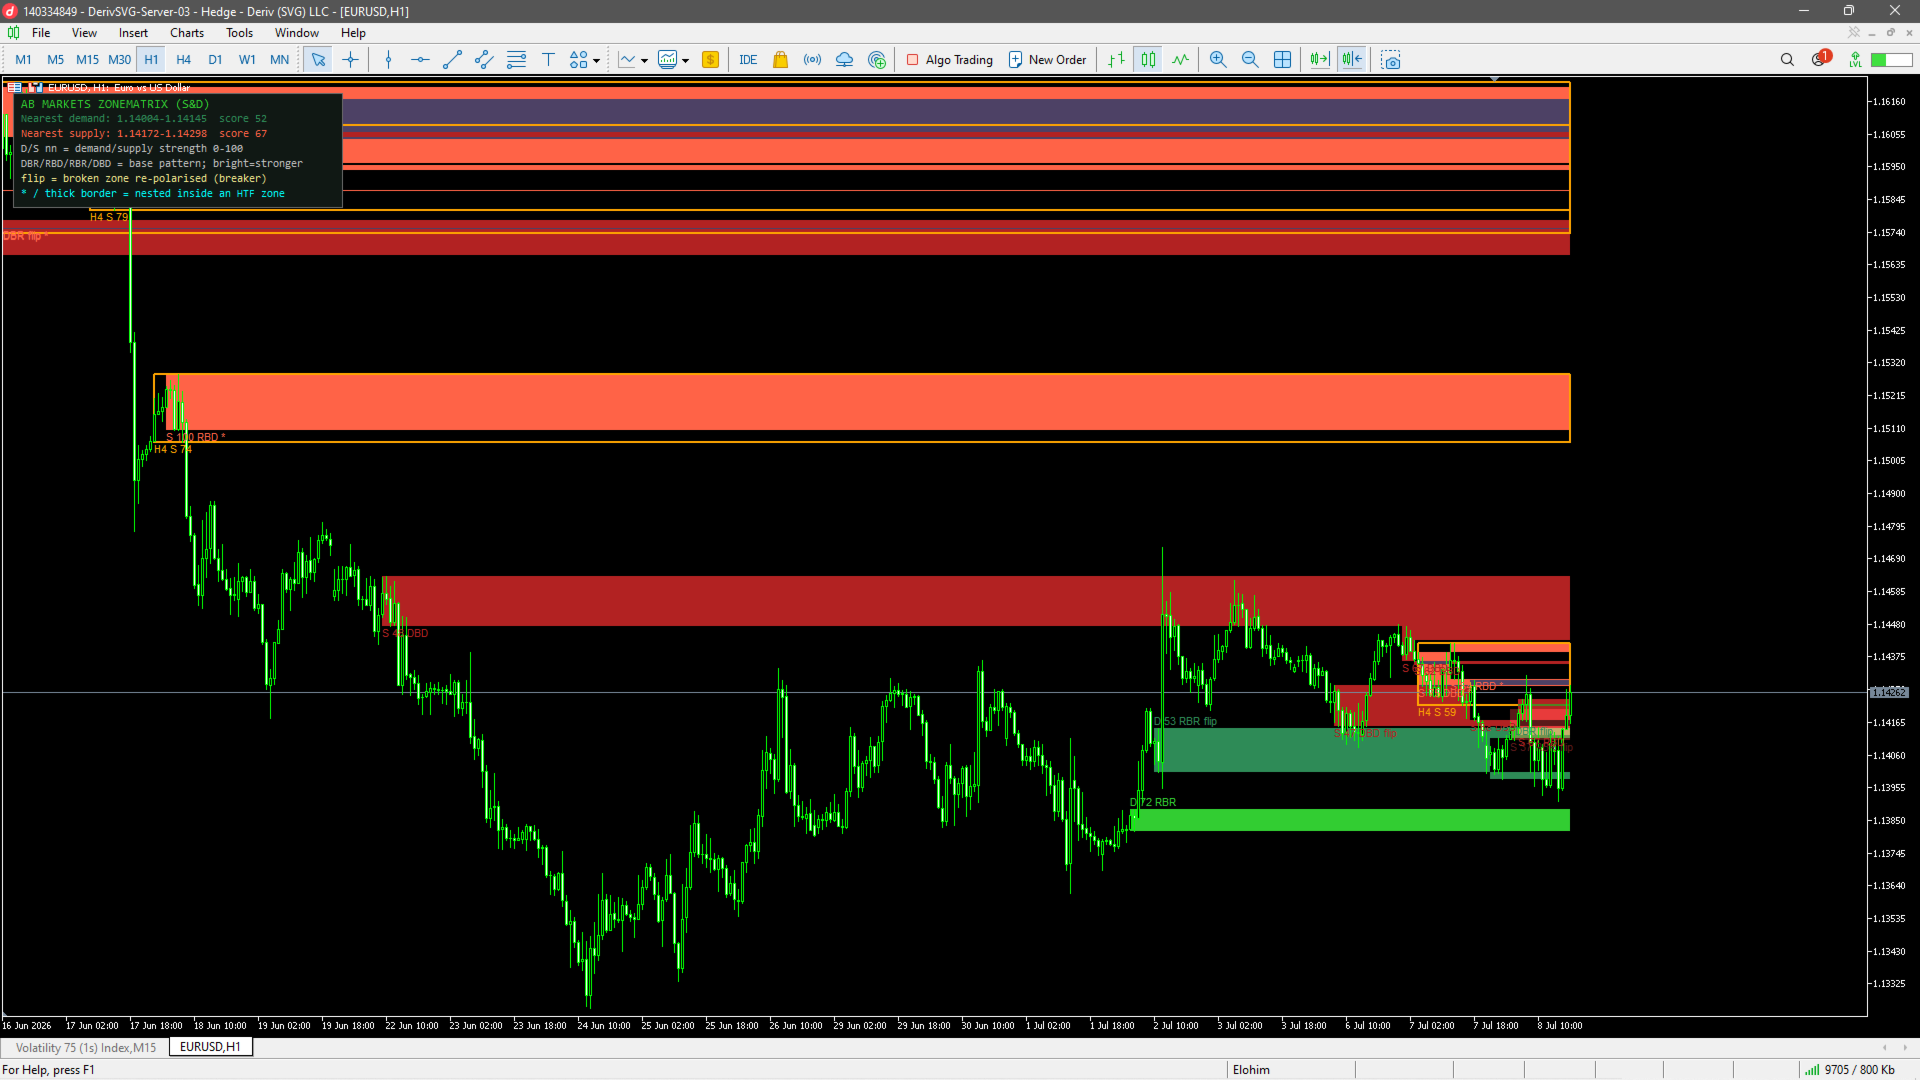
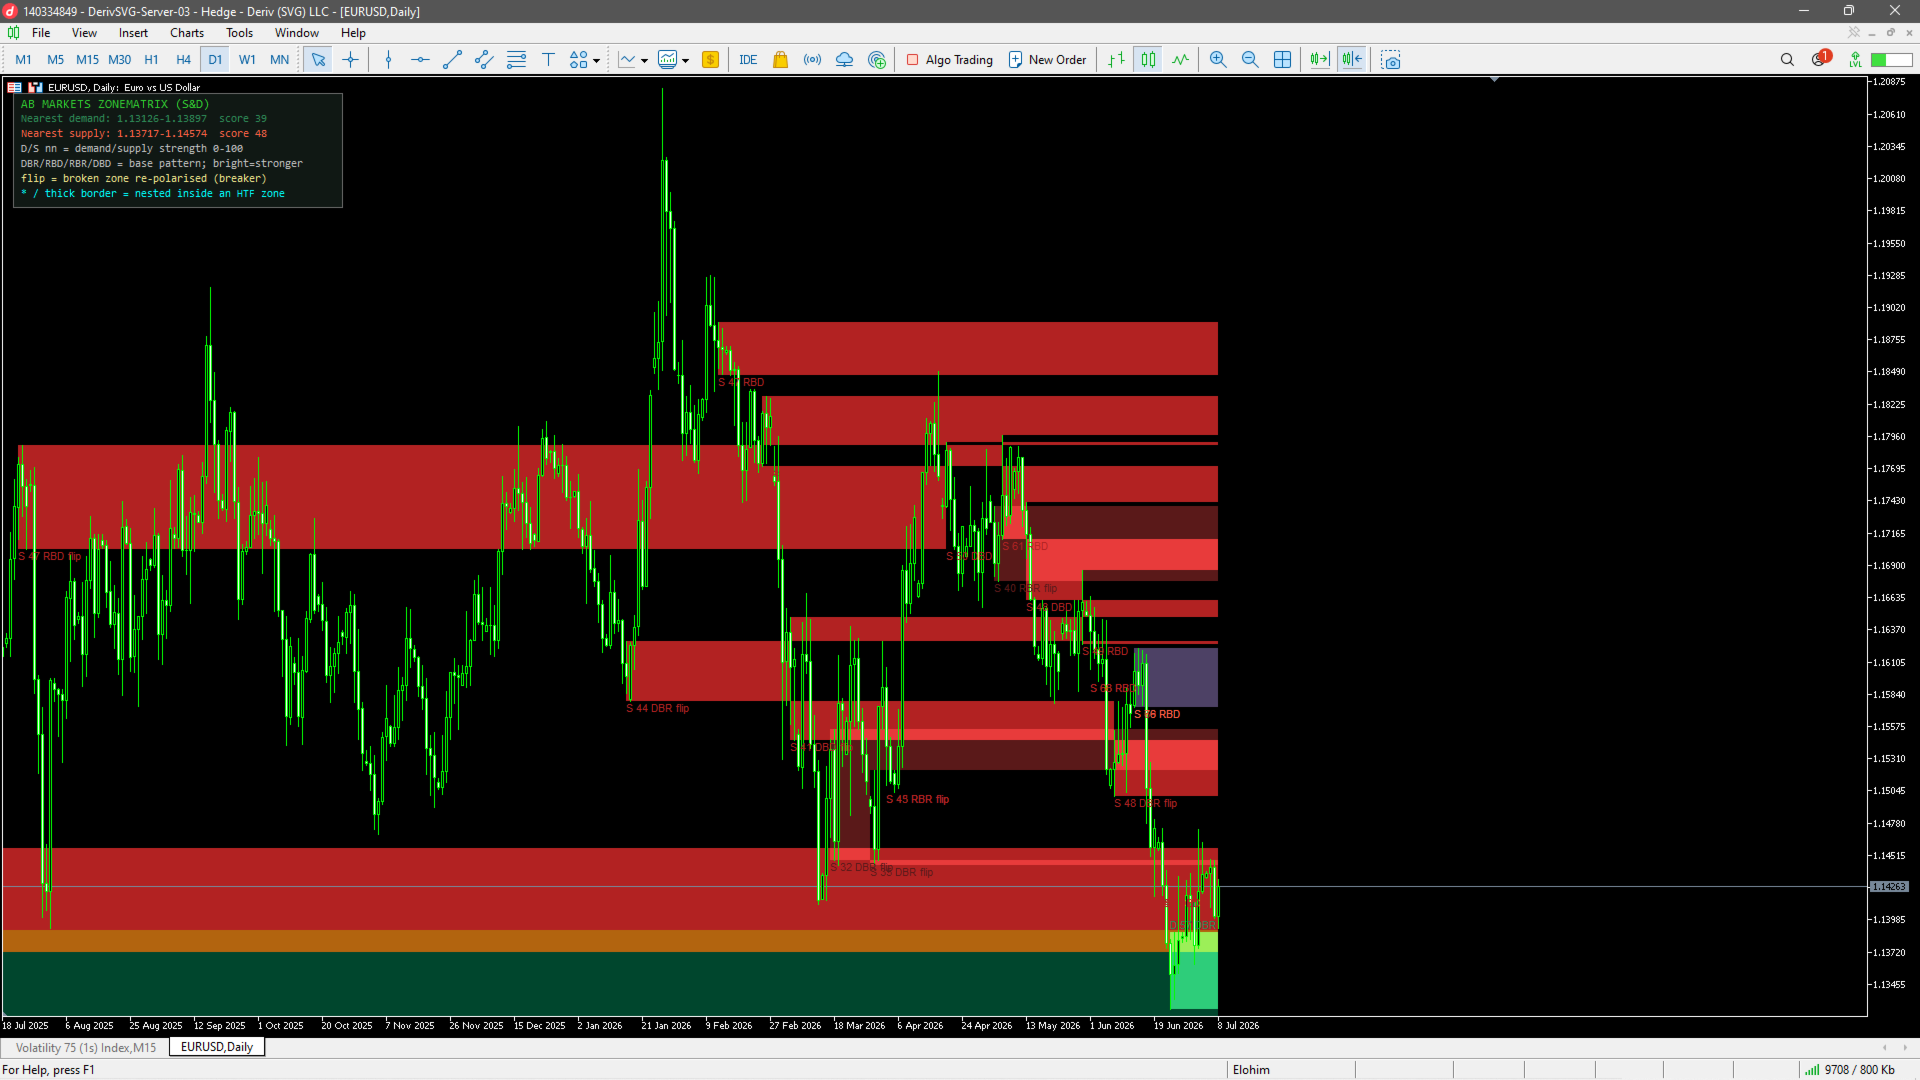
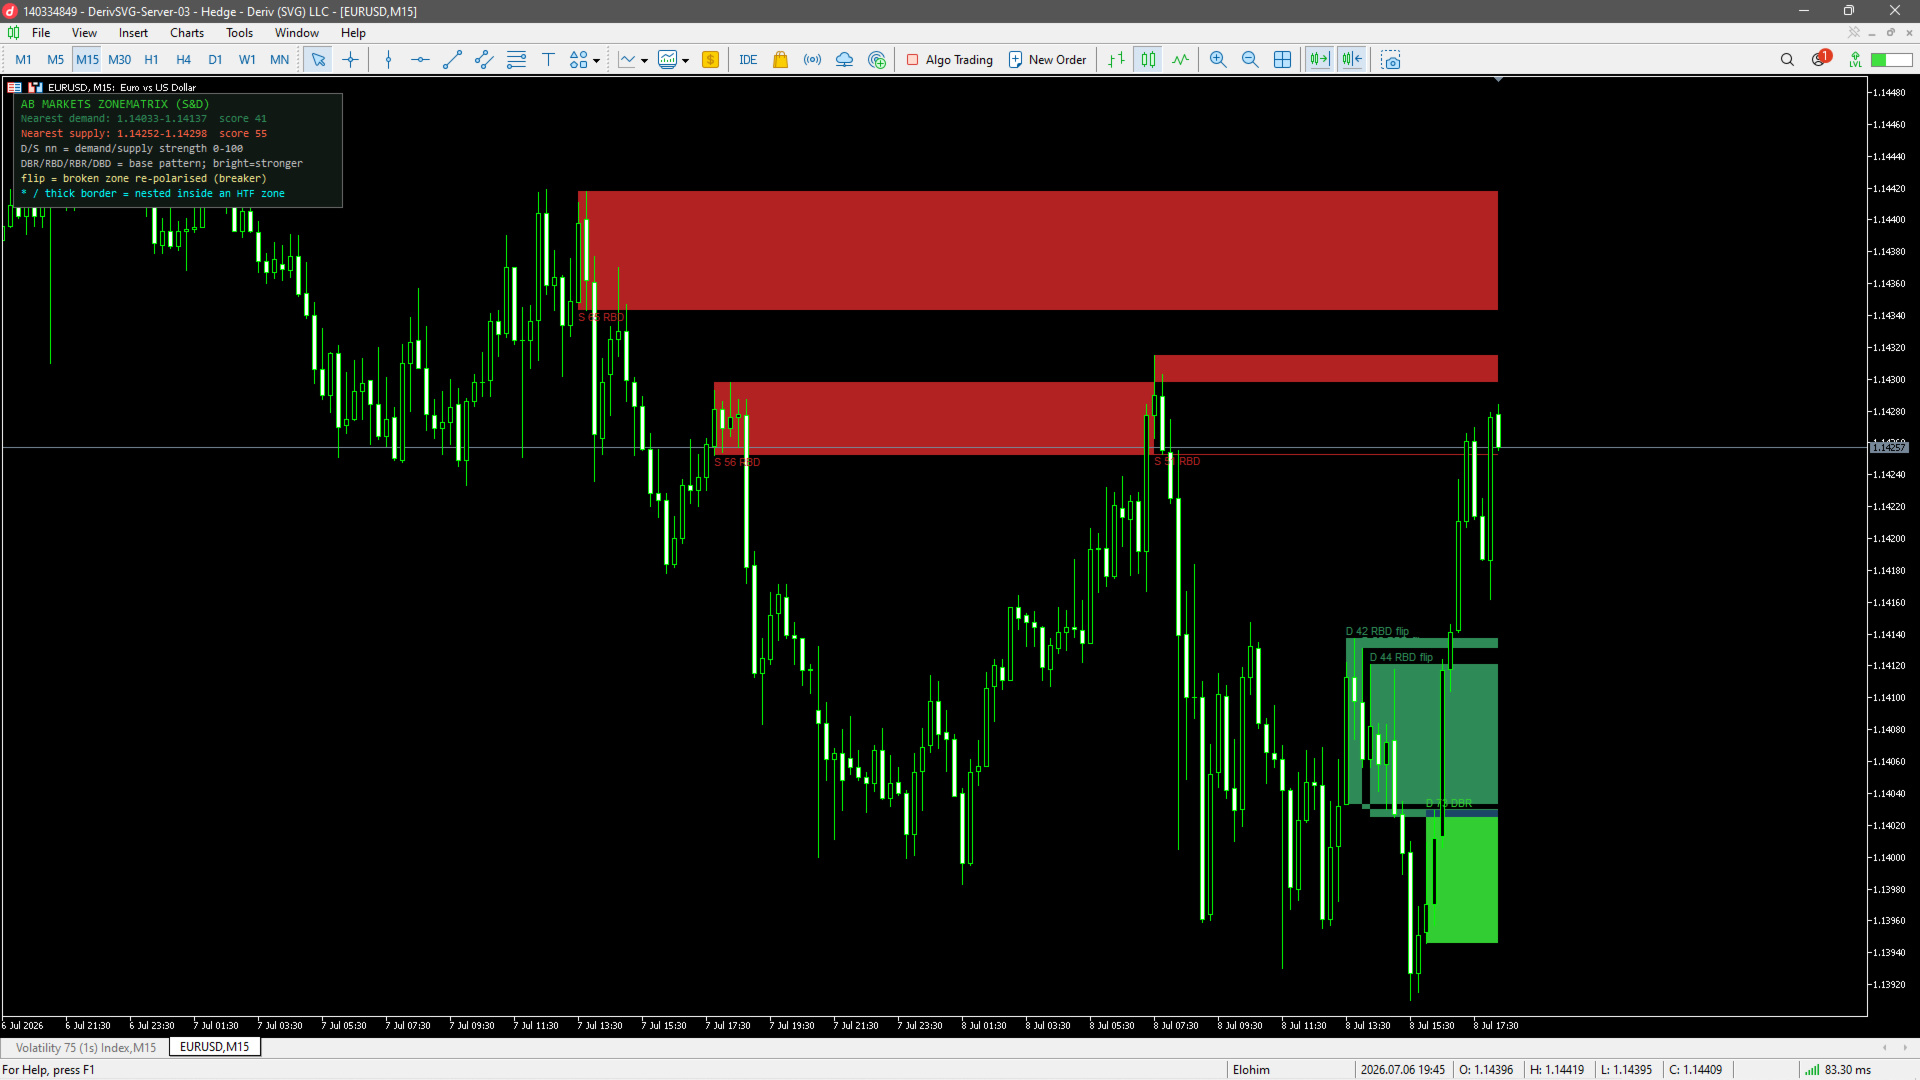
– Base-departure detection — algorithmically finds consolidation bases (overlapping range with compressed volatility) followed by displacement departures. Patterns: Drop-Base-Rally, Rally-Base-Drop, Rally-Base-Rally, Drop-Base-Drop — detected structurally, not by candle names.
– Strength score (0–100) — from departure velocity, time-at-base, freshness (each revisit decays the score), higher-timeframe confluence and origin volume.
– Lifecycle — Fresh, Tested (decaying), Broken (auto-flip: broken demand becomes a supply candidate). Weak and spent zones fade out automatically so the chart never becomes a rectangle graveyard.
– MTF stacking — H4/D1 zones overlaid on the execution timeframe, with a nested-zone highlight when an LTF zone sits inside an HTF zone — the highest-probability locations.
Marketplace description
| Most supply & demand indicators paint rectangles on every consolidation until the chart is unreadable. ZoneMatrix scores zones the way institutions think about them — by the violence of the departure, the time spent building the base, freshness, volume at the origin and higher-timeframe confluence — into a single 0–100 strength score. Zones decay with every test, flip when broken, and fade out when spent, so your chart only ever shows what still matters. The multi-timeframe engine overlays H4/D1 zones on your execution timeframe and highlights nested zones — LTF zones inside HTF zones — the highest-probability real estate on any chart. Alerts on zone entry, zone reaction and zone break. Non-repainting, EA-ready. |