Correlation Risk Manager
- 유틸리티
- 버전: 3.90
- 활성화: 10

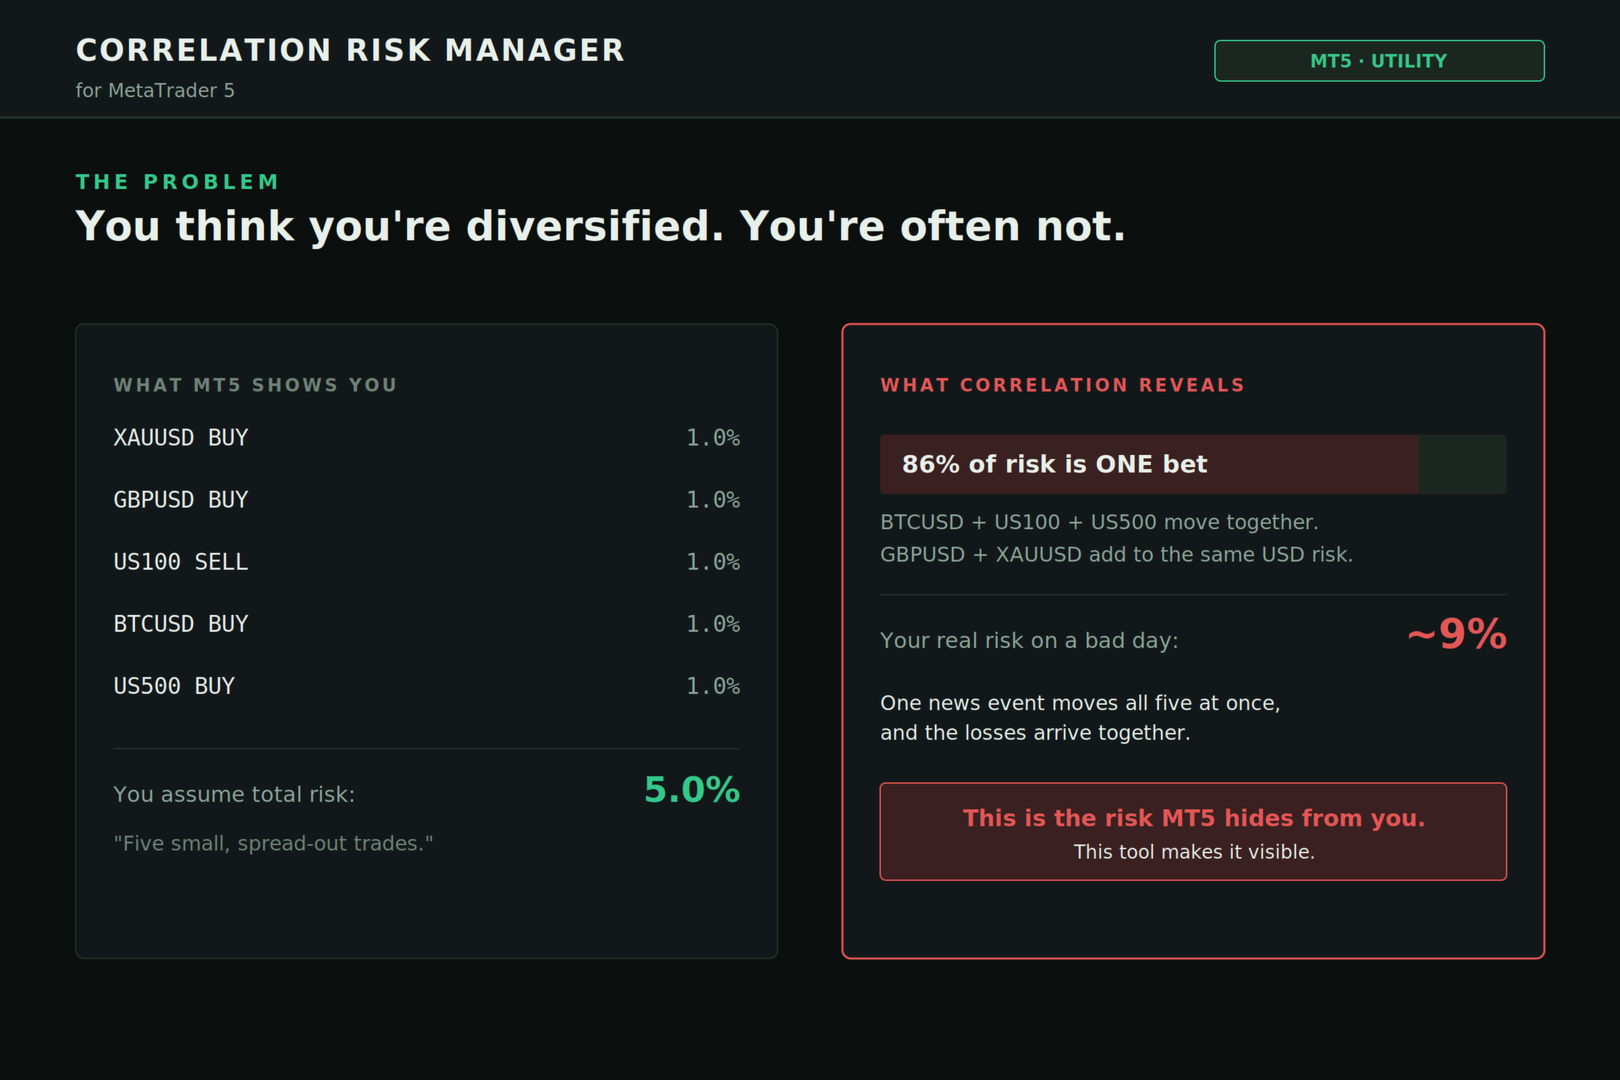
You think you're diversified. Your correlations say otherwise.
MetaTrader shows you every position you hold. The margin, the floating P/L, the lot size, all of it. What it doesn't show you is whether your trades are secretly the same bet. And that's usually what takes the account down.
Say you open five trades, 1% risk on each. Feels like 5% at stake. Spread out, sensible. But three of them are long the same dollar move under different tickers, so when one bad print hits, all three drop together in the same second. That 5% was never 5%. It was closer to 9%. You just couldn't see it until it already happened.
This tool fixes that. It reads your whole account, measures how your positions actually move together, and shows you the real risk while you can still do something about it.
I built it because I kept trying to judge correlation in my head and kept getting it wrong. I do quant finance for a living, so this is the risk math the desks use, not arrows and hype. It runs live on your chart and tells you the truth in language you can act on.
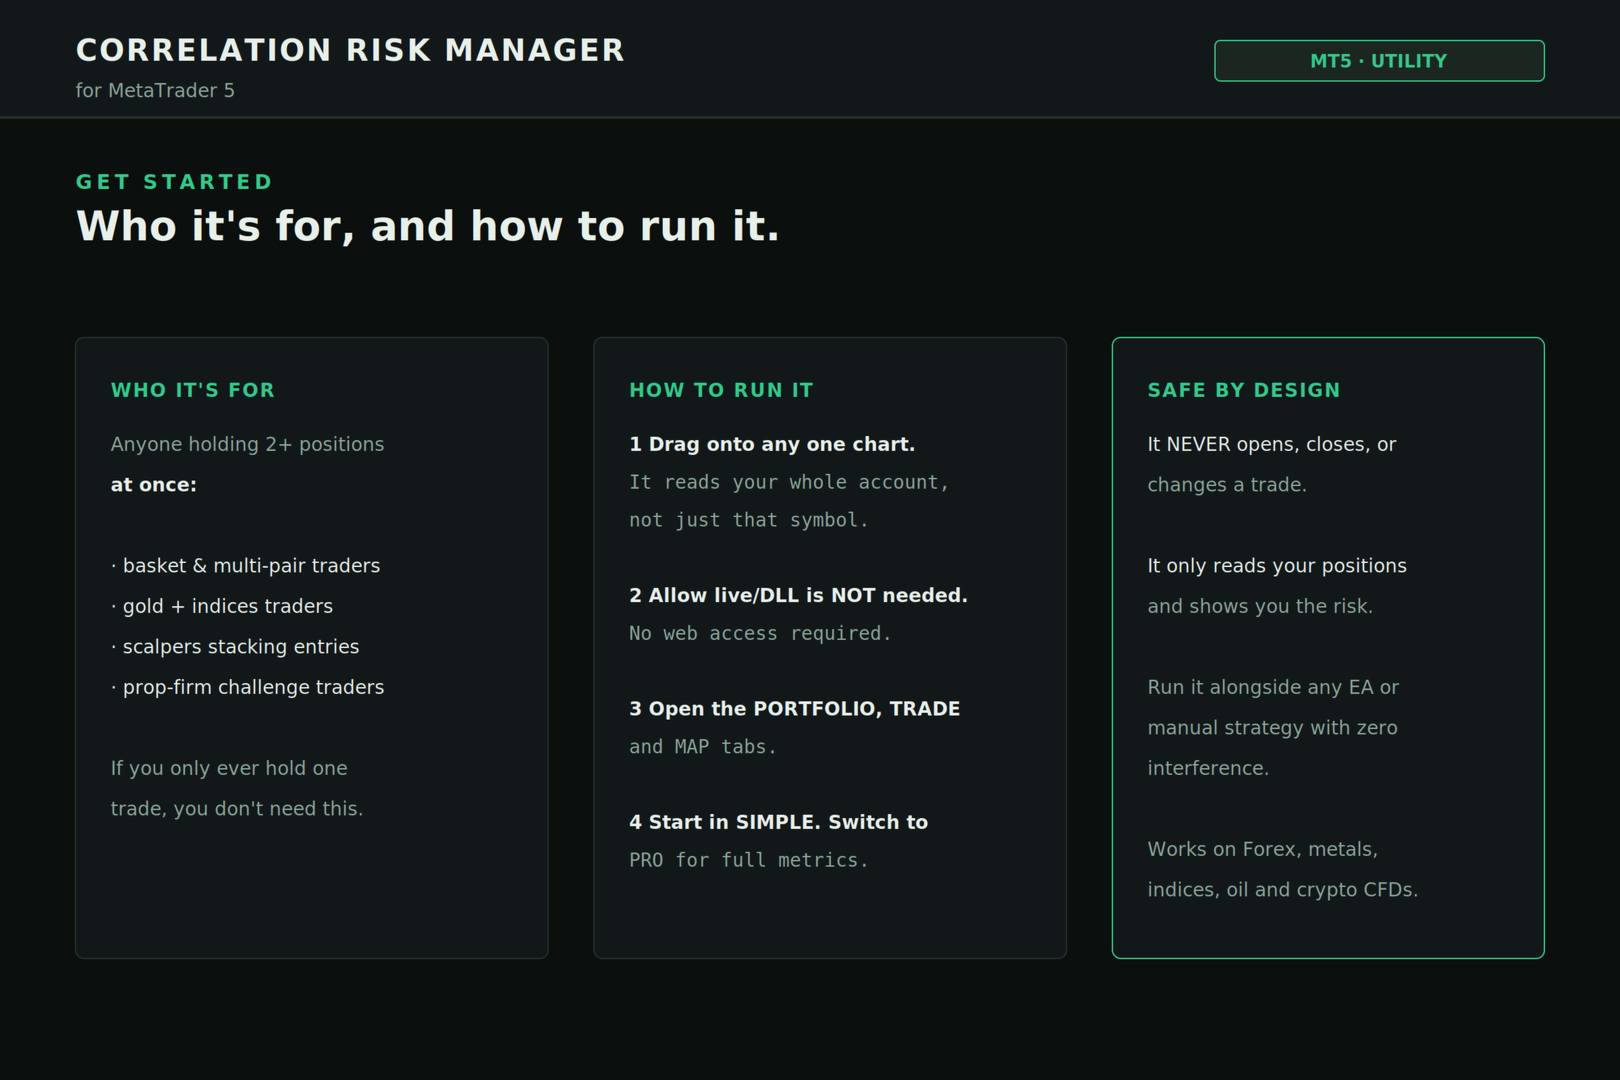
It never touches your trades. Doesn't open, close, or change anything. It reads, it calculates, it warns you. Run it beside any EA or manual strategy and it stays out of your way.
────────────────────────────────
WHO THIS IS FOR
Hold one trade at a time and you don't need this. Save your money.
Hold two or more and it's built for you:
– Basket and multi-pair traders – Gold-and-indices traders – Scalpers stacking entries into the same move – Prop-firm challenge and funded traders guarding a daily loss limit
Correlation stays invisible until it hurts. The more positions you carry, the more this earns its spot on your chart.
────────────────────────────────
WHAT IT DOES
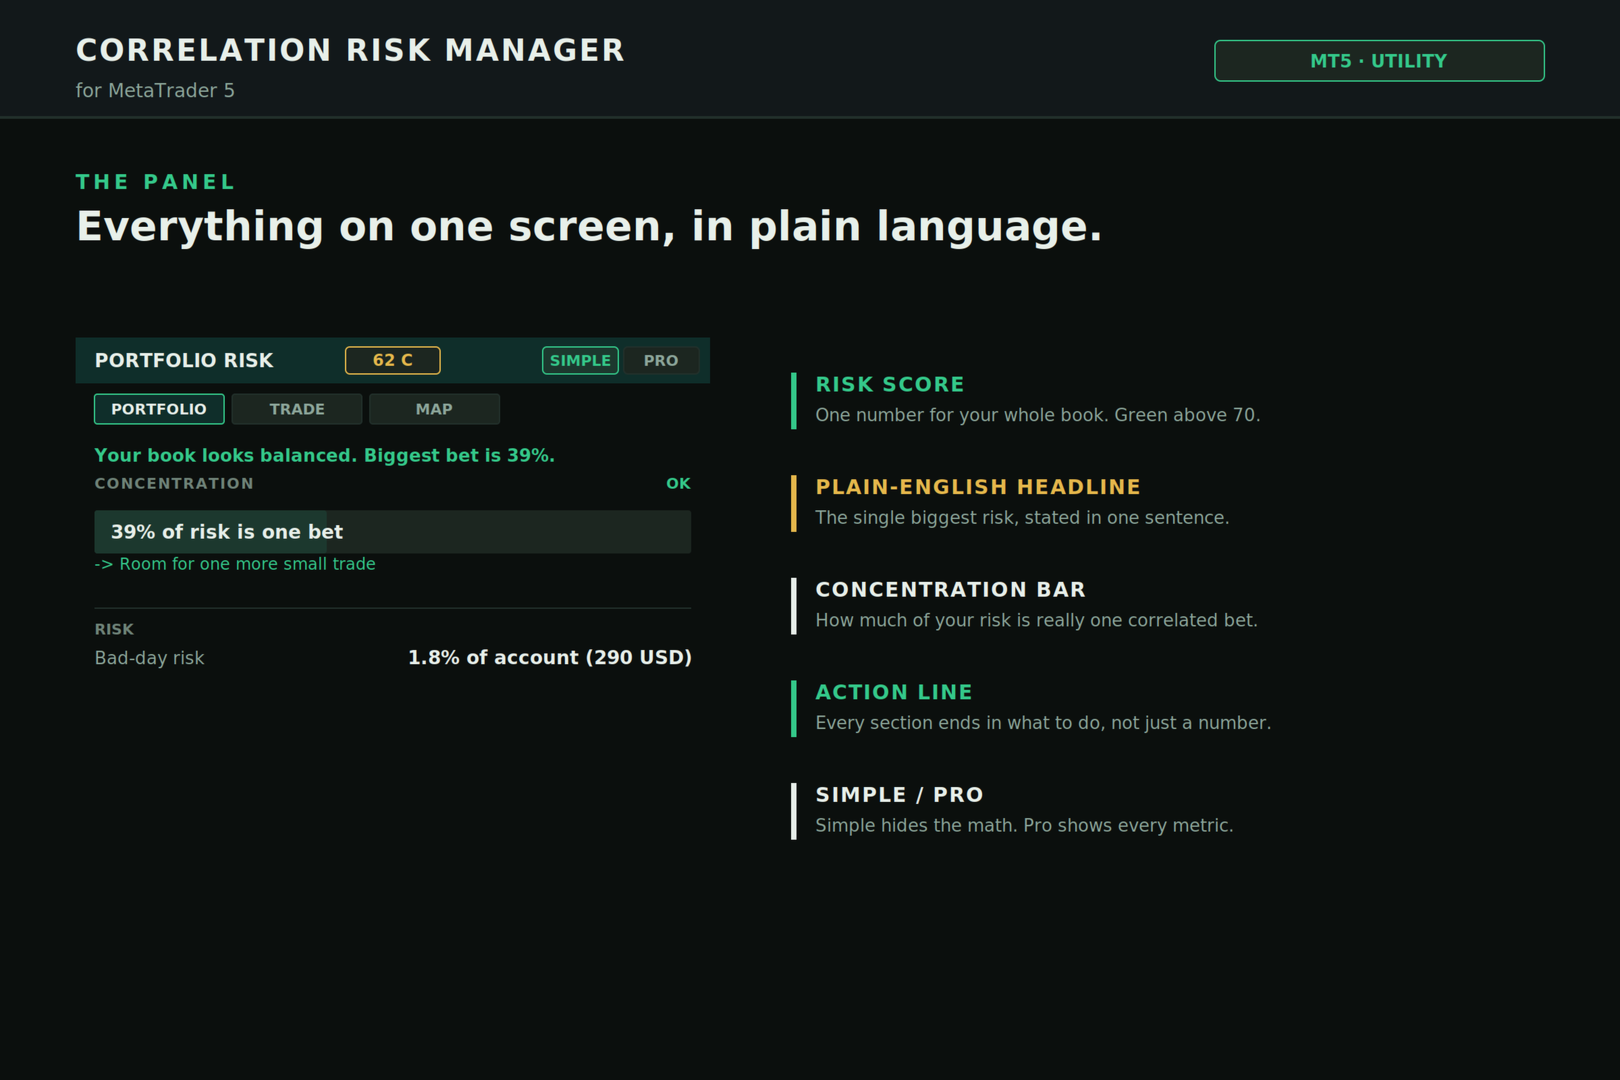
Three tabs. Each answers a question you're already asking yourself, faster and without the guesswork.
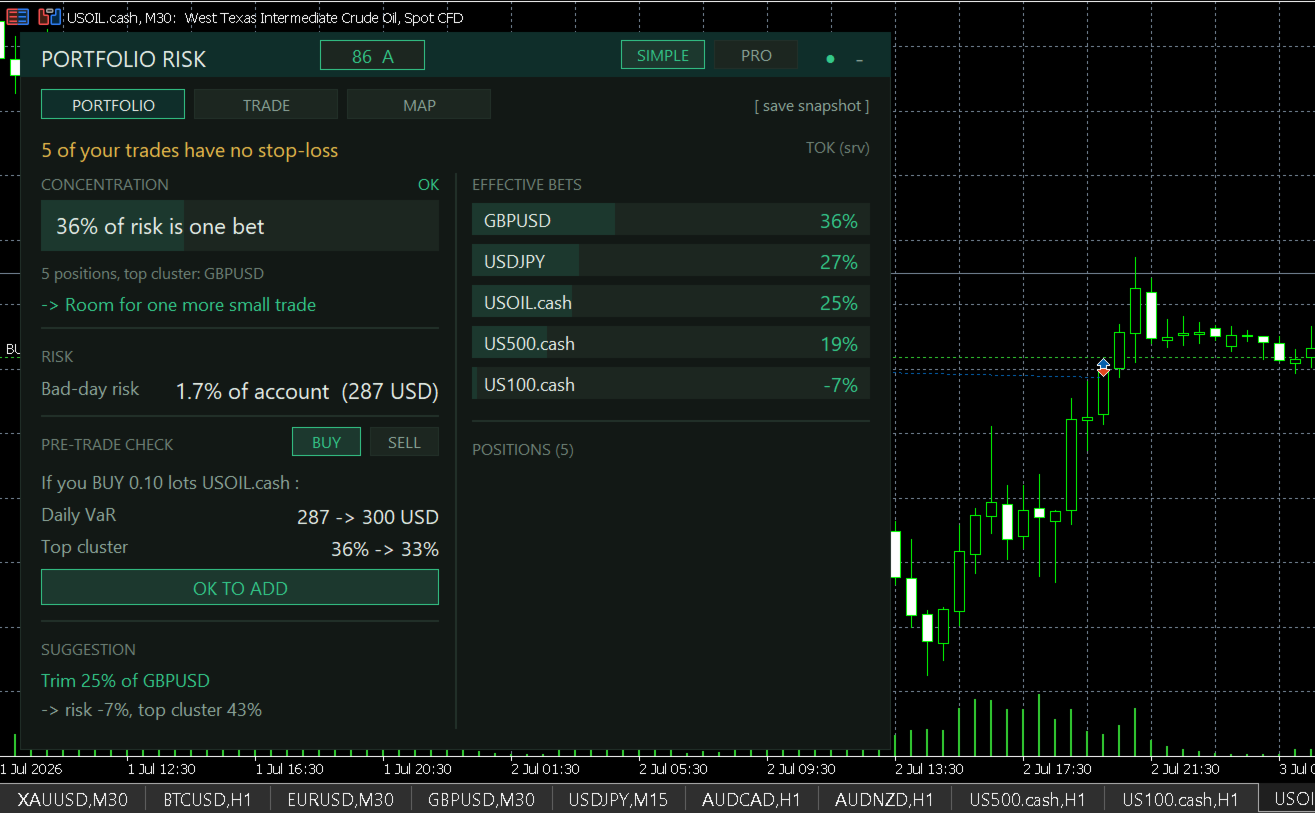
■ PORTFOLIO — where do I stand right now?
A single Risk Score for your whole book, 0 to 100 with a letter grade. One look tells you if you're fine or overextended. Green is good. Under it, one plain sentence naming your biggest risk at that moment, so you don't have to decode a dashboard to know what's about to bite.
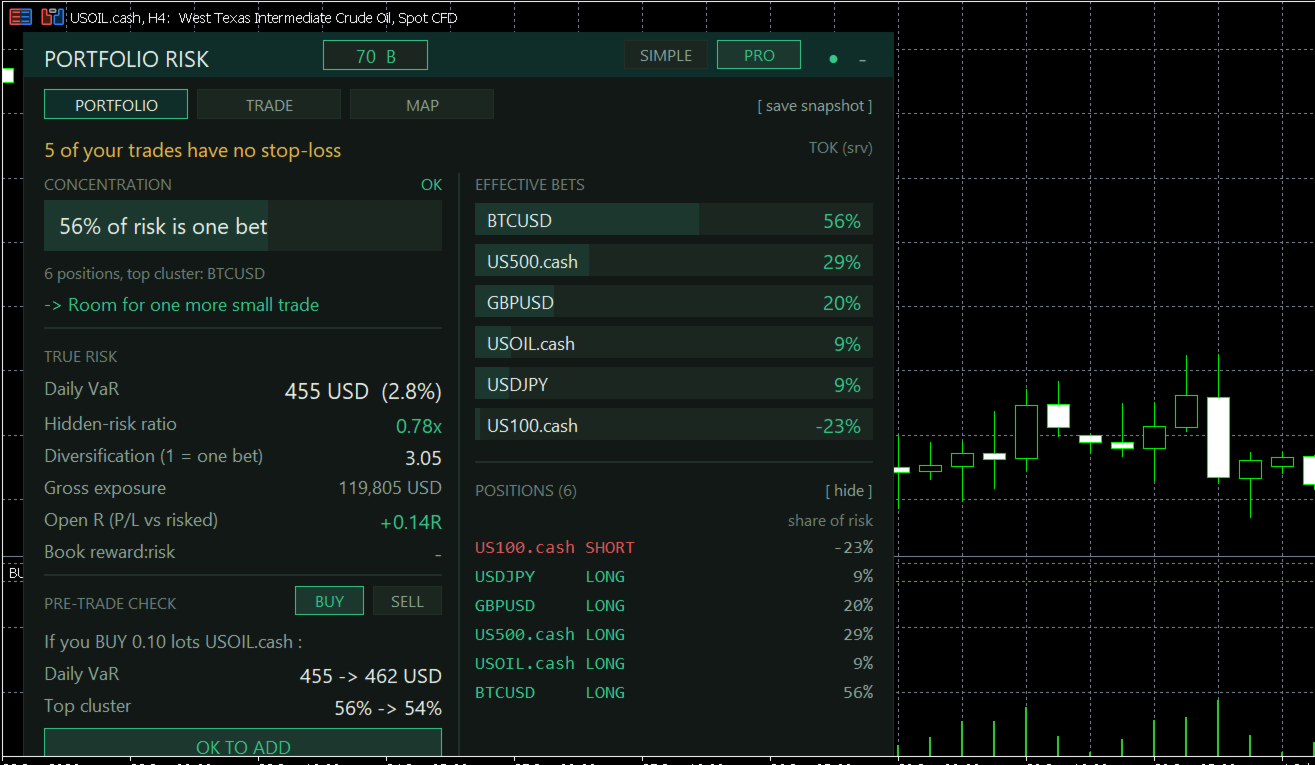
Then: how concentrated you are (how much of your risk is really one bet), your bad-day loss in real money and as a percent of the account, how many genuinely independent bets you're actually holding, and a straight call on what to do next. Not just a number. A move.
That bad-day figure is a true portfolio VaR. It accounts for how your trades move together instead of naively stacking individual risks the way cheaper tools do. That gap is the whole reason this exists.
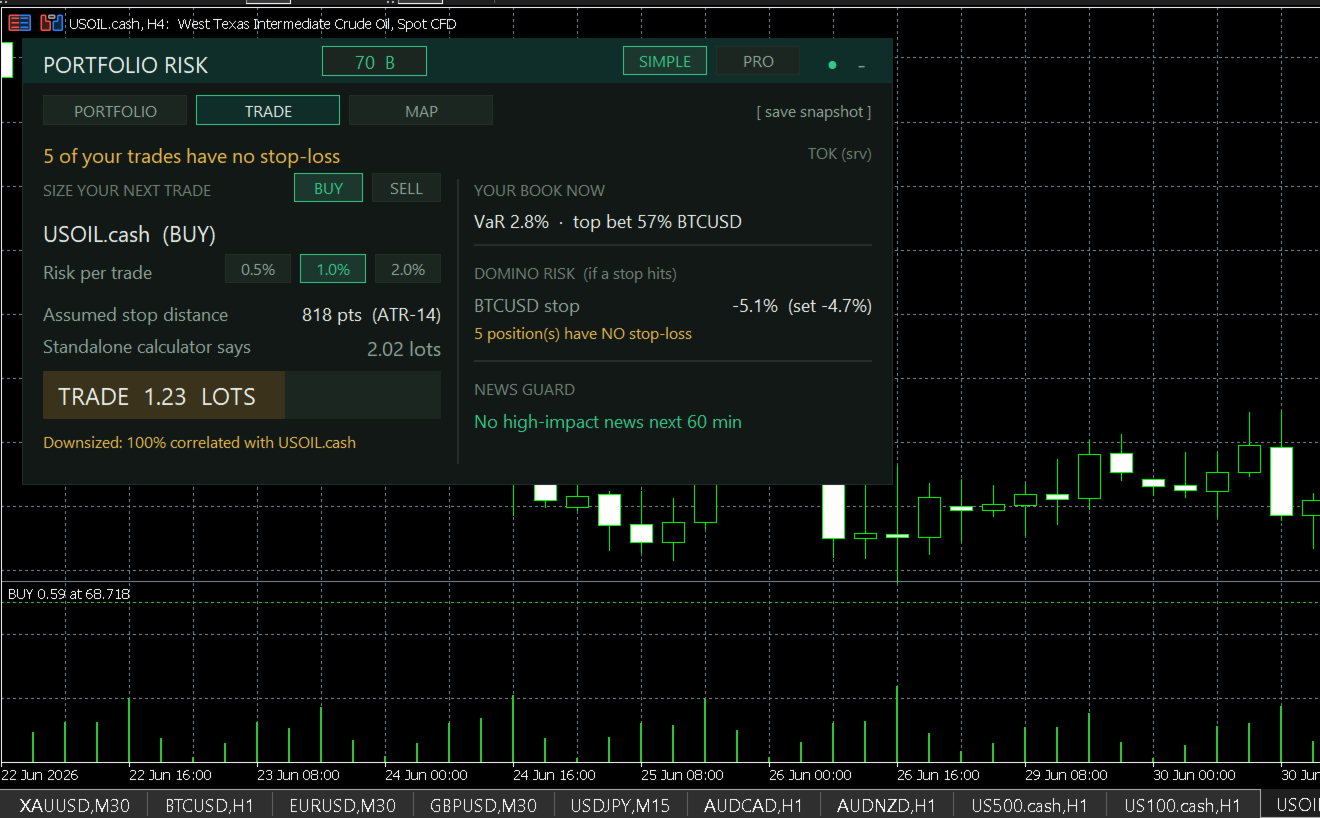
■ TRADE — how big should my next trade be?
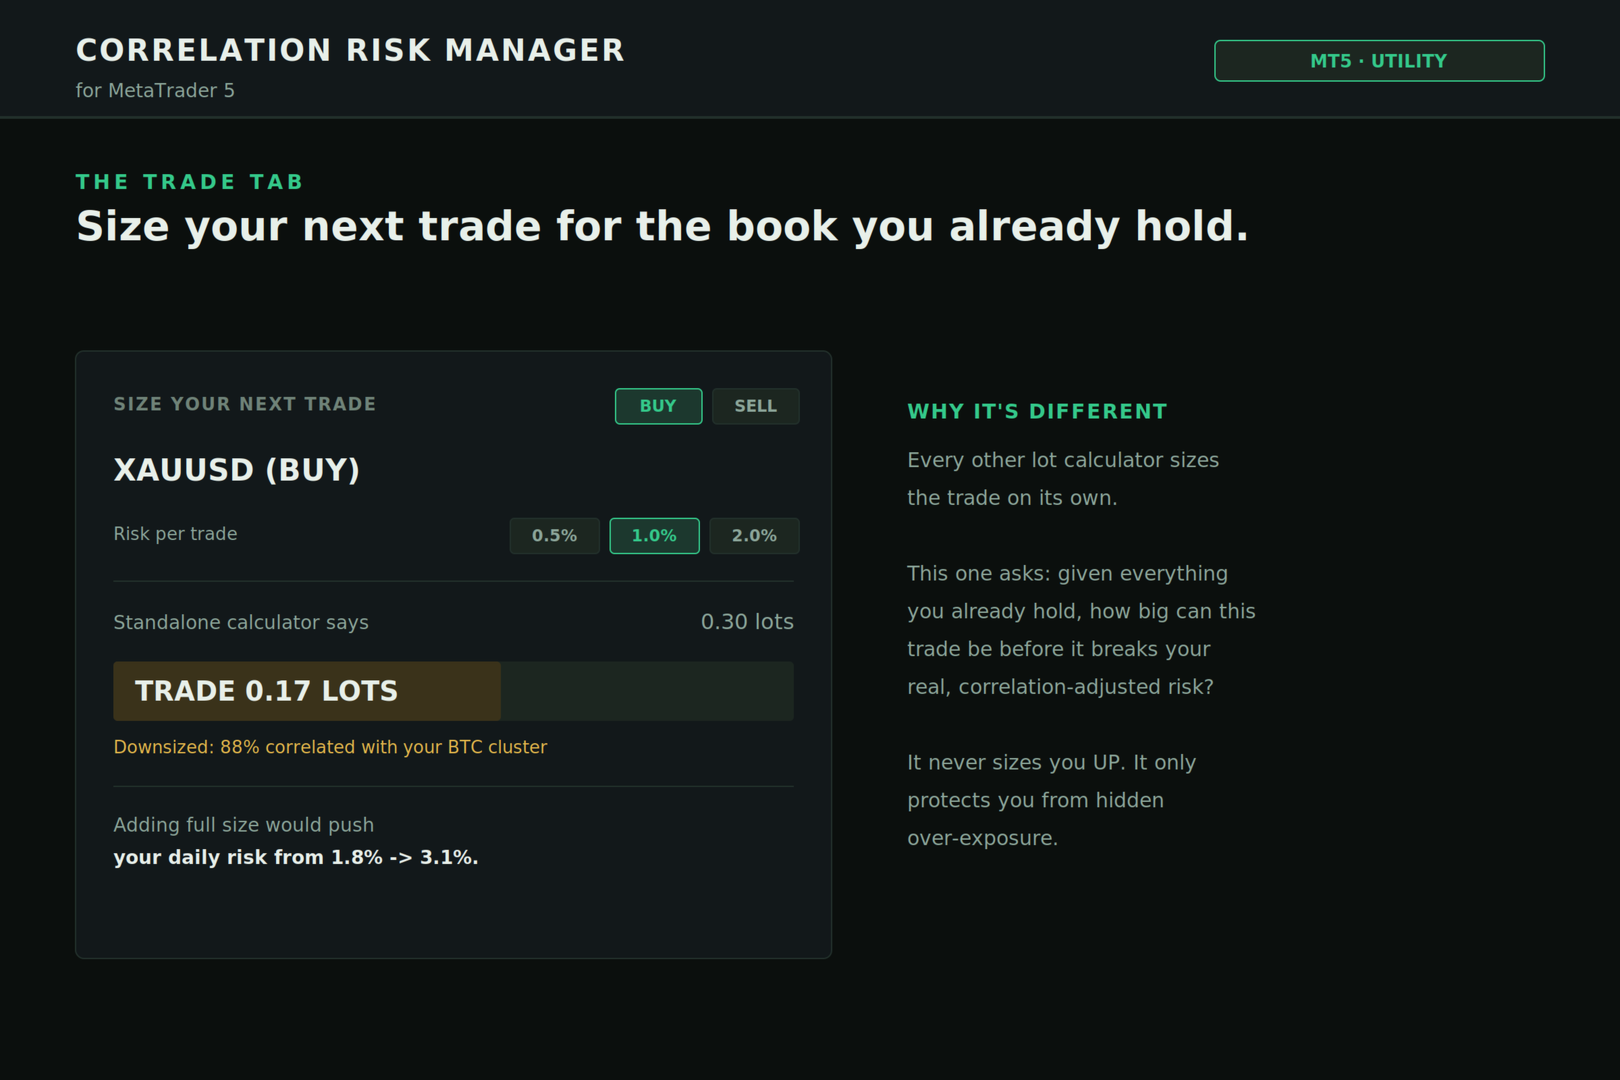
Every lot calculator out there sizes a trade like it's the only one you've got. This one knows what you're already holding.
Pick BUY or SELL, pick your risk (0.5, 1, or 2 percent), and you get two numbers. What a normal calculator would say, and what you should actually trade once your open book is factored in. When they disagree, it tells you why, in plain words: "Downsized: 88% correlated with your BTC cluster." It will never size you up. It only stops you from quietly doubling a bet you already hold.
Two more things on this tab, and they're the ones that save accounts:
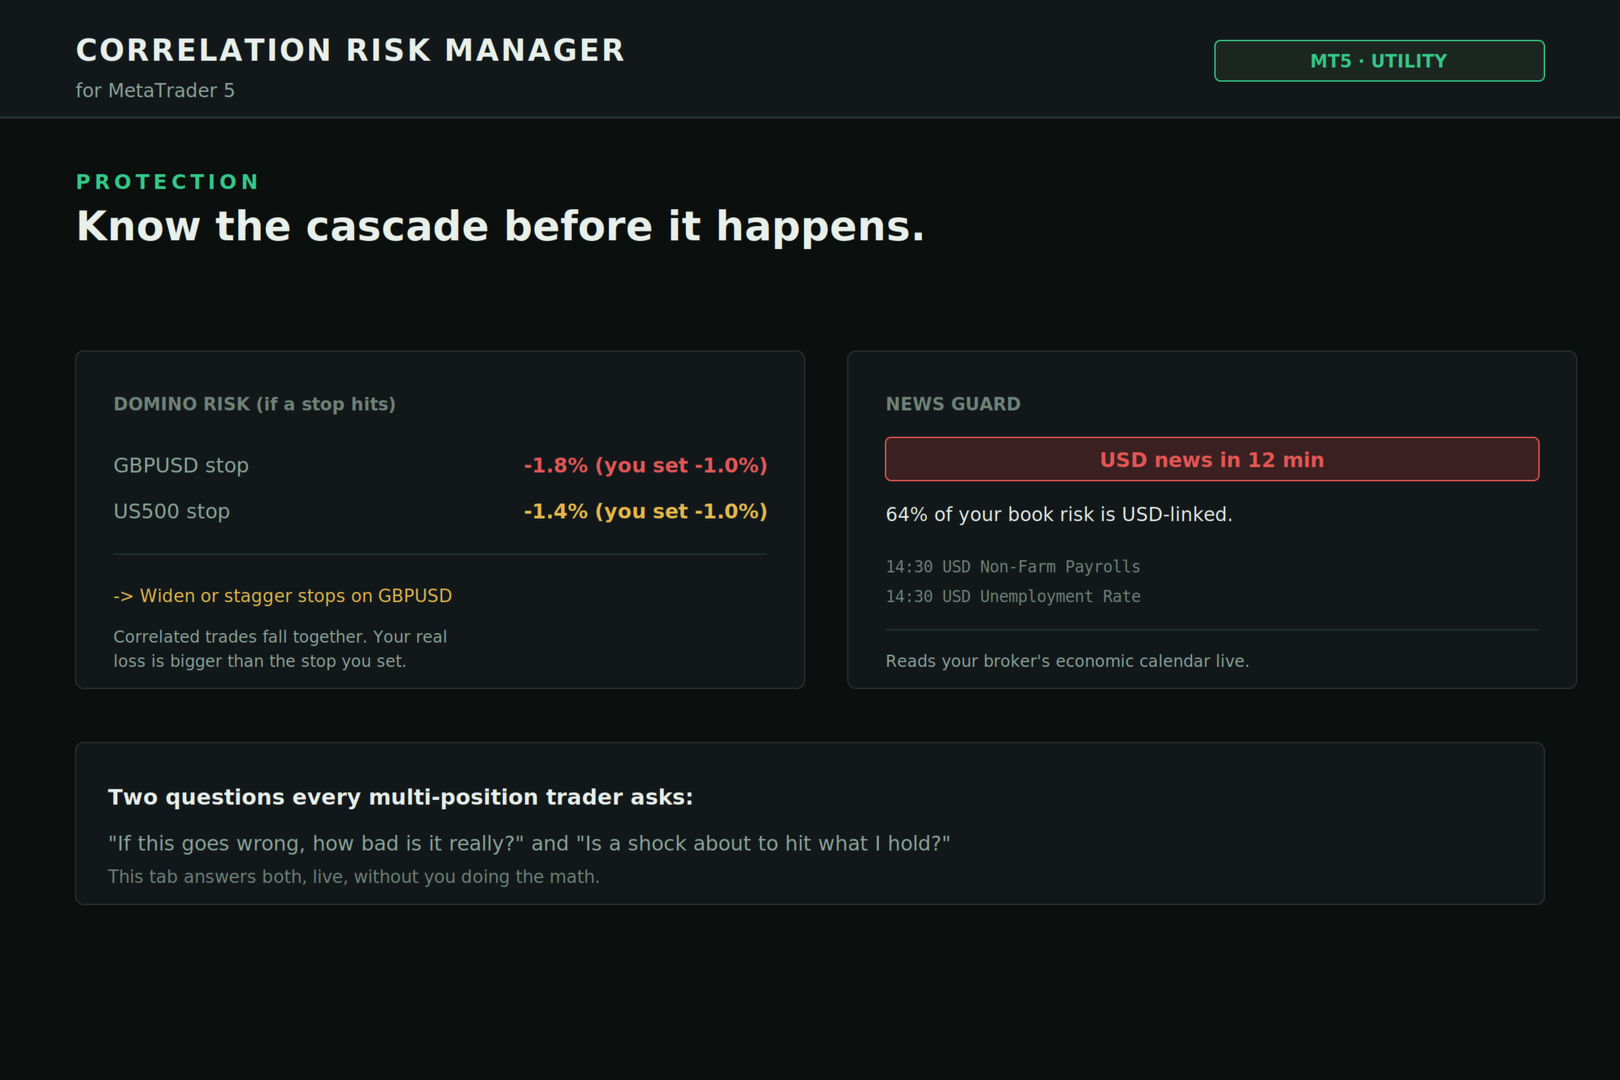
Domino Risk. When a stop gets hit, the correlated trades are usually dropping with it. This shows the real total damage, not the tidy number you set on that single position. You set -1%. Reality says -1.8%. Better to know beforehand.
News Guard. It reads your broker's economic calendar live and flags a high-impact event about to land on a currency your book is loaded on. No more getting caught full-size into a release you forgot was coming.
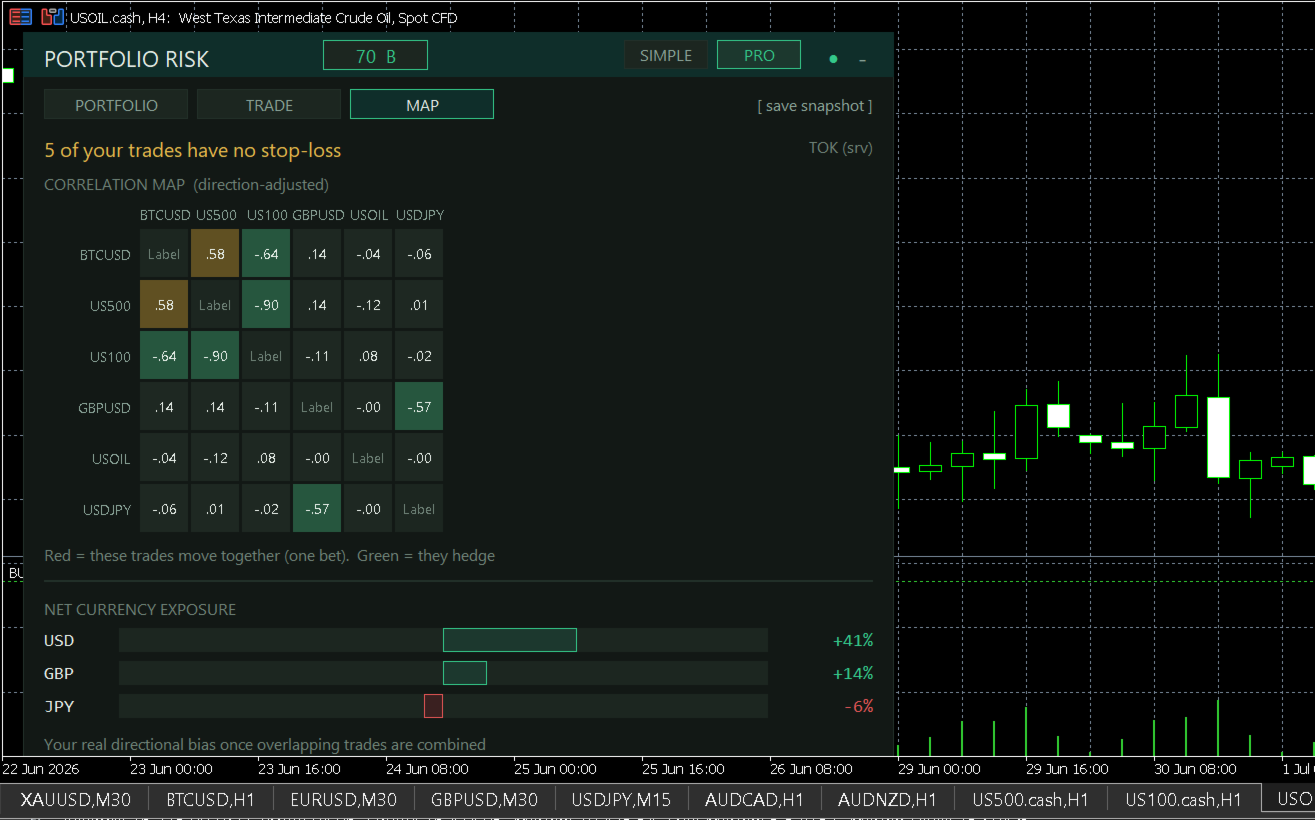
■ MAP — which of my trades are secretly the same bet?
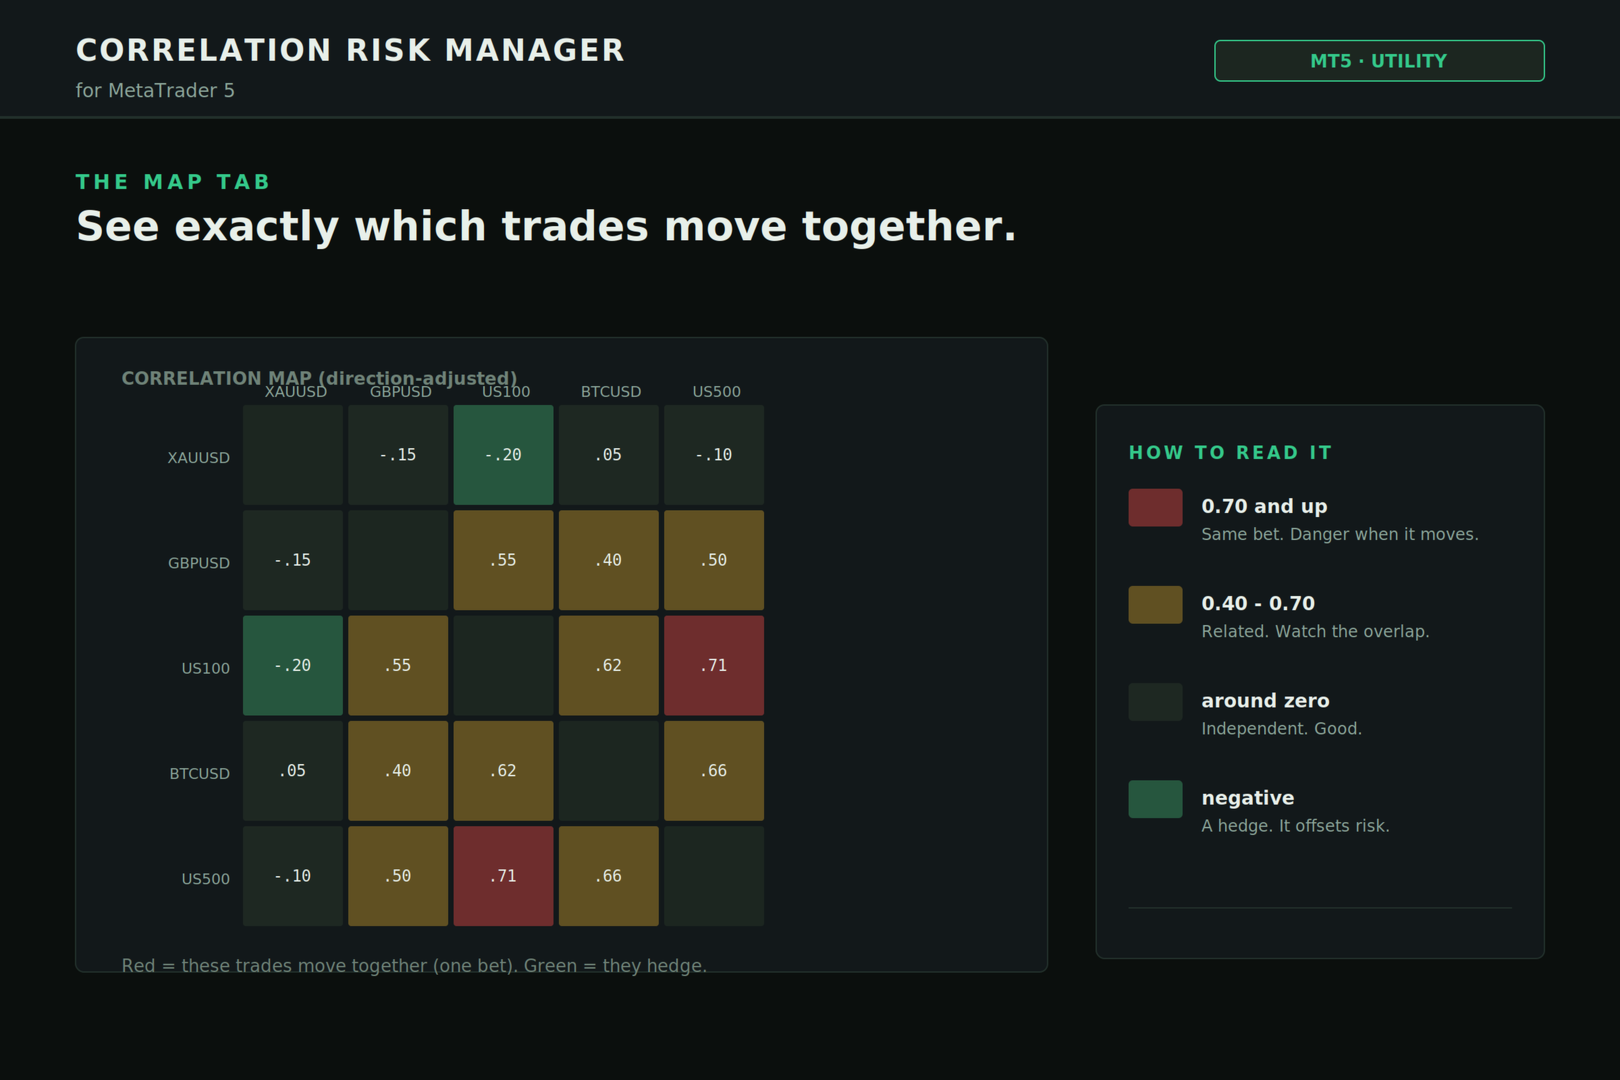
The picture MetaTrader will never draw for you. A live, direction-adjusted correlation heatmap of everything you hold. Red cells move together, one bet pretending to be several. Green cells hedge. You'll spot clusters you didn't know you had.
Below it, your net currency exposure once the overlap is combined. Long GBPUSD and long USDJPY doesn't feel like a big dollar position until it's stacked into one bar in front of you.
────────────────────────────────
HOW TO USE IT, START TO FINISH
-
Drag it onto one chart. Just one. It reads your entire account, not only that symbol, so a single instance covers everything you're running.
-
Nothing to set up first. No DLLs, no web permissions, nothing to whitelist. Works out of the box.
-
It opens in SIMPLE. Risk Score, the one-line headline, your concentration, one clear action. For most traders that's the whole job, at a glance, all day.
-
Want the full engine? Hit PRO. Every metric shows up: hidden-risk ratio, diversification, gross exposure, open R, book reward-to-risk. Same panel, more depth, your call.
-
Before a new order, open TRADE. Set direction and risk. Read the size and the reason. Then place the trade you meant to place instead of the one that quietly wrecks your book.
-
Open MAP when you want the full view of how your positions interact. That's the one worth screenshotting for your journal.
-
New to any of these terms? Tap one on screen. Risk Score, hidden risk, domino, all of them explain themselves in plain language right there in the panel. You don't need a finance degree to run this. I have one, and it's already in the math so you don't have to.
-
Minimize it to the title bar when you want it gone. Bring it back when you need it.
────────────────────────────────
WHEN IT EARNS ITS KEEP
– Right before adding to a position. See if you're spreading risk or doubling down blind. – Running a basket. Watch the effective number of bets, not the position count. – Gold, indices, and a couple of majors together. Half of it is the same risk-on bet. Now you can measure how much. – Chasing a prop challenge. Keep your real, correlation-adjusted risk under the daily limit instead of guessing at it. – Ahead of a news window. Know how exposed the whole book is, not just the pair on your screen. – Any time you catch yourself wondering, am I actually spread out here, or does it just look that way.
────────────────────────────────
SETTINGS YOU CONTROL
– Correlation model: the timeframe and how much history used to measure trades moving together. – Risk model: confidence level, daily scaling, and an optional fixed equity for what-if planning. – Severity thresholds: where CAUTION turns into DANGER, set to your own tolerance. – Sizer: your default target risk, and a manual stop distance if you'd rather not use the automatic ATR estimate. – News guard: how far ahead to look, and whether to include medium-impact events. – Alerts: a pop-up (and optional phone push) the moment concentration or bad-day risk crosses your danger line. – Panel: position, refresh rate, and an interface scale so it stays sharp on any screen, high-DPI included.
────────────────────────────────
WHY THIS ONE
Most risk tools on the market are a drag-to-calculate lot box or a one-click order panel with a stop button. Handy, but none of them measure correlation, true portfolio VaR, clustering, or a stop cascade. They can't tell you your five trades are one bet, because they never look.
This does the full quant layer, then explains it in plain English so you can use it mid-session. Institutional risk math plus a panel a normal trader reads at a glance. That combination is the gap, and it's what you're paying for.
I won't promise you profit. Nobody honest can, and anyone who does is selling you something. This gives no signals and predicts nothing. What it does is rarer, and if you trade more than one thing at once, more useful: it shows you the risk you're actually carrying, so you trade the size you meant to and stop getting ambushed by losses that show up in packs.
────────────────────────────────
STRAIGHT TALK
– It's advisory. Never sends, modifies, or closes an order. Zero interference with your strategy or your EAs. – Built for live charts. The correlation and news features run on your live account, not in the Strategy Tester. – News accuracy depends on your broker's calendar feed. Most are fine, some are thin. It'll say so honestly rather than invent something. – Trading carries risk of loss. This helps you see and manage it. It doesn't erase it. Past results don't guarantee future ones.
────────────────────────────────
Updates are coming and they're free for buyers. If something's unclear or you want a feature, message me. I read them, and I built this because I use it myself.
Stop guessing whether you're diversified. Look.