Candlestick Scanner

캔들스틱 스캐너 — 자동 패턴 감지기

요약

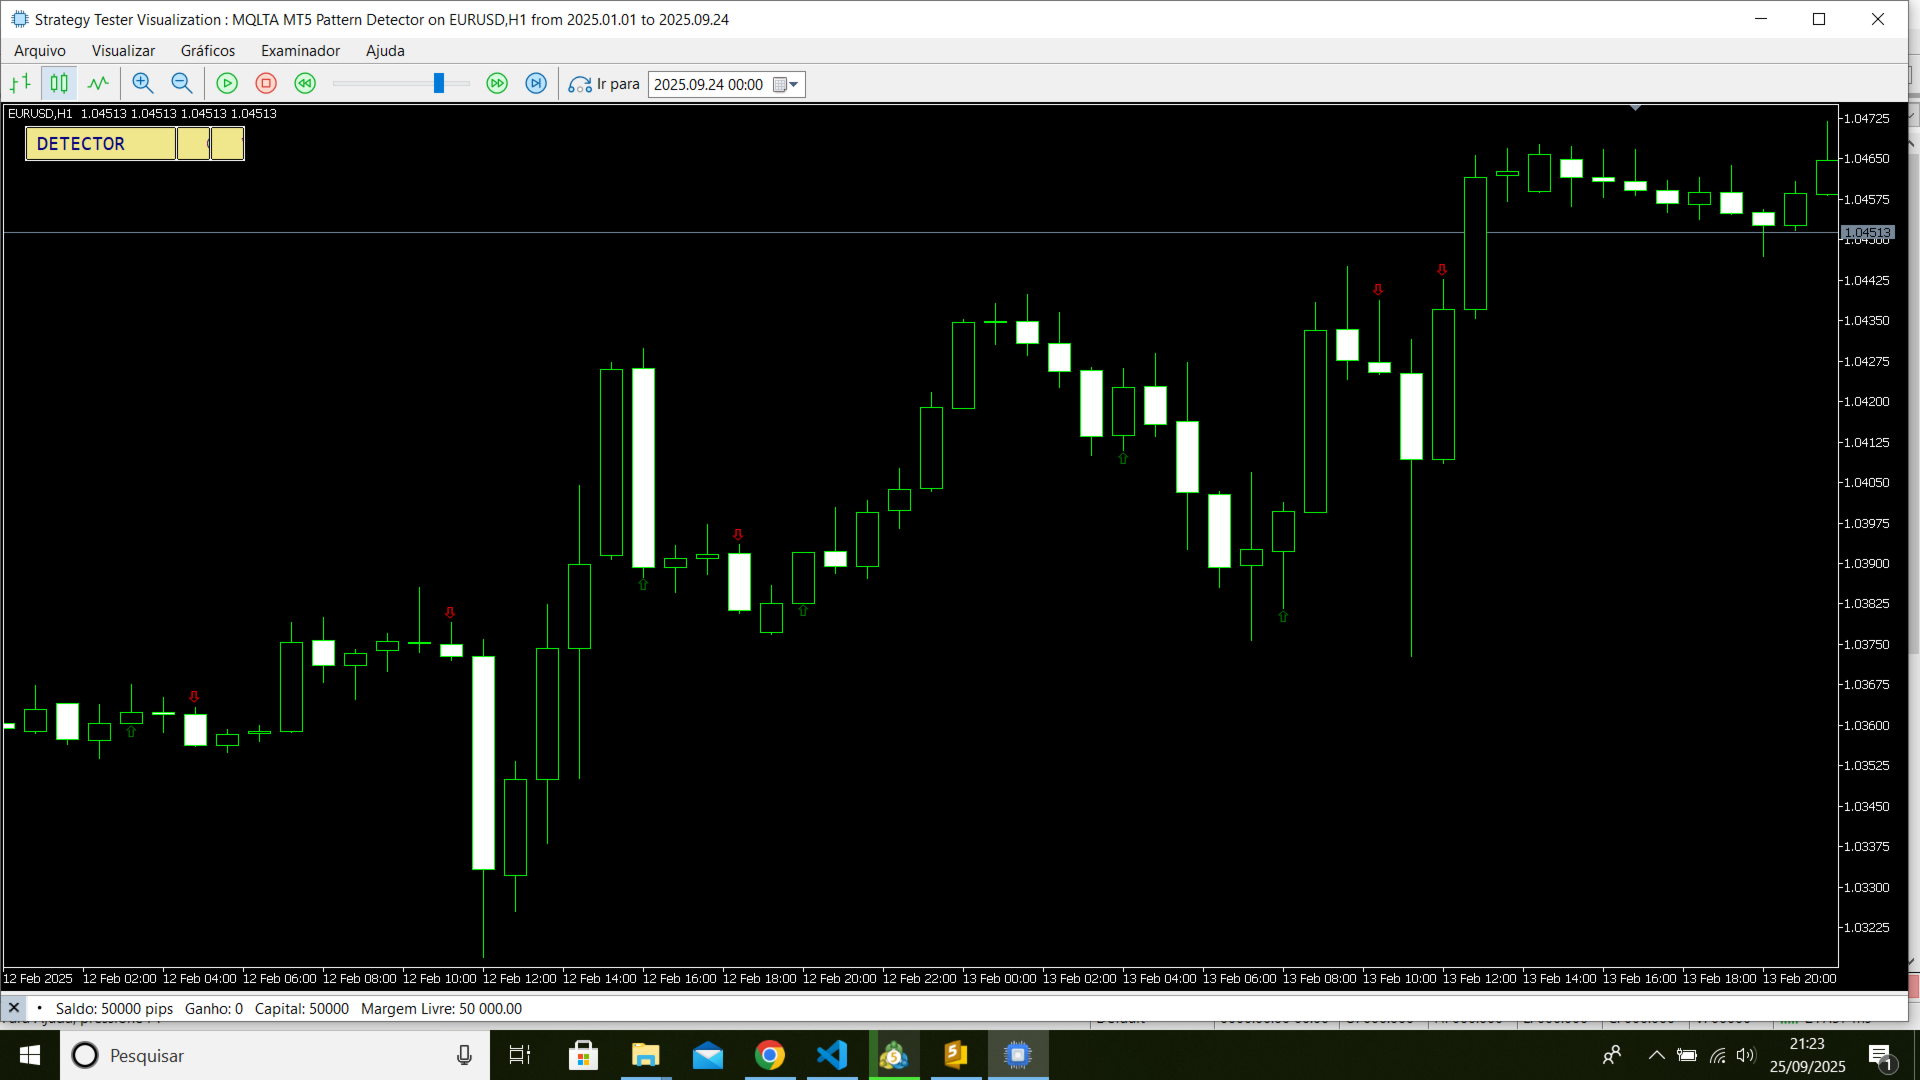
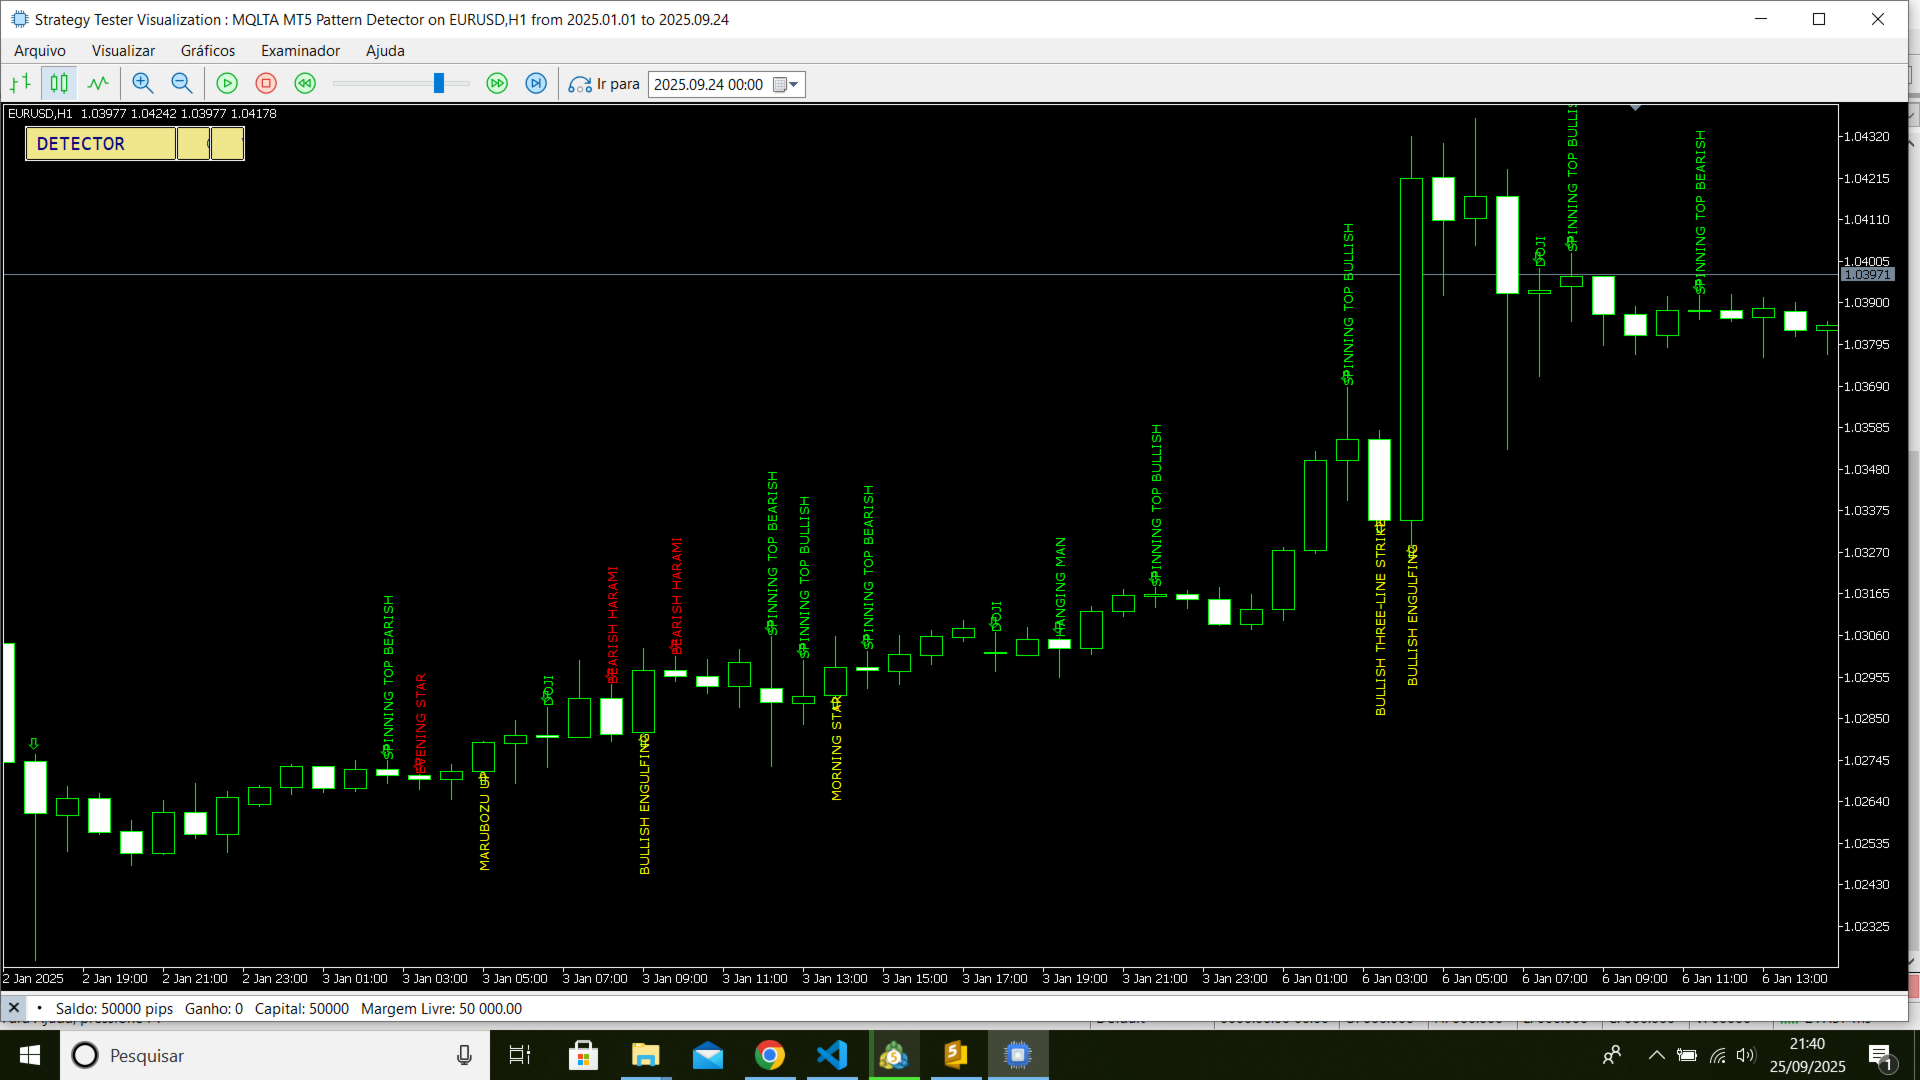
캔들스틱 스캐너는 과거 데이터와 실시간 캔들 모두에서 20가지가 넘는 고전적인 캔들스틱 패턴을 자동으로 식별하는 강력한 도구입니다. 감지된 각 패턴에 대해 이 지표는 차트에 명확한 라벨을 그리고, 화살표로 캔들을 가리키며, EA(Expert Advisor) 및 스크립트와의 통합을 위한 데이터를 제공합니다. 완벽한 알림 시스템(경고, 푸시, 이메일)을 포함하여 기회를 절대 놓치지 않게 해줍니다.

[이미지: 지표가 차트에서 여러 가지 강세 및 약세 패턴을 식별하는 스크린샷.]

주요 기능

  • 포괄적인 감지: 도지(Doji), 인걸핑(Engulfing), 해머(Hammer), 모닝/이브닝 스타(Morning/Evening Star), 삼백병사(Three White Soldiers) 등 20가지 이상의 패턴을 식별합니다.

  • 명확한 시각적 신호: 패턴 이름이 포함된 회전 텍스트 라벨과 해당 캔들을 가리키는 화살표를 그립니다.

  • 상호작용형 제어판: 차트의 미니 패널을 통해 클릭 한 번으로 감지를 일시 정지/재개하고 시각적 개체를 지울 수 있습니다.

  • 자동화를 위한 버퍼: 두 개의 데이터 버퍼(Pattern DirectionPattern Detected)를 노출하여 EA 및 스크립트와의 쉬운 통합을 지원합니다.

  • 알림 시스템: 설정 가능한 경고(Alert / Push / Email)를 전송하며, 스팸을 방지하기 위해 캔들당 1개의 알림으로 스마트하게 제한합니다.

  • 높은 맞춤 설정: 방향(강세, 약세, 불확실)별, 그룹별 또는 개별적으로 패턴을 필터링할 수 있습니다. 라벨의 색상과 글꼴도 완전히 조정 가능합니다.

  • 고해상도(HiDPI) 화면 호환성: 모든 모니터에서 완벽한 보기를 보장하기 위해 인터페이스가 자동으로 조정됩니다.

차트에서의 작동 방식

패턴이 식별되면 지표는 다음 작업을 수행합니다.

  • 라벨 생성: 패턴 이름(예: "Bullish Engulfing")이 포함된 텍스트가 캔들 옆에 그려집니다.

  • 화살표 생성: 관련 캔들의 상단 또는 하단을 가리키는 화살표 아이콘이 생성됩니다.

  • 버퍼 업데이트: 다른 프로그램이 신호를 읽을 수 있도록 데이터가 채워집니다.

  • 알림 전송: 활성화된 경우 플랫폼, 휴대폰 또는 이메일로 경고가 전송됩니다.

차트에 생성된 모든 개체는 IndicatorName 매개변수에 정의된 고유한 접두사를 사용하여 충돌 없이 깔끔하게 제거될 수 있습니다.
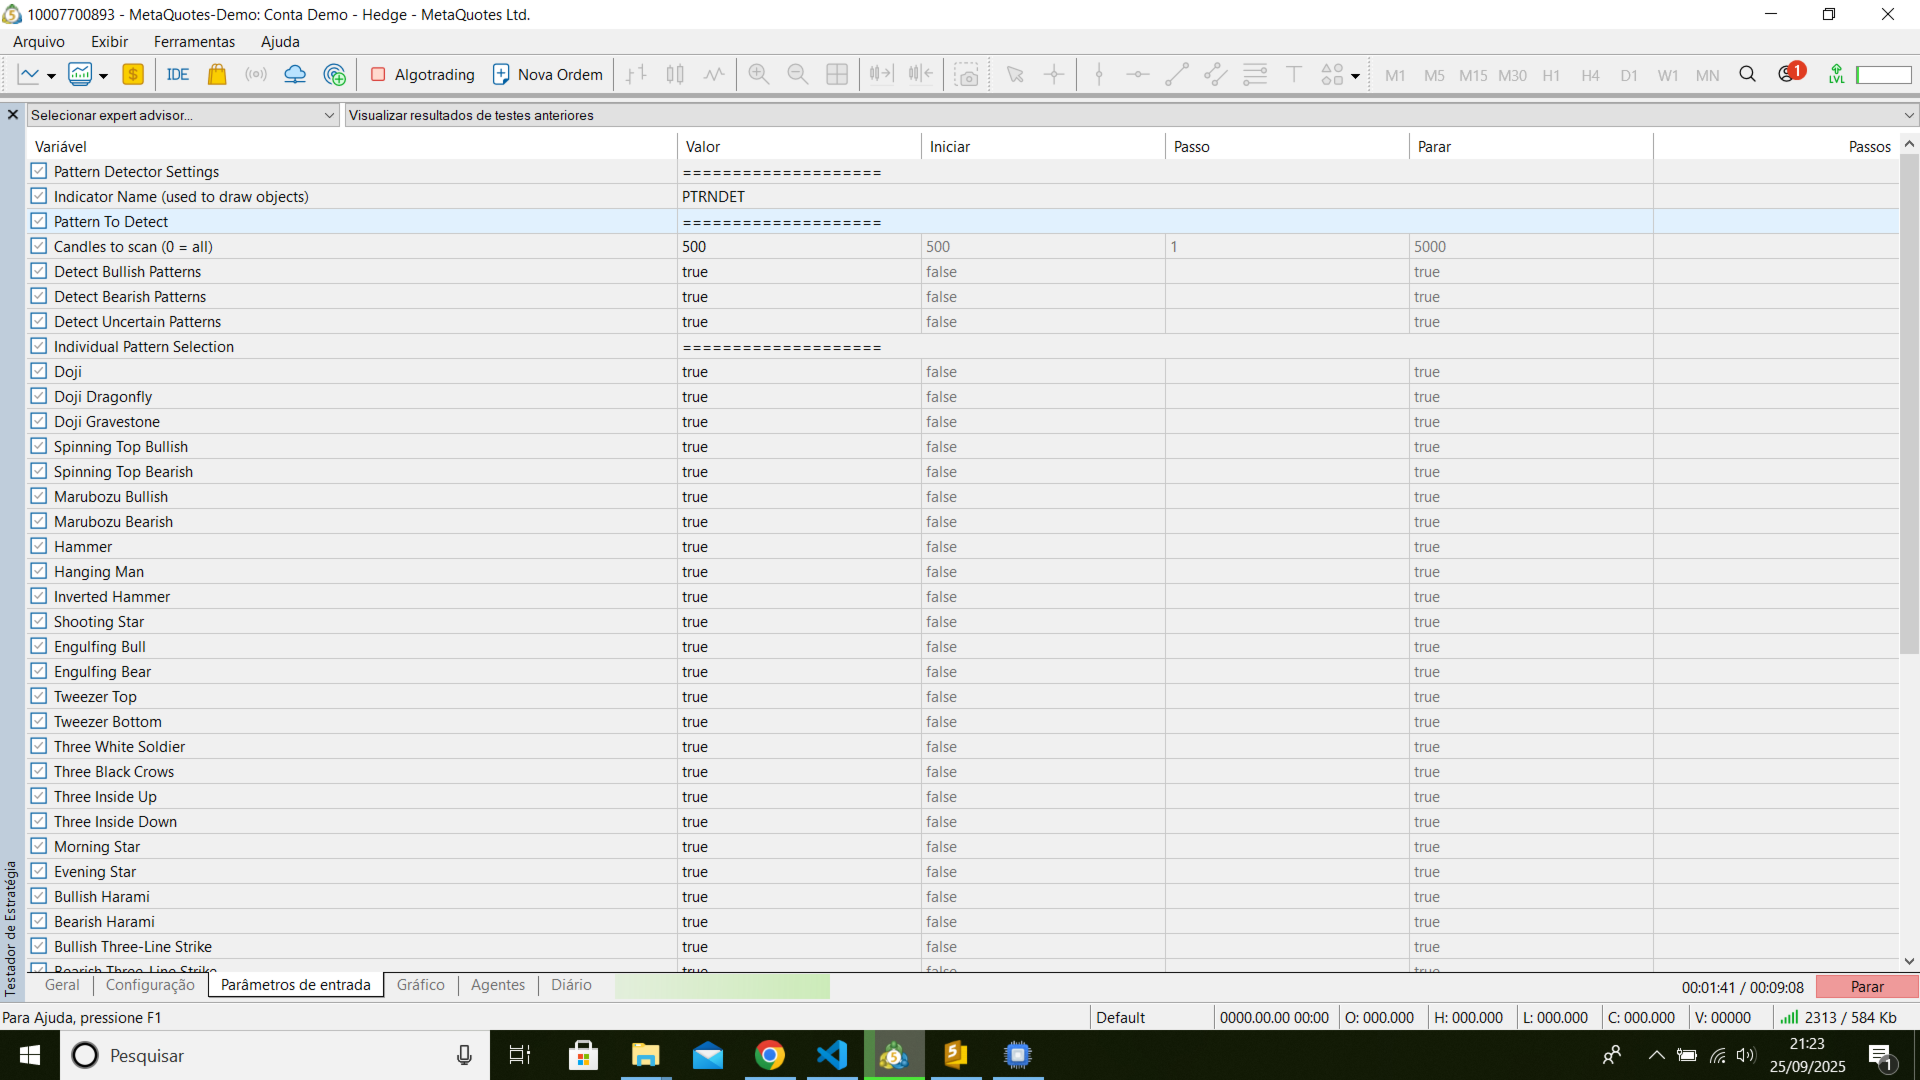
입력 매개변수 (Inputs)

  • IndicatorName: 차트 개체의 접두사. 충돌 방지에 필수적입니다.

  • MaxCandle: 분석할 최대 바 개수(0 = 전체). 이 값을 줄여 여러 차트에서 성능을 개선하세요.

  • PatternsGroup: 패턴 그룹(예: 도지만)별로 분석을 필터링합니다.

  • DetectBullish / DetectBearish / DetectUncertain: 방향별 감지를 활성화/비활성화하는 일반 필터.

  • Detect... (개별 플래그): 20가지 이상의 각 패턴을 활성화 또는 비활성화하는 컨트롤.

  • Font, FontSize, FontColor...: 텍스트 라벨의 모양 설정.

  • EnableNotify, SendAlert, SendApp, SendEmail: 알림 시스템 제어.

  • ChartCorner, Xoff, Yoff: 차트에 제어판을 배치하기 위한 매개변수.

EA 및 스크립트 사용 (버퍼)

스캐너를 로봇과 통합하려면 iCustom() 함수를 사용하고 다음 버퍼를 읽으세요.

  • 버퍼 0 (BufferPatternDirection): 패턴의 방향을 반환합니다.

    • 1 = 강세 패턴(Bullish)

    • -1 = 약세 패턴(Bearish)

    • 0 = 불확실한 패턴

  • 버퍼 1 (BufferPatternDetected): 감지된 패턴의 코드를 반환합니다(.mqh 파일의 열거형에 따름).

의존성

올바른 작동을 위해 /MQL5/Include/ 폴더에 다음 라이브러리 파일이 필요합니다.

  • MQLTA Candlestick Patterns.mqh

  • MQLTA Utils.mqh

제한 사항

  • 감지 정확도는 의존성 파일의 함수 구현에 따라 달라집니다.

  • 이 지표는 고급 필터(예: 거래량, 변동성, 추세)를 적용하지 않습니다. 필요한 경우 사용자가 외부에서 구현해야 합니다.

저자 정보

traderaugustolopes가 개발했습니다. 더 많은 제품 및 정보를 보려면 제 프로필을 방문하세요.

https://www.mql5.com/pt/users/traderaugustolopes/seller


추천 제품
CvdDeltaVolumes
Parasbhai N Patel
Delta + CVD & CVD Candles Order-flow indicator combining Delta (Ask–Bid), Cumulative Volume Delta (CVD), and a unique CVD-based synthetic candle system. Shows buy/sell pressure, volume aggressiveness, and momentum shifts with optional Delta histogram, CVD line, and CVD+Delta combined candles. Useful for scalping, intraday trading, divergence detection, and understanding buyer/seller dominance. Overview The Delta + CVD & CVD Candles Indicator combines multiple order-flow tools into one clean
Time and Sales Tick
Pablo Filipe Soares De Almeida
Time & Sales Tick Indicator 는 MetaTrader 5 차트에서 실시간 거래 틱 정보를 표시하는 지표입니다. 가격, 틱 거래량 및 시간을 시각적으로 보여주며, 사용자가 시장 미세 구조를 분석할 수 있도록 도와줍니다. 기능 설명 가격, 거래량 및 시간을 포함한 틱 데이터를 차트 내 패널에 실시간으로 표시합니다. 틱 데이터를 사용자가 지정한 시간 또는 수량 간격으로 그룹화하고, 상승 틱은 녹색, 하락 틱은 빨간색으로 구분하여 표시합니다. 패널은 차트의 네 모서리 중 원하는 위치로 자유롭게 이동할 수 있으며, 표시 크기와 글꼴도 사용자 설정이 가능합니다. 모든 통화쌍 및 상품에 대응하며 MetaTrader 5 플랫폼 내에서 안정적으로 작동합니다. 이 인디케이터는 스캘핑 및 틱 기반 전략을 사용하는 트레이더에게 유용합니다.
ALIEN Dashboard
Youssef Esseghaiar
ALIEN DASHBOARD FULL EDITION – Professional ICT & Precision Trading Dashboard for MT5 ( HYBRID ENGINE ) Overview The   Alien Dashboard Full Edition   is a comprehensive, all‑in‑one technical indicator for MetaTrader 5 that merges the most powerful concepts from Inner Circle Trader (ICT) methodology with advanced precision‑entry logic, multi‑timeframe analysis, and an intuitive on‑chart dashboard. Designed for serious traders who want to visualise institutional order flow, identify high‑probabili
This indicator allows you to enjoy the two most popular products for analyzing request volumes and market deals at a favorable price: Actual Depth of Market Chart Actual Tick Footprint Volume Chart This product combines the power of both indicators and is provided as a single file. The functionality of Actual COMBO Depth of Market AND Tick Volume Chart is fully identical to the original indicators. You will enjoy the power of these two products combined into the single super-indicator! Below is
Overview Heiken Ashi CE Filtered MT5 is a technical indicator for the MetaTrader 5 platform. It integrates smoothed candlestick charting with a dynamic exit strategy and a customizable trend filter to deliver clear buy and sell signals. The indicator is designed to improve trend detection and signal reliability by reducing market noise. If you want to see more high-quality products or order the development/conversion of your own products, visit my partners' website: 4xDev Get 10% OFF on manual
Mini Chart Indicators
Flavio Javier Jarabeck
The Metatrader 5 has a hidden jewel called Chart Object, mostly unknown to the common users and hidden in a sub-menu within the platform. Called Mini Chart, this object is a miniature instance of a big/normal chart that could be added/attached to any normal chart, this way the Mini Chart will be bound to the main Chart in a very minimalist way saving a precious amount of real state on your screen. If you don't know the Mini Chart, give it a try - see the video and screenshots below. This is a gr
Hull Heikin Ashi Smoothed
Flavio Javier Jarabeck
Heikin Ashi candlesticks are a powerful tool for traders, offering a clear and smooth visualization of market trends. Unlike traditional candlesticks, they filter out market noise, providing a cleaner view of the market's direction and strength, which helps traders make more informed decisions. The Hull Heikin Ashi Smoothed indicator from Minions Labs takes this a step further by integrating the Hull Moving Average for enhanced smoothing and precision. This indicator not only simplifies trend id
Fibaction
Abdelkhalek Orabi
Indicator Name: Fibaction – price action candle Detector Description: Fibo Signal Boxes is a powerful Smart Money Concept (SMC)-inspired indicator that auto-detects price action candles. bullish hammers and shooting stars, then draws precise Fibonacci entry zones and multiple take-profit levels directly on the chart. as for the SL personally i use 40 pips rules  Key Features: Detects bullish hammer and shooting star reversal candles. Automatically draws Fibonacci entry and TP boxes. as
Candlestick Pattern Teller
Flavio Javier Jarabeck
5 (1)
Minions Labs' Candlestick Pattern Teller It shows on your chart the names of the famous Candlesticks Patterns formations as soon as they are created and confirmed. No repainting. That way beginners and also professional traders who have difficulties in visually identifying candlestick patterns will have their analysis in a much easier format. Did you know that in general there are 3 types of individuals: Visual, Auditory, and Kinesthetic? Don't be ashamed if you cannot easily recognize Candlesti
CosmiCLab FIBO
Kirils Subins
CosmiCLab SMC FIBO CosmiCLab SMC FIBO is a professional trading indicator designed for traders who use Smart Money Concepts (SMC), market structure analysis and Fibonacci retracement levels. The indicator automatically detects market swings and builds Fibonacci levels based on the latest impulse movement. It also identifies market structure changes such as BOS (Break of Structure) and CHOCH (Change of Character), helping traders understand the current market direction. CosmiCLab SMC FIBO also pr
Wapv Price and volume
Eduardo Da Costa Custodio Santos
MT5용 WAPV 가격 및 거래량 표시기는 (Wyckoff Academy Wave Market) 및 (Wyckoff Academy Price and Volume) 도구 세트의 일부입니다. MT5용 WAPV 가격 및 거래량 표시기는 차트에서 거래량 움직임을 직관적인 방식으로 쉽게 시각화할 수 있도록 만들어졌습니다. 그것으로 당신은 최대 거래량의 순간과 시장이 전문적인 관심을 갖지 않는 순간을 관찰할 수 있습니다 시장이 "스마트 머니"의 움직임이 아니라 관성에 의해 움직이는 순간을 식별합니다. 사용자가 수정할 수 있는 4가지 색상으로 구성되어 있습니다. 빨간색 = 제안 증가 녹색 = 수요 증가 회색 양초 = 수요와 공급의 감소 파란색 = 스마트머니 연기 위쪽 방향으로의 움직임은 강도를 나타냅니다. 하향 움직임 약점을 나타냅니다. Price의 방향에 상관없이 가장 강한 Volume이 올라가야 합니다. R. Wyckoff의 이론에 따라 생성된 지표
GDS Renko Entry Helper Pro GDS Renko Entry Helper Pro HOW THE SYSTEM WORKS This tool is part of the Golden Delta Renko trading system. The system is designed to guide you step by step: 1.   Renko Zones       → shows where key levels are   2.   Entry Helper      → highlights where to focus   3.   Entry Helper PRO      → shows setup quality and context   4.   Trade Desk Panel      → executes trades with full control  
SMC Buy Sell Indicator SMC Buy Sell Indicator is a price action-based trading tool designed to identify market structure using Smart Money Concepts. It focuses on detecting meaningful swing points, structural breaks, and confirmation signals directly from chart data. The indicator operates using closed candle data and does not rely on future bars. All calculations are performed on confirmed price action, which helps maintain consistent and stable signals. Key Features Market Structure Detection
Welcome to the Ultimate Harmonic Patterns recognition indicator that is focused to detect advanced patterns. The Gartley pattern, Bat pattern, and Cypher pattern  are popular technical analysis tools used by traders to identify potential reversal points in the market. Our Ultimate Harmonic Patterns recognition Indicator is a powerful tool that uses advanced algorithms to scan the markets and identify these patterns in real-time. With our Ultimate Harmonic Patterns recognition Indicator, you ca
Weis Wave Result MT5
Sant Clear Ali Costa
Features 3 types of waves: bullish, bearish and unknown. The unknown tower comes when prices move in opposite the direction of the current tower. Label that shows the percentage remaining for the next tower. Allows you set the type of volume that will be accumulated in the towers, either real or tick volumes. Thus, the indicator works in any market, for example: stocks, futures, forex, commodities, etc. Allows you to set the required score for the tower exchange. Allows you to set the font size
표시기는 현재 시세를 작성하여 과거 시세와 비교할 수 있으며 이를 바탕으로 가격 변동을 예측합니다. 표시기에는 원하는 날짜로 빠르게 이동할 수 있는 텍스트 필드가 있습니다. 옵션: 기호 - 표시기가 표시할 기호 선택. SymbolPeriod - 지표가 데이터를 가져올 기간 선택. IndicatorColor - 표시기 색상. HorisontalShift - 지시자가 그린 따옴표를 지정된 막대 수만큼 이동합니다. Inverse - true는 인용 부호를 반대로, false - 원래 보기를 반전합니다. ChartVerticalShiftStep - 차트를 수직으로 이동합니다(키보드의 위/아래 화살표). 다음은 날짜를 입력할 수 있는 텍스트 필드의 설정으로, '엔터'를 누르면 즉시 이동할 수 있습니다.
Crash 1000 Scalping Indicator for the Crash 1000 Deriv Synthetic Index. Introduction The Crash 1000 Scalping Indicator is a specialized tool designed for the Crash 1000 index on the Deriv Synthetic market. This indicator is particularly useful for scalping on the M1 timeframe, helping traders to identify precise entry and exit points for buy positions. It is designed to be non-repainting, providing clear signals with audible alerts and push notifications, and is compatible with mobile devices th
Your Trend Friend
Luigi Nunes Labigalini
5 (1)
The trend is your friend! Look at the color of the indicator and trade on that direction. It does not  repaint. After each candle is closed, that's the color of the trend. You can focus on shorter faster trends or major trends, just test what's most suitable for the symbol and timeframe you trade. Simply change the "Length" parameter and the indicator will automatically adapt. You can also change the color, thickness and style of the lines. Download and give it a try! There are big movements w
Delta Profile Volume
Teresinha Moraes Correia
기술 설명 – MetaTrader 5용 Delta Profile Delta Profile 은 MetaTrader 5에서 정의된 캔들 범위 내의 거래량 흐름을 세부적으로 분석하기 위해 설계된 지표입니다. 이 도구는 각 가격 수준에서 양의 거래량(상승과 관련) 과 음의 거래량(하락과 관련) 간의 불균형을 구조화하고 시각화합니다. 이를 통해 사용자는 실제로 거래가 집중되는 가격 영역과 시장 불균형이 형성되는 구간을 명확하게 파악할 수 있습니다. 핵심 개념 지표는 가격 레벨 을 인식하고 이를 양의 거래량, 음의 거래량 및 순 델타(양-음 차이)로 분류합니다. 각 가격 레벨은 수평 막대 로 차트에 표시되며, 거래가 집중되는 구간을 직관적으로 보여줍니다. 사용자는 분석할 캔들의 개수 , 가격 반올림 정밀도 , 최대 표시 레벨 수 , 표시 옵션 등을 직접 설정할 수 있습니다. 주요 기능 가격 레벨 매핑 : 사용자가 지정한 자릿수에 맞게 가격을 반올림하여 거래량을 집계합니다. 순 델타 계산 : 양
Flow Architect
Alex Amuyunzu Raymond
Flow Architect Lite - Professional Market Structure Toolkit Free Version Features: Core Structure Analysis: Daily VWAP Engine   - Volume-weighted average price for institutional level tracking Standard Deviation Bands (SD1)   - Dynamic support and resistance zones Break of Structure Detection   - Visual markers for market structure shifts Fair Value Gap Identification   - Highlighted imbalance zones on your charts ATR Volatility Context   - Real-time Average True Range measurement Clean Informat
ZigZag with Fibonacci
Rafael Caetano Pinto
This indicator uses the metaquotes ZigZag indicator as base to plot fibonacci extension and fibonacci retracement based in the Elliot waves. A fibonacci retracement will be plotted on every wave draw by the ZigZag. A fibonacci extension will be plotted only after the 2nd wave. Both fibonacci will be updated over the same wave tendency. Supporting until 9 consecutive elliot waves. Parameters: Depth: How much the algorithm will iterate to find the lowest and highest candles Deviation: Amount of
SMC Venom Model BPR 지표는 Smart Money(SMC) 개념 내에서 일하는 트레이더를 위한 전문 도구입니다. 가격 차트에서 두 가지 주요 패턴을 자동으로 식별합니다. FVG (공정 가치 갭)는 3개의 캔들의 조합으로, 첫 번째와 세 번째 캔들 사이에 갭이 있습니다. 이는 볼륨 지원이 없는 레벨 사이에 구역을 형성하여 종종 가격 수정으로 이어집니다. BPR (균형 가격 범위)은 두 개의 FVG 패턴의 조합으로, "브리지"를 형성합니다. 이는 가격이 낮은 볼륨 활동으로 움직일 때 브레이크아웃과 레벨로의 복귀 구역으로, 캔들 사이에 갭을 생성합니다. 이러한 패턴은 거래자가 차트에서 거래량과 가격 역학을 분석하여 주요 지지/저항 수준, 돌파 구역 및 진입 지점을 식별하는 데 도움이 되며, 여기서 대형 시장 참여자와 일반 참여자 간의 상호 작용이 발생합니다. 이 지표는 사각형과 화살표 형태로 패턴을 시각화하며 유연한 경고 설정도 지원합니다. 주요 특징: 패턴 표시 모드
Volume Delta Candle
Muhammad Muzaffar Hussan
Volume Delta Candles: A Comprehensive Tool for In-Depth Trading Analysis Unlock a seamless way to interpret trading experience within each candle. With Volume Delta Candles, there's no need for additional volume indicators—everything you need is built in. This advanced tool utilizes lower timeframes or live market data to present the percentage of buying versus selling volume within each candle as an intuitive color-coded bar. Before diving in, ensure you’re familiar with Volume and Volume Delta
Description The indicator uses market profile theory to show the most relevant trading zones, on a daily basis. The zones to be shown are LVN (low volume nodes) and POC (point of control). An LVN zone is one which represents price areas with the least time or volume throughout the day. Typically, these areas indicate a supply or demand initiative, and in the future, they can turn into important breakout or retracement zones. A POC zone is one which represents price areas with the most time or vo
WAPV Box Effort x Result
Eduardo Da Costa Custodio Santos
MT5에 대한 WA_PV_BOX_EFFORT X 결과 WAPV 상자 노력 x 결과 표시기는 패키지 표시기 그룹(Wyckoff Academy Wave Market)의 일부입니다. MT5용 WAPV Box Effort x Result Indicator는 가격과 거래량을 읽는 데 도움이 됩니다. 그 판독은 노력 x 결과의 식별을 돕는 것으로 구성됩니다. 그래프에 의해 생성된 파동. 상자가 녹색일 때 MT5에 대한 WAPV 상자 노력 x 결과 표시기는 거래량이 수요에 유리하고 상자가 빨간색일 때를 의미합니다. 물량은 공급에 유리하다. 상자가 클수록 가격에 대한 부피의 변위가 커집니다. 가격의 상승파동이 Box의 크기에 비례하지 않는다면, 노력 x 결과. 매우 시각적인 방법으로 우리는 볼륨과 가격 사이의 이러한 차이를 식별할 수 있습니다. MT5용 WAPV Box 노력 x 결과 표시기를 사용하면 표시기를 0축 아래에 배치하여 시각화를 개선할 수도 있습니다. 틱 볼륨 및 실제 볼륨으로 시장에서
Segmented Volume MT5
Eduardo Da Costa Custodio Santos
MT5 세그먼트 거래량 표시기는 가격 및 거래량 분석, VSA, VPA, Wyckoff Method 및 Smart Money System을 사용하여 거래하는 사람들을 용이하게 하기 위해 만들어졌습니다. 분할된 거래량은 모든 시장(Crypto, CFD, Forex, Futures, Stock...)에서 작동하며 모든 차트 시간에서 작동합니다. 당신의 해석이 얼마나 쉬운지 보십시오: #녹색: 시장 평균보다 훨씬 높은 거래량 #다크핑크 : 평균보다 큰 볼륨 #파란색: 양의 정상 볼륨 #빨간색: 음의 정상 볼륨 #핑크: 낮은 볼륨 #노란색: 초저용량 MT5 분할 볼륨 표시기는 틱 볼륨 또는 실제 볼륨에서 사용할 수 있습니다. 스마트 머니의 움직임을 읽는 데 도움이 되어 의사 결정을 용이하게 합니다.
Noize Absorption Index
Ekaterina Saltykova
Noize Absorption Index - is the manual trading system that measures the difference of pressure between bears forces and bulls forces. Green line - is a noize free index that showing curent situation. Zero value of index shows totally choppy/flat market.Values above zero level shows how powerfull bullish wave is and values below zero measures bearish forces.Up arrow appears on bearish market when it's ready to reverse, dn arrow appears on weak bullish market, as a result of reverse expectation.
Blahtech Market Profile MT5
Blahtech Limited
5 (10)
Was: $249  Now: $99   Market Profile defines a number of day types that can help the trader to determine market behaviour. A key feature is the Value Area, representing the range of price action where 70% of trading took place. Understanding the Value Area can give traders valuable insight into market direction and establish the higher odds trade. It is an excellent addition to any system you may be using. Inspired by Jim Dalton’s book “Mind Over Markets”, this indicator is designed to suit the
Price Magnet — Price Density and Attraction Levels Indicator Price Magnet is a professional analytical tool designed to identify key support and resistance levels based on statistical Price Density. The indicator analyzes a specified historical period and detects price levels where the market spent the most time. These zones act as “magnets,” attracting price action or forming a structural base for potential reversals. Unlike traditional Volume Profile tools, Price Magnet focuses on price-time d
Harmonic Pattern Structure Harmonic Pattern Structure is a professional MetaTrader 5 indicator that automatically detects classic harmonic patterns using strict Fibonacci ratio validation and XABCD price structure. Designed for traders who value precision, clean visuals, and structured analysis, the indicator highlights potential reversal zones based on price geometry, supporting consistent and objective decision-making. SUPPORTED HARMONIC PATTERNS Gartley (222) Butterfly Bat Crab Shark Cy
이 제품의 구매자들이 또한 구매함
ARIPoint
Temirlan Kdyrkhan
ARIPoint is a powerful trading companion designed to generate high-probability entry signals with dynamic TP/SL/DP levels based on volatility. Built-in performance tracking shows win/loss stats, PP1/PP2 hits, and success rates all updated live. Key Features: Buy/Sell signals with adaptive volatility bands Real-time TP/SL/DP levels based on ATR Built-in MA Filter with optional ATR/StdDev volatility Performance stats panel (Success, Profit/Loss, PP1/PP2) Alerts via popup, sound, push, or email Cu
SuperScalp Pro
Van Minh Nguyen
4.61 (23)
SuperScalp Pro – 고급 멀티 필터 스캘핑 지표 시스템 SuperScalp Pro는 클래식 Supertrend와 여러 지능형 확인 필터를 결합한 고급 스캘핑 지표로, 거래 기회를 식별하는 데 도움을 줍니다. M1부터 H4까지 다양한 시간대에서 효율적으로 작동하며, XAUUSD, BTCUSD 및 주요 Forex 통화쌍에 최적화되어 있습니다. 이 지표는 명확한 매수 및 매도 신호를 제공하며, ATR 기반으로 진입가, 손절가, 익절가를 자동 계산하여 보다 효과적인 리스크 관리를 지원합니다. Fibonacci Take Profit 기능은 중요한 가격 구간에서 더 빠르게 포지션을 청산할 수 있도록 하며, 해당 수준 도달 시 알림을 전송합니다. 기본 설정은 Fibonacci Take Profit이 활성화된 상태로 최적화되어 있으며, 보다 안정적이고 일관된 거래 경험에 중점을 둡니다. 차트에 적용하는 것만으로 즉시 사용할 수 있습니다. 고급 사용자를 위해 모든 파라미터는 자유롭게 사용
Entry In The Zone and SMC Multi Timeframe is a real-time 2-in-1 market analysis tool that combines market structure analysis and a No Repaint BUY / SELL signal system into a single indicator, built on Smart Money Concepts (SMC) — a widely adopted framework used by professional traders to understand market structure. This indicator helps you see the market more clearly, make decisions based on structure rather than guesswork, and focus on high-probability zones where price is more likely to react
Divergence Bomber
Ihor Otkydach
4.9 (88)
이 지표를 구매하신 분께는 다음과 같은 혜택이 무료로 제공됩니다: 각 거래를 자동으로 관리하고, 손절/익절 수준을 설정하며, 전략 규칙에 따라 거래를 종료하는 전용 도우미 툴 "Bomber Utility" 다양한 자산에 맞게 지표를 설정할 수 있는 셋업 파일(Set Files) "최소 위험", "균형 잡힌 위험", "관망 전략" 모드로 설정 가능한 Bomber Utility의 셋업 파일 이 전략을 빠르게 설치, 설정, 시작할 수 있도록 돕는 단계별 영상 매뉴얼 주의: 위의 모든 보너스를 받기 위해서는 MQL5 개인 메시지 시스템을 통해 판매자에게 연락해 주세요. 독창적인 커스텀 지표인 “Divergence Bomber(다이버전스 봄버)”를 소개합니다. 이 지표는 MACD 다이버전스(괴리) 전략을 기반으로 한 올인원(All-in-One) 거래 시스템입니다. 이 기술 지표의 주요 목적은 가격과 MACD 지표 간의 다이버전스를 감지하고, **향후 가격이 어느 방향으로 움직일지를 알려주는
SignalTech MT5
Yue Wang
5 (20)
SignalTech MT5 is a fully rule based trading system for EURUSD, USDCHF, USDJPY, AUDUSD, NZDUSD, EURJPY, AUDJPY, NZDJPY, CADJPY.  All the winning trades with chart setups are published on the comments page. 2025-12 1174 Pips 2026-01 2624 Pips 2026-02 2937 Pips 2026-03 2165 Pips 2026-04 2243 Pips It can generate signals with Buy/Sell Arrows and Pop-Up/Sound Alerts. Each signal has clear Entry and Stop Loss levels, which should be automatically flagged on the chart, as well as potential Targets 1,
Power Candles MT5
Daniel Stein
5 (8)
Power Candles V3 - 자체 최적화 강도 지표 파워 캔들 V3는 적용된 모든 차트에서 통화 및 상품의 강세를 실행 가능한 거래 계획으로 전환합니다. 단순히 캔들에 색상을 입히는 대신, 백그라운드에서 실시간 자동 최적화를 수행하여 현재 보고 있는 종목에 대한 최적의 손절매, 익절 및 신호 임계값을 제공합니다. 한 번의 클릭으로 실시간 거래에 적용할 수 있으며, 진입점, 손절매 및 익절 선이 정확한 가격에 맞춰 차트에 표시되고, 방향과 함께 알림이 발령됩니다. 이 도구는 Stein Investments 에코시스템의 일부입니다. 18개 이상의 도구와 함께 당신의 1대1 AI 트레이딩 멘토 Max.  항상 대기 중, 모든 인디케이터를 깊이 있게 이해, 무언가를 차근차근 생각해보고 싶은 순간에 도움을 줍니다.  https://stein.investments 에서 만나보세요 매 종가 바마다 3,000회 이상의 트레이딩 시뮬레이션. 9가지 강도 상태. 2가지 전략을 병렬로 테스트.
Azimuth Pro
Ottaviano De Cicco
5 (7)
Azimuth Pro V2: Synthetic Fractal Structure and Confirmed Entries for MT5 Overview Azimuth Pro is a multi-level swing structure indicator by Merkava Labs . Four nested swing layers, swing-anchored VWAP, ABC pattern detection, three-timeframe structural filtering, and closed-bar confirmed entries — one chart, one workflow from micro-swings to macro-cycles. This is not a blind signal product. It is a structure-first workflow for traders who care about location, context, and timing. V2 Launch Offe
소개       Quantum Breakout PRO   , 브레이크아웃 존 거래 방식을 변화시키는 획기적인 MQL5 지표! 13년 이상의 거래 경험을 가진 숙련된 트레이더 팀이 개발한       퀀텀 브레이크아웃 PRO       혁신적이고 역동적인 브레이크아웃 존 전략으로 거래 여정을 새로운 차원으로 끌어올리도록 설계되었습니다. Quantum Breakout Indicator는 5개의 이익 목표 영역이 있는 브레이크아웃 영역의 신호 화살표와 브레이크아웃 상자를 기반으로 한 손절 제안을 제공합니다. 초보자 거래자와 전문 거래자 모두에게 적합합니다. Quantum EA 채널:       여기를 클릭하세요 중요한! 구매 후 설치 매뉴얼을 받으려면 개인 메시지를 보내주십시오. 추천: 기간: M15 통화쌍: GBPJPY, EURJPY, USDJPY,NZDUSD, XAUUSD 계정 유형: 스프레드가 매우 낮은 ECN, Raw 또는 Razor 브로커 시간: GMT +3 중개인 :
MetaTrader 5용 스마트 다층 브레이크아웃 및 풀백 탐지기 "스마트하고, 간단하고, 빠르게!" 고확률 브레이크아웃 진입을 놓치는 것에 지치셨나요? 여러 차트를 몇 시간씩 스캔하면서 브레이크아웃을 추세 방향과 통화 모멘텀에 맞추려고 하지만 — 결국 움직임을 놓치고 마나요? Break Pullback은 하나의 지표로 이 모든 문제를 해결합니다. Break Pullback이란 무엇인가요? Break Pullback은 시장 구조, 브레이크아웃, 추세 지속 설정을 거래하는 트레이더를 위해 특별히 설계된 전문가급 MetaTrader 5 지표입니다. 실시간으로 여러 통화 쌍에 걸쳐 Break와 Pullback 형성을 자동으로 감지하고 — 세 가지 확인 레이어를 통해 모든 신호를 필터링합니다: 구조적 브레이크아웃 탐지 — 차트의 주요 브레이크 레벨 식별 HTF 일봉 바이어스 — 진입을 지배적인 일봉 추세 방향에 맞춤 통화 강도 지수 — 쌍을 이룬 통화 간의 모멘텀 불균형 확인 결과: 오
RelicusRoad Pro MT5
Relicus LLC
5 (24)
RelicusRoad Pro: 퀀트 시장 운영 체제 70% 할인 평생 이용권 (한정 시간) - 2,000명 이상의 트레이더와 함께하세요 왜 대부분의 트레이더는 "완벽한" 지표를 가지고도 실패할까요? 진공 상태에서 단일 개념 만으로 거래하기 때문입니다. 문맥 없는 신호는 도박입니다. 지속적인 승리를 위해서는 컨플루언스(중첩) 가 필요합니다. RelicusRoad Pro는 단순한 화살표 지표가 아닙니다. 완전한 퀀트 시장 생태계 입니다. 독점적인 변동성 모델링을 사용하여 가격이 이동하는 "공정 가치 로드"를 매핑하고, 단순 노이즈와 실제 구조적 돌파를 구분합니다. 추측은 그만두세요. 기관급 로드 로직으로 거래를 시작하세요. 핵심 엔진: "Road" 알고리즘 시스템의 중심에는 시장 상황에 실시간으로 적응하는 동적 변동성 채널인 Road Algo 가 있습니다. 세이프 라인(평형) 과 가격이 수학적으로 반전될 가능성이 높은 확장 레벨 을 투영합니다. Simple Road: 일반적인 시장을 위
Atomic Analyst MT5
Issam Kassas
3.94 (31)
우선적으로 언급할 점은이 거래 지표가 다시 그리지 않고 지연되지 않으며 이를 통해 수동 및 로봇 거래 모두에 이상적이라는 점입니다. 사용자 매뉴얼: 설정, 입력 및 전략. Atomic Analyst는 가격의 강도와 모멘텀을 활용하여 시장에서 더 나은 이점을 찾는 PA Price Action Indicator입니다. 고급 필터를 장착하여 잡음과 거짓 신호를 제거하고 거래 잠재력을 높이는 데 도움이 됩니다. 복잡한 지표의 다중 레이어를 사용하여 Atomic Analyst는 차트를 스캔하고 복잡한 수학적 계산을 간단한 신호와 색상으로 변환하여 초보 트레이더가 이해하고 일관된 거래 결정을 내릴 수 있도록합니다. "Atomic Analyst"는 새로운 및 경험이 풍부한 트레이더를위한 종합적인 거래 솔루션입니다. 프리미엄 지표와 최고 수준의 기능을 하나의 거래 전략에 결합하여 모든 종류의 트레이더에 대한 다재다능한 선택지가되었습니다. 인트라데이 거래 및 스캘핑 전략 : 빠르고 정확한 일일
이 지표를 구매하면 제 프로페셔널 트레이드 매니저를 무료로 드립니다. 우선 이 거래 시스템이 리페인팅, 리드로잉 및 레이그 인디케이터가 아니라는 점을 강조하는 것이 중요합니다. 이는 수동 및 로봇 거래 모두에 이상적인 것으로 만듭니다. 온라인 강좌, 설명서 및 프리셋 다운로드. "스마트 트렌드 트레이딩 시스템 MT5"은 새로운 및 경험이 풍부한 트레이더를 위해 맞춤형으로 제작된 종합적인 거래 솔루션입니다. 10개 이상의 프리미엄 인디케이터를 결합하고 7개 이상의 견고한 거래 전략을 특징으로 하여 다양한 시장 조건에 대한 다목적 선택이 가능합니다. 트렌드 추종 전략: 효과적인 트렌드 추이를 타기 위한 정확한 진입 및 손절 관리를 제공합니다. 반전 전략: 잠재적인 트렌드 반전을 식별하여 트레이더가 범위 시장을 활용할 수 있게 합니다. 스캘핑 전략: 빠르고 정확한 데이 트레이딩 및 단기 거래를 위해 설계되었습니다. 안정성: 모든 인디케이터가 리페인팅, 리드로잉 및 레이그가 아니므로 신뢰
Gann Made Easy MT5
Oleg Rodin
5 (4)
Gann Made Easy 는 mr.의 이론을 사용하여 최고의 거래 원칙을 기반으로 하는 전문적이고 사용하기 쉬운 Forex 거래 시스템입니다. W.D. 간. 이 표시기는 Stop Loss 및 Take Profit Levels를 포함하여 정확한 BUY 및 SELL 신호를 제공합니다. PUSH 알림을 사용하여 이동 중에도 거래할 수 있습니다. 구매 후 거래 방법 안내 및 유용한 추가 지표를 무료로 받으시려면 저에게 연락주세요! 아마도 Gann 거래 방법에 대해 이미 여러 번 들었을 것입니다. 일반적으로 Gann의 이론은 초보자 거래자뿐만 아니라 이미 거래 경험이 있는 사람들에게도 매우 복잡한 것입니다. Gann의 거래 방식은 이론적으로 적용하기 쉽지 않기 때문입니다. 나는 그 지식을 연마하고 Forex 지표에 최고의 원칙을 적용하기 위해 몇 년을 보냈습니다. 표시기는 적용하기가 매우 쉽습니다. 차트에 첨부하고 간단한 거래 권장 사항을 따르기만 하면 됩니다. 지표는 지속적으로 시장 분석
FX Trend MT5 NG
Daniel Stein
5 (4)
FX Trend NG: 차세대 멀티 마켓 트렌드 인텔리전스 개요 FX Trend NG 는 다중 시간 프레임 기반의 전문 트렌드 분석 및 시장 모니터링 도구입니다. 몇 초 만에 전체 시장 구조를 파악할 수 있도록 설계되었습니다. 여러 차트를 일일이 전환할 필요 없이, 어떤 종목이 추세에 있는지, 어디에서 모멘텀이 약화되고 있는지, 그리고 어떤 시간 프레임이 서로 정렬되어 있는지 즉시 확인할 수 있습니다. 출시 기념 특별 혜택 – FX Trend NG 를 $30 (6개월) 또는 $80 평생 라이선스 로 이용할 수 있습니다. 이미 Stein Investments 고객이신가요? -> 메시지를 보내 전용 고객 그룹에 참여하세요. 설정이나 사용 방법이 필요하신가요? -> Stein Investments 공식 페이지 를 방문하세요. 1. FX Trend NG가 특별한 이유 3단계 추세 로직 – 단순한 Buy / Sell이 아닙니다 • 대부분의 지표는 Buy 또는 Sell 두 가지 상태만 제
Quantum TrendPulse
Bogdan Ion Puscasu
5 (23)
SuperTrend   ,   RSI   ,   Stochastic   의 힘을 하나의 포괄적인 지표로 결합하여 트레이딩 잠재력을 극대화하는 궁극의 트레이딩 도구   인 Quantum TrendPulse를   소개합니다. 정밀성과 효율성을 추구하는 트레이더를 위해 설계된 이 지표는 시장 추세, 모멘텀 변화, 최적의 진입 및 종료 지점을 자신 있게 식별하는 데 도움이 됩니다. 주요 특징: SuperTrend 통합:   주요 시장 추세를 쉽게 따라가고 수익성의 물결을 타세요. RSI 정밀도:   매수 과다 및 매도 과다 수준을 감지하여 시장 반전 시점을 파악하는 데 적합하며 SuperTrend 필터로 사용 가능 확률적 정확도:   변동성이 큰 시장에서 숨겨진 기회를 찾기 위해 확률적 진동   을 활용하고 SuperTrend의 필터로 사용 다중 시간대 분석:   M5부터 H1 또는 H4까지 다양한 시간대에 걸쳐 시장을 최신 상태로 유지하세요. 맞춤형 알림:   맞춤형 거래 조건이 충족되면
Market Structure Order Block Dashboard MT5는 시장 구조와 주요 가격 반응 구역을 차트에서 직접 읽고자 하는 트레이더를 위해 설계된 MT5 지표입니다. BOS, ChoCH, 오더 블록, Fair Value Gap (FVG), 유동성, Kill Zones, Volume Profile 그리고 빠른 분석을 위한 콤팩트한 대시보드를 결합합니다. 이 지표는 시장 구조, ICT 및 Smart Money 개념을 의사결정 프레임워크로 사용하는 트레이더를 대상으로 합니다. 추세 지속, 가능한 반전, 가격 불균형, 유동성 타겟 및 관심 구역을 보다 체계적으로 식별하는 데 도움을 줄 수 있습니다. 구매자를 위한 포함 리소스 구매 후 MQL5 개인 메시지로 요청하시면 완전한 PDF 사용 설명서와 파라미터 설정 팁을 제공해 드립니다. MQL5 개인 메시지를 통한 직접 기술 지원. 1.20 버전은 두 가지 주요 추가 기능을 제공합니다: Pending BOS / Pending
Btmm state engine pro
Garry James Goodchild
5 (4)
BTMM State Engine Pro is a MetaTrader 5 indicator for traders who use the Beat The Market Maker approach: Asian session context, kill zone timing, level progression, peak formation detection, and a multi-pair scanner from a single chart. It combines cycle state logic with a built-in scanner dashboard so you do not need the same tool on many charts at once. What it does Draws the Asian session range; session times can follow broker server offset or be set in inputs. Tracks level progression (L
SMC Intraday Formula
Kareem Abbas
5 (8)
먼저 솔직하게 말하겠습니다. 어떤 인디케이터도 단독으로 당신을 수익성 있게 만들어주지 않습니다. 누군가 그렇게 말한다면, 그는 당신에게 꿈을 파는 것입니다. 완벽한 매수/매도 화살표를 보여주는 모든 인디케이터는 완벽하게 보이도록 만들 수 있습니다 — 단지 올바른 과거 구간을 확대하고 승리한 거래만 캡처하면 됩니다. 우리는 그렇게 하지 않습니다.  SMC Intraday Formula는 도구입니다. 시장 구조를 읽고, 가장 높은 확률의 가격 구간을 표시하며, 현재 스마트 머니의 흐름이 어떻게 보이는지 아주 단순한 언어로 보여줍니다. 최종 결정은 여전히 당신이 합니다. 실행도 당신이 합니다. 하지만 이제는 희망이 아니라 정확성으로 거래하게 됩니다. 우리는 이 인디케이터를 지난 약 3년 동안 골드(XAUUSD) 및 주요 외환 통화쌍의 데이 트레이딩 스캘핑에 사용해 왔습니다. M1, M5, M15, M30에서 우리의 핵심 도구입니다. 이 도구는 미래를 예측하려 하지 않습니다 — 지금 형성
Grabber System MT5
Ihor Otkydach
4.83 (23)
탁월한 기술적 지표인 Grabber를 소개합니다. 이 도구는 즉시 사용 가능한 “올인원(All-Inclusive)” 트레이딩 전략으로 작동합니다. 하나의 코드 안에 강력한 시장 기술 분석 도구, 매매 신호(화살표), 알림 기능, 푸시 알림이 통합되어 있습니다. 이 인디케이터를 구매하신 모든 분들께는 다음의 항목이 무료로 제공됩니다: Grabber 유틸리티: 오픈 포지션을 자동으로 관리하는 도구 단계별 영상 매뉴얼: 설치, 설정, 그리고 실제 거래 방법을 안내 맞춤형 세트 파일: 인디케이터를 빠르게 자동 설정하여 최고의 성과를 낼 수 있도록 도와줍니다 다른 전략은 이제 잊어버리세요! Grabber만이 여러분을 새로운 트레이딩의 정점으로 이끌어 줄 수 있습니다. Grabber 전략의 주요 특징: 거래 시간 프레임: M5부터 H4까지 거래 가능한 자산: 어떤 자산이든 사용 가능하지만, 제가 직접 테스트한 종목들을 추천드립니다 (GBPUSD, GBPCAD, GBPCHF, AUDCAD, AU
OrderFlux | MetaTrader 5용 풋프린트 오더플로우 버전 2.0 – 액티브 트레이더를 위한 실시간 Bid/Ask 시각화 OrderFlux는 MT5를 위한 풋프린트 및 오더플로우 지표입니다. 가격이 어디로 이동했는지뿐만 아니라, 그 움직임 내부에서 어떤 일이 발생하고 있는지(가격 수준별 Bid/Ask 거래량, 델타, 임밸런스, 거래량 분포)를 보여줍니다. 많은 차트가 캔들의 최종 결과만 보여줍니다. OrderFlux는 그곳에 도달하기까지의 과정을 보여줍니다. 이것이 바로 캔들 모양뿐만 아니라 시장 참여자들의 동향을 읽고자 할 때 정확히 도움이 되는 부분입니다. 라이브 차트에서 OrderFlux는 주로 다음 세 가지 질문에 답합니다: 현재 어디에서 공격적인 매수 또는 매도 압력이 시장에 진입하고 있는가? 어떤 가격 수준에서 거래량이 흡수되거나 거부되고 있는가? 현재의 움직임이 세션 컨텍스트(배경)에 어떻게 부합하는가? 인터페이스에서 제공되는 기능 메인 차트는 Canvas
Basic Harmonic Patterns Dashboard MT5
Mehran Sepah Mansoor
4.36 (11)
이 대시보드는 선택한 심볼에 대해 사용 가능한 최신 고조파 패턴을 표시하므로 시간을 절약하고 더 효율적으로 사용할 수 있습니다 /   MT4 버전 . 무료 인디케이터:   Basic Harmonic Pattern 인디케이터 열 Symbol :   선택한 심볼이 나타납니다 Trend :   강세 또는 약세 Pattern :   패턴 유형(가틀리, 나비, 박쥐, 게, 상어, 사이퍼 또는 ABCD) Entry :   진입 가격 SL:   스톱로스 가격 TP1:   1차 테이크프로핏 가격 TP2:   2차 테이크프로핏 가격 TP3:   3차 테이크프로핏 가격 Current price:   현재 가격 Age (in bars):   마지막으로 그려진 패턴의 나이 주요 입력 Symbols :   "28개 주요 통화쌍" 또는 "선택한 심볼" 중에서 선택합니다. Selected Symbols :   쉼표로 구분하여 모니터링하려는 원하는 심볼("EURUSD,GBPUSD,XAUUSD")을 선택
우선적으로, 이 거래 도구는 전문적인 거래에 이상적인 비-다시 그리기 및 지연되지 않는 지표입니다.  온라인 강좌, 사용자 매뉴얼 및 데모. 스마트 가격 액션 컨셉트 인디케이터는 신규 및 경험 많은 트레이더 모두에게 매우 강력한 도구입니다. Inner Circle Trader Analysis 및 Smart Money Concepts Trading Strategies와 같은 고급 거래 아이디어를 결합하여 20가지 이상의 유용한 지표를 하나로 결합합니다. 이 인디케이터는 스마트 머니 컨셉트에 중점을 두어 대형 기관의 거래 방식을 제공하고 이동을 예측하는 데 도움을 줍니다.  특히 유동성 분석에 뛰어나 기관이 어떻게 거래하는지 이해하는 데 도움을 줍니다. 시장 트렌드를 예측하고 가격 변동을 신중하게 분석하는 데 탁월합니다. 귀하의 거래를 기관 전략에 맞추어 시장의 동향에 대해 더 정확한 예측을 할 수 있습니다. 이 인디케이터는 시장 구조를 분석하고 중요한 주문 블록을 식별하고 다양
Crystal Heikin Ashi Signals
Muhammad Jawad Shabir
5 (2)
Crystal Heikin Ashi Signals - Professional Trend & Signal Detection Indicator Advanced Heikin Ashi Visualization with Intelligent Signal System for Manual & Automated Trading Final Price: $149 ---------> Price goes up $10 after every 10 sales . Limited slots available — act fast . Overview Crystal Heikin Ashi Signals is a professional-grade MetaTrader 5 indicator that combines pure Heikin Ashi candle visualization with an advanced momentum-shift detection system. Designed for both manual traders
OmniSync Projection
Antonio-alin Teculescu
5 (1)
Chronos Fractal Engine is an innovative price projection indicator for MetaTrader 5, designed to transform your technical analysis by intelligently identifying and projecting historical price patterns. Built upon an advanced correlation algorithm and the fractal principles of the market, this powerful tool visualizes potential future price movements, giving you a unique edge in your trading decisions. What is Chronos Fractal Engine? At its core, the Chronos Fractal Engine employs a sophisticat
" Dynamic Scalper System MT5 " 지표는 추세 파동 내에서 스캘핑 방식으로 거래하도록 설계되었습니다. 주요 통화쌍 및 금에서 테스트되었으며, 다른 거래 상품과의 호환성이 가능합니다. 추가적인 가격 변동 지원을 통해 추세에 따라 단기 포지션 진입 신호를 제공합니다. 지표의 원리 큰 화살표는 추세 방향을 결정합니다. 작은 화살표 형태의 스캘핑 신호를 생성하는 알고리즘은 추세 파동 내에서 작동합니다. 빨간색 화살표는 상승 방향을, 파란색 화살표는 하락 방향을 나타냅니다. 민감한 가격 변동선은 추세 방향으로 그려지며, 작은 화살표의 신호와 함께 작용합니다. 신호는 다음과 같이 작동합니다. 적절한 시점에 선이 나타나면 진입 신호가 형성되고, 선이 있는 동안 미결제 포지션을 유지하며, 완료되면 거래를 종료합니다. 권장되는 작업 시간대는 M1~H4입니다. 화살표는 현재 캔들에 형성되며, 다음 캔들이 이미 시작되었더라도 이전 캔들의 화살표는 다시 그려지지 않습니다. 입
Meridian Pro
Ottaviano De Cicco
5 (2)
Meridian Pro 2.00: Professional Multi-Timeframe Trend Matrix for MT5 Meridian Pro 2.00 is a professional adaptive trend matrix for MetaTrader 5. It combines the original Meridian trend engine, a clean chart ribbon, closed-bar signal arrows, an 8-timeframe dashboard, Fuel momentum, weighted consensus, synthetic HTF processing and chart-native higher-timeframe context lines. The goal is simple: read current trend, multi-timeframe structure, strength, momentum and EA-ready state from one discipline
Super Signal Market Slayer 비재페인트 | 고정확도 | 멀티 마켓 지능형 추세 지표 트레이딩에서 진짜 어려운 것은 주문이 아니라, 시장 변동 속에서 추세가 시작되는 순간을 정확히 파악하는 것입니다. Market Slayer 는 이를 위해 만들어졌습니다. 이 지표는 데이 트레이딩을 위해 설계된 비재페인트 지능형 지표입니다. 다중 확인 및 추세 필터링을 통해 중요한 시점에서만 명확하고 신뢰할 수 있는 Buy / Sell 신호를 제공합니다. 핵심 장점 비재페인트 신호 한 번 생성된 신호는 이동하거나 사라지지 않습니다. 고정확도 추세 판단 다양한 종목에서 테스트되었으며, 특히 골드 M5 / M15에서 안정적인 성과를 보입니다. 멀티 마켓 지원 골드, 외환, 지수, 주요 암호화폐 지원. 데이 트레이딩 최적화 M5, M15에 집중하여 노이즈를 줄이고 실행력을 향상. 직관적 구조 초보자도 쉽게 이해하고 사용할 수 있습니다. 기술 로직 요약 Market Slayer 는 단일
Market Structure Patterns
Samuel Manoel De Souza
4.47 (19)
Market Structure Patterns   is an indicator based on   smart money concepts   that displays   SMC/ICT   elements that can take your trading decisions to the next level. Take advantage of the   alerts ,   push notifications   and   email messages   to keep informed from when an element is formed on the chart, the price crosses a level and/or enters in a box/zone. Developers can access the values of the elements of the indicator using the   global variables  what allows the automation of trading
Trend indicator AI mt5
Ramil Minniakhmetov
5 (17)
트렌드 인공 지능 지표는 실행 가능한 진입 점 및 반전 경고와 추세 식별을 결합하여 상인의 시장 분석을 향상시킬 훌륭한 도구입니다. 이 표시기는 사용자가 자신감과 정밀도로 외환 시장의 복잡성을 탐색 할 수 있도록 지원합니다 기본 신호 외에도 트렌드 인공 지능 지표는 풀백 또는 되돌림 중에 발생하는 2 차 진입 점을 식별하여 거래자가 기존 트렌드 내에서 가격 수정을 활용할 수 있도록합니다. 중요한 장점: ·작동 4 및 5 *명확한 구매 또는 판매 신호 *다시 칠하지 않습니다 *모든 자산에서 작동 나는 전보 사기에 개 또는 세트를 판매하지 않도록주의. 모든 설정은 블로그에 여기에 무료.  중요! 지침 및 보너스를 얻기 위해 구입 후 즉시 저에게 연락! 진짜 가동 감시는 뿐 아니라 나의 다른 제품 여기에서 찾아낼 수 있습니다: https://www.mql5.com/en/users/mechanic/seller&nbsp ; 설정 및 입력: 모든 자산에 대해 기본 설정을 권
Gartley Hunter Multi
Siarhei Vashchylka
5 (11)
Gartley Hunter Multi - An indicator for searching for harmonic patterns simultaneously on dozens of trading instruments and on all possible timeframes. Manual (Be sure to read before purchasing) | Version for MT4 Advantages 1. Patterns: Gartley, Butterfly, Shark, Crab. Bat, Alternate Bat, Deep Crab, Cypher 2. Simultaneous search for patterns on dozens of trading instruments and on all possible timeframes 3. Search for patterns of all possible sizes. From the smallest to the largest 4. All fou
제작자의 제품 더 보기
Bollinger Bands Ultimate
Augusto Martins Lopes
5 (1)
BollingerBandsEA is an Expert Advisor designed to combine technical analysis with automated execution, utilizing the renowned Bollinger Bands strategy. Developed for traders of all experience levels, it offers a practical approach to streamline your trading activities in the financial market. Why Choose BollingerBandsEA? Strategy-Based Approach: Built on Bollinger Bands logic, the EA identifies trading opportunities using solid technical criteria. Smart Automation: Enables automated buy and sel
FREE
Zenith Angel
Augusto Martins Lopes
Zenith Angel EA: 트레이더를 위한 지능형 자동화 설명 Zenith Angel EA 는 금융 거래를 최적화하고 트레이더의 전략적 의사 결정을 지원하는 고급 자동 거래 도구입니다. 최신 기술과 검증된 시장 전략을 결합하여 정밀성, 효율성 및 완전한 거래 제어를 제공합니다. 이 Expert Advisor는 여러 기술 지표를 동시에 처리하며, 시장 상황에 따라 동적으로 조정되어 안정적인 성능을 보장합니다. 주요 기능 자동 기술 분석 : 여러 지표를 동시에 분석하여 최적의 진입 및 종료 지점을 식별합니다. 스마트 리스크 관리 : 시장 상황에 따라 자동으로 설정을 조정하여 손실을 최소화하고 수익을 극대화합니다. 정확한 실행 : 지속적인 시장 모니터링을 통해 전략적인 매매 기회를 포착합니다. 다중 전략 운영 : 마틴게일, 그리드, 차익거래, 헤징, 스캘핑, 뉴스 트레이딩, 트렌드 추종, 레벨 트레이딩, 신경망 및 다중 통화 거래 등 다양한 거래 접근 방식과 호환됩니다. 추천 설정 통
Reset Pro
Augusto Martins Lopes
RESET PRO: The Future of Algorithmic Trading Revolutionary Technology for Consistent and Intelligent Trading RESET PRO is the most advanced automated trading solution, combining cutting-edge market analysis with a dynamic position management system. Our exclusive reset-and-recover methodology ensures consistent performance, even in the most challenging market conditions. Key Technical Features PROPRIETARY RESET MECHANISM Never lose trade direction again! When the market moves against yo
FREE
Matrix Currency
Augusto Martins Lopes
Matrix Currency – Multi-Timeframe Analysis Tool The Matrix Currency is an advanced indicator designed to analyze currency strength in the Forex market. It provides efficient monitoring and strategic support for traders seeking clear and actionable insights. Key Features Multi-Timeframe Analysis : Simultaneously monitors multiple timeframes (from M1 to MN1) with real-time updates, displayed in an intuitive matrix format. Alert System : Customizable notifications via pop-up, email, and mobile devi
FREE
New Support and Resistance Indicator with Probabilities and Alerts Description:  Maximize your profits with the newest Support and Resistance indicator! Our indicator automatically calculates support and resistance levels based on 24-hour analysis periods and provides detailed probabilities for each level. Additionally, you can set up custom alerts to be notified when the price touches specific levels, directly on your mobile device. Features: Support and resistance analysis based on hourly data
FREE
SimpleProb
Augusto Martins Lopes
SimpleProb: 금융 시장에서 당신의 새로운 동반자! 설명 복잡한 지표가 오히려 혼란을 초래하고 있나요? SimpleProb 은 MetaTrader 4에서 거래를 보다 간단하고 효율적으로 만들기 위해 설계된 기술 분석 지표입니다! SimpleProb는 최근 14개의 가격 기간을 분석하여 상승 ( CALL ) 및 하락 ( PUT ) 확률을 계산합니다. 이를 통해 차트에서 명확한 시각적 신호를 제공하여 매매 결정을 더욱 직관적으로 할 수 있도록 돕습니다. 작동 방식 간단한 확률 계산 : 최근 14개의 가격 기간을 분석하여 상승 및 하락 확률을 계산합니다. 시각적 신호 : 녹색 화살표 : 높은 확률의 매수 기회를 나타내며, 가격 아래에 표시됩니다. 빨간색 화살표 : 높은 확률의 매도 기회를 나타내며, 가격 위에 표시됩니다. 통계 박스 : 차트에서 실시간으로 가격 변동 확률을 표시합니다. 이 박스는 자유롭게 이동할 수 있어 분석이 더욱 편리합니다. SimpleProb를 선택해야 하는
Bollinger Ultimate
Augusto Martins Lopes
Transform Your Trading with the Ultimate Bollinger Bands Expert Advisor! Are you tired of trading strategies that don't deliver consistent results? Introducing the   Ultimate Bollinger Bands Expert Advisor   – the ultimate tool for traders looking to maximize profits and minimize risks. Key Features: Accurate Signals:   Utilizes the renowned Bollinger Bands strategy to identify high-probability trading opportunities. Intelligent Risk Management:   Protect your capital with advanced risk manageme
Volume Traders
Augusto Martins Lopes
VolumeTrader - Advanced Expert Advisor for MetaTrader 4 Maximize Your Profits with Volume and RSI Analysis! Tired of manually searching for patterns and missing market opportunities? VolumeTrader is the solution you are looking for! This advanced Expert Advisor (EA) is designed to identify trading opportunities based on two of the most powerful market indicators: Trading Volume and the Relative Strength Index (RSI). Key Features: Volume Analysis:   The EA monitors the buy and sell volume of each
Heat Map Pro
Augusto Martins Lopes
고급 거래량 분석을 위한 히트맵 지표 이 지표는 시장의 거래량 활동을 시각적으로 표현하여 사용자가 거래량의 흐름과 변화를 보다 명확하게 파악할 수 있도록 도와줍니다. 주요 기능 1. 히트맵 시각화 거래량 강도를 색상으로 표시합니다: • 파란색: 낮은 활동 • 초록색: 중간 활동 • 주황색: 높은 활동 • 빨간색: 매우 높은 거래량 2. 사용자 맞춤형 인터페이스 • 사용자 선호에 따라 색상 조정 가능 • 실시간 백분율 표시 옵션 제공 • 직관적인 디자인으로 해석 용이 3. 알림 시스템 • 특정 시장 조건에 대한 사용자 설정 알림 • 중요한 변화에 대한 실시간 알림 제공 4. 최적화된 성능 • 낮은 시스템 자원 사용 • 모든 시간 프레임과 호환 가능 활용 사례 • 단기 매매: 거래량 급증 및 변동성 포착 • 스윙 트레이딩: 누적 및 분산 영역 분석 지원 • 스캘핑: 빠른 시장 변화 감지 설정 옵션 • 분석 기간 조정 가능 • 틱 거래량 또는 실제 거래량 선택 가능 • 다양한 거래 스타
SimpleprobMT5
Augusto Martins Lopes
확률 지표 설명 확률 지표는 이전 캔들의 분석을 기반으로 매매 기회를 식별하려는 트레이더를 위한 강력한 도구입니다. 분석할 캔들의 수를 설정하여 상승 ( CALL ) 및 하락 ( PUT ) 확률을 계산하고, 차트에 화살표를 표시하여 잠재적인 진입점을 나타냅니다. 특징 캔들 분석 : 설정 가능한 수의 캔들을 분석하여 상승 및 하락 확률을 계산합니다. 시각적 신호 : 차트에 색상 화살표를 표시하여 매수(녹색) 및 매도(빨간색) 신호를 제공합니다. 음성 알림 : 매매 신호에 대한 설정 가능한 음성 알림을 제공합니다. 알림 기능 : 모바일 기기 또는 이메일로 알림을 보내 거래 신호를 전달합니다. 확률 박스 : 차트에 실시간 상승 및 하락 확률을 표시합니다. 입력 매개변수 num_candles : 분석할 캔들의 총 개수. call_threshold : CALL 신호(녹색)의 최소 확률. put_threshold : PUT 신호(빨간색)의 최소 확률. sound_alert : 음성 알림 활성화
Heat Map Pro mt5
Augusto Martins Lopes
Heat Map Indicator - Advanced Volume Analysis Introducing the Heat Map Indicator - A Professional Tool for Market Volume Analysis! **Key Features** **Visual Heat Map** - Instant volume intensity visualization through colors - Blue: Low volume - Green: Medium volume - Yellow/Orange: Increasing volume - Red: High volume **Intuitive Interface** - Dynamic color scale - Real-time percentage indicator - Current level indicator - Customizable colors and transparency **Smart Alert System** - Custo
Currency Strength Lines
Augusto Martins Lopes
통화 강도 지표 설명 이 지표는 외환 시장의 주요 통화의 상대적인 강도를 분석하여 어떤 통화가 강세를 보이고 있는지, 어떤 통화가 약세를 보이고 있는지를 명확하게 보여줍니다. EUR, USD, GBP, JPY, AUD, NZD, CAD, CHF 등의 주요 통화 쌍을 평가하며, RSI 또는 ROC와 같은 방법을 사용하여 강도를 계산합니다. 각 통화의 강도는 개별 라인으로 표시되므로, 추세와 잠재적인 거래 기회를 쉽게 식별할 수 있습니다. 또한, 분석된 통화의 교차를 기반으로 매수, 매도 또는 중립 신호를 시각적으로 생성할 수도 있습니다. 주요 특징 주요 통화의 동시 분석 RSI, ROC, 이동 평균 등 다양한 계산 방법 사용 각 통화의 강도를 직관적으로 표시 자동으로 매수, 매도 및 중립 신호 생성 색상, 위치 및 레이아웃을 조정할 수 있는 맞춤형 패널 브로커의 접두사 및 접미사 지원 실시간 알림 및 알림 기능 옵션 적용 및 장점 이 지표는 모든 시간 프레임에서 사용할 수 있으며, 차
Session Time Pro
Augusto Martins Lopes
Session Time Pro 2.0 — MetaTrader 5용 지표 제품 설명 Session Time Pro 2.0 은 트레이더가 시장 세션을 효율적으로 분석할 수 있도록 설계된 지표입니다. 거래 시간, 가격 범위 및 예측을 시각적으로 표시하여 가격 움직임 패턴을 식별하는 데 도움을 줍니다. 다양한 사용자 지정 옵션을 제공하며, 선, 영역 또는 색상 캔들을 사용하여 특정 세션을 강조할 수 있습니다. 사용 설명서 주요 설정 DrawCandles : 색상 캔들을 활성화하여 세션을 표시합니다. TimeLineStart : 세션 시작 시간을 설정합니다 (HHMM 형식, 예: "0900"). TimeLineEnd : 세션 종료 시간을 설정합니다 (HHMM 형식, 예: "1700"). 비워두면 하루 종일 지속됩니다. ShowMonday...ShowSunday : 특정 요일에 세션을 표시할지 여부를 결정합니다. BarsToScan : 차트에서 분석할 바의 개수를 조정합니다. ShowFutur
Fibonacci Hunter
Augusto Martins Lopes
Fibonacci Hunter Fibonacci Hunter는 MetaTrader 5 플랫폼의 XAUUSD(골드) 전용으로 개발된 기계적 매매 시스템입니다. 이 알고리즘은 고전적인 피보나치 되돌림(Fibonacci retracement) 레벨을 사용하여 가격 반전을 식별하는 데 중점을 둡니다. 매매 전략 이 시스템은 마틴게일(Martingale)이나 그리드(Grid)와 같은 위험한 방식을 사용하지 않습니다. 로직은 4단계 검증을 기반으로 합니다: 식별 (Identification): EA는 캔들 시퀀스를 감지하여 주요 가격 충격(impulse)을 정의합니다. 계산 (Calculation): 내부 알고리즘이 피보나치 레벨(0%, 50%, 61.8%)을 자동으로 계산합니다. 확정 (Fixation): 설정이 유효하려면 가격이 61.8% 레벨에 도달(터치)해야 합니다. 진입 (Entry): 가격이 50% 레벨로 되돌림(retracement)을 줄 때만 주문이 실행됩니다. 리스크 관리 자
TradePilot Dashboard
Augusto Martins Lopes
TradePilot Dashboard 요약 MT5용 그래픽 패널로, 주문 관리 버튼(Buy/Sell/Close/SL/TP), 마진 확인, 로그 제어 기능을 제공합니다. 사용이 간편하며 데모 계정에서 테스트 가능. 수익을 보장하지 않습니다. 상세 설명 TradePilot Dashboard는 MetaTrader 5에서 수동 및 반자동 주문 관리를 위한 그래픽 인터페이스(Controls)를 갖춘 전문가 어드바이저(Expert Advisor)입니다. 버튼, 입력 필드, 마진 확인 기능이 포함된 시각적 패널을 제공하여 트레이더가 차트에서 직접 빠르게 거래할 수 있도록 도와줍니다. 주요 기능 • 40개 이상의 버튼과 다양한 입력 필드(거래량, 핍, 트레일링, 반대 SL 등)를 갖춘 반응형 패널 • Trade.mqh(CTrade) 라이브러리를 사용하여 시장가 및 지정가 주문(Buy, Sell, BuyStop, SellStop) 실행 • 주문 전 자유 마진 확인(ACCOUNT_MARGIN_FRE
필터:
리뷰 없음
리뷰 답변