Clever Market Profile LVNs MT5
- 지표
-
Carlos Forero
 저는 자본 시장 및 알고리즘 포트폴리오 구축 분야에서 10년 이상의 경험을 가진 전문 개발자이자 트레이더입니다. MetaTrader를 위한 고급 자동화 시스템 및 기술 분석 도구 개발을 전문으로 합니다.
⚙️ 개발 철학
저의 접근 방식은 엄격하게 정량적이고 데이터 기반입니다. 시장 노이즈를 필터링하고 실질적인 통계적 우위를 제공하도록 시스템을 설계합니다. 저는 지름길을 찾지 않으며, 거래에 수학과 논리를 적용합니다.
🔷 저의 도구에서 무엇을 기대할 수 있습니까? - 버전: 2.6
- 업데이트됨: 5 5월 2026
- 활성화: 5
Description
The indicator uses market profile theory to show the most relevant trading zones, on a daily basis. The zones to be shown are LVN (low volume nodes) and POC (point of control).
- An LVN zone is one which represents price areas with the least time or volume throughout the day. Typically, these areas indicate a supply or demand initiative, and in the future, they can turn into important breakout or retracement zones.
- A POC zone is one which represents price areas with the most time or volume throughout the day.
Support: We create great tools for the entire trading community. Most of them are free.
If you believe in what we do Support Us Here.
KEY LINKS: How to Install – Frequent Questions - All Products
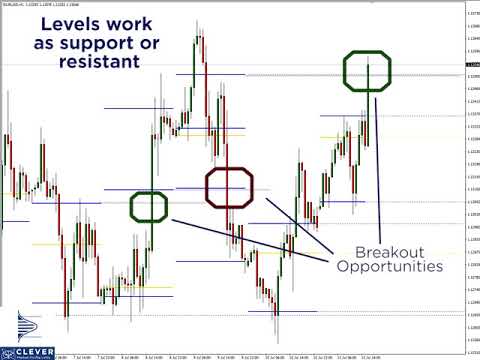
How is this indicator useful?
- It will allow you to have a reference of the most important trading zones for the current day, as well as those prior to it.
- It will allow you to trade retracement or breakout patterns, everytime they occur in a given zone.
- You’ll be able to use virgin levels of previous days’ LVN or POC, to identify potential resistance or support levels. Be mindful that you can use these levels as take profit zones.
- For more uses research market profile theory.
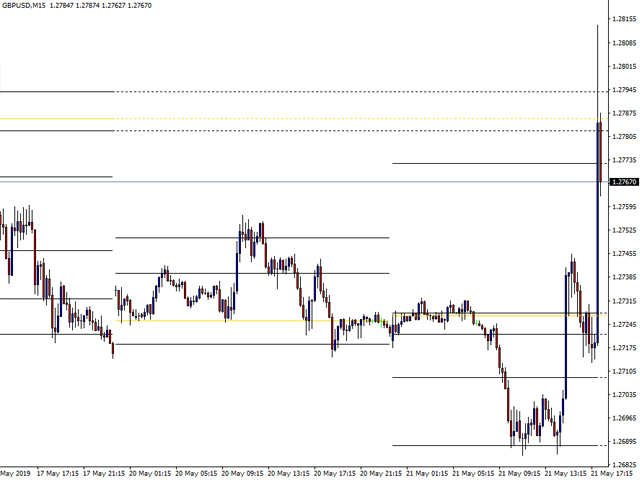
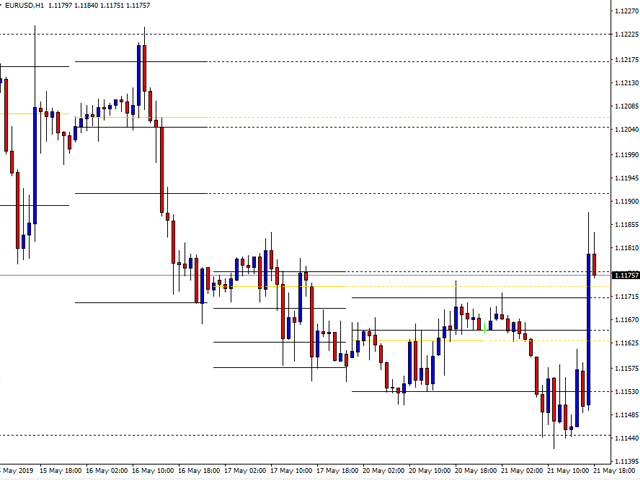
Components
For each day, the indicator will show within a given price chart and under any timeframe, the following components:
- Horizontal black lines: These represent LVN zones.
- Horizontal yellow lines: These represent POC zones.
- Horizontal dotted lines (black/yellow): These represent virgin levels. A virgin level is one which hasn’t been filled on any future period.
About Author:
Carlos Forero, Member of Clever Trading Club, private organization with the purpose of design clever solutions to generate constant profits with adapted risk.


Macht einen guten Eindruck, arbeitet sauber. Der Entwickler reagiert schnell auf seine Kunden - Vielen Dank! Eine nützliche Unterstützung im Handelsalltag.