MetaTrader 5용 새 Expert Advisor 및 지표 - 82

Adaptive ATR Trailing Stop Volatility-Adaptive Stop Loss Management Tool This Expert Advisor manages stop losses for existing positions using the Average True Range indicator to adapt trailing distance based on current market volatility. Brief Description Adaptive ATR Trailing Stop is a utility Expert Advisor that automatically adjusts stop loss levels for open positions. The tool uses ATR to calculate appropriate trailing distances that adapt to changing market conditions, protecting gains whil
FREE
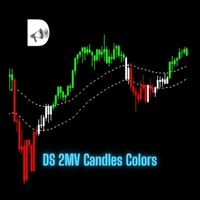
DS 2MV Candles Colors Created by Hermínio Machado 2025 The DS 2MV Candles Colors indicator visually enhances your chart by coloring candles based on price position relative to two Smoothed Moving Averages (SMMA) .
It’s designed to help traders quickly identify the current trend direction and potential neutral zones at a glance. How It Works The indicator plots two Smoothed Moving Averages (SMMA) — one based on the High and another on the Low price. Candle colors change according to wher

FiboPivot Dashboard - Professional Pivot Point Indicator
What It Does FiboPivot Dashboard is a powerful technical analysis tool that automatically calculates and displays Fibonacci-based pivot points on your chart. It identifies key support and resistance levels based on the previous day's price action, helping traders anticipate potential price reversal points and breakout levels.
How to Use 1. **Install & Apply**: Simply attach the indicator to any chart (time frames below D1) 2. **
FREE

Gold Buy Trader EA (MT5) Platform: MetaTrader 5 (Hedging accounts recommended)
Instruments: XAUUSD (Gold). Also works on other majors/indices at your discretion.
Timeframes: M5–W1 (multi-timeframe engine inside)
Dependencies: None What it is for? Gold Buy Trader EA is a discretionary-style algorithm that combines RSI + Stochastic signals across multiple timeframes (Scalp, Day, Swing) with optional grid/basket management , individual trailing stop , and hard basket stops by equity % or price lev
This indicator is a technical tool based on harmonic approximations of solar and lunar cycles. It does not use exact astronomical positions. This indicator uses mathematical waves to approximate daily solar and monthly lunar cycles for trading purposes. It captures general market rhythms influenced by day/night and moon phases, but it does not track exact astronomical positions . Do your analysis and study on back test before purchase. The Advanced Astrological Indicator is a m

Supertrend Analysis Dashboard (Multi-Timeframe Edition) Advanced Real-Time Trend, Volatility & Risk Analysis Tool for Smart Traders Short Description
A professional multi-timeframe Supertrend indicator with a real-time analytical dashboard, risk alerts, pullback zones, and higher-timeframe confirmation system — all visualized directly on the chart.
Full Description
Supertrend Analysis Dashboard is a next-generation indicator that combines Supertrend logic, multi-timeframe confirmation, and r
FREE

Volumatic Fair Value Gaps is a precision-engineered indicator for identifying, analyzing, and visualizing Fair Value Gaps (FVGs) backed by volume intelligence. This tool goes beyond standard FVG plotting by dissecting volume dynamics inside each gap using lower-timeframe sampling , offering clear insight into whether bulls or bears dominate the imbalance. Designed for technical traders, this indicator overlays high-probability gaps only, visualizes bullish vs. bearish volume composition , and pr

ECCENTRADES Presents: The Nascalper Expert Advisor
Introducing the Future of NASDAQ Trading
The Nascalper is a cutting-edge prediction algorithm built to trade on the prestigious NASDAQ (NAS100) index and its futures.
By combining traditional indicators , along with trend detection and candlestick analysis , our algorithm is designed to predict and execute trades with high accuracy — maximizing profit while minimizing risk. Our system maintains both relative and absolute drawdowns at a mi
Spectral Frequency Engine — AI-Driven FFT Expert Advisor for EUR/USD (M1)
Spectral Frequency Engine is an advanced automated trading system (Expert Advisor) optimized for EUR/USD on the M1 (1-minute) timeframe. This EA uses cutting-edge Fast Fourier Transform (FFT) spectral analysis to identify hidden momentum waves and frequency shifts within market data — transforming raw price movement into a scientific trading signal.
Unlike conventional EAs that rely only on moving averages or oscillator
FREE

Wikirobo | Smart Entry Zone Indicator for All Timeframes Wikirobo is a powerful indicator that automatically highlights potential entry zones as Buy Limit and Sell Limit orders across all timeframes. Highlights Suggested entry zones for every timeframe ️ Clear, timeframe-specific Stop Loss levels shown on the chart for better risk management and position sizing Suitable for scalpers, day traders, and swing traders —flexible for any trading style How to Use Instea
FREE

NeuraVault Pro v1.0 - Professional RSI Reversal Trading System Overview NeuraVault Pro is a professional automated trading system based on RSI (Relative Strength Index) reversals. It is designed to capture reversal opportunities in overbought and oversold zones, equipped with advanced filters and comprehensive risk management features. Trading Logic Core Strategy: RSI Reversal The EA captures reversal opportunities when the market reaches overbought or oversold zones: BUY Signal: RSI value drops
FREE

Dual-TF Daily Bias Dashboard — Serious Day Trading Companion Trade the day with clarity.
Dual-TF Daily Bias Dashboard gives you a crisp, at-a-glance read of the intraday directional bias using a robust, dual-timeframe engine (H1 + M15). It also shows a single London→NY trading window so you instantly know when to engage and when to stand down. This is an add-on tool to keep you disciplined: buy when the bias aligns bullish, sell when it aligns bearish, or don’t trade when conditions are mixed.

Помощник для ручной торговли. Рассчитывает лот по вашему риску, показывает все параметры сделки до её открытия.
Два режима: Market - для входа по текущей цене. Линия Open следит за Ask/Bid автоматически. Breakout - для отложенных ордеров. Выбираешь свечу и таймфрейм, линии ставятся на High/Low.
Можно менять цвета линий, переназначать клавиши, двигать панель куда удобно.
FREE
The MTF Support/Resistance & Trendline Analyzer is a powerful multi-timeframe indicator that automatically detects key support and resistance levels , draws dynamic trendlines , and provides a real-time market structure dashboard — all in one clean, lightweight display. It combines fractal logic and price action detection across three timeframes to give you a unified view of market direction and structure. Whether you trade reversals, breakouts, or trends, this tool highlights the zones that mat
FREE
Symbol Cycler & Sync Tool - User Guide This Expert Advisor (EA) is a powerful utility designed to streamline the management of multiple charts in MetaTrader 5. It allows you to group charts together and control them simultaneously, saving you time and improving your workflow. Core Features Multi-Chart Syncing: Create "Sync Groups" by assigning the same SyncGroupID to multiple charts. All charts in a group act as one, allowing you to change their symbols and sync objects across them instantly. Cu

Hull Moving Average (HMA) The Hull Moving Average (HMA) is a refined version of the traditional moving average, designed to minimize lag while keeping the line smooth and precise .
Developed by Alan Hull , this indicator provides a faster and more accurate trend signal than standard moving averages such as the SMA or EMA. How It Works The Hull Moving Average uses a Weighted Moving Average (WMA) in a special way to reduce delay and smooth price movement.
Its calculation follows three main steps:

# Scorpion 75 - Advanced Adaptive Grid Trading Robot. ## Product Overview
Scorpion 75 is a sophisticated fully automated grid trading Expert Advisor that employs adaptive algorithms to dynamically adjust trading positions based on market conditions. Unlike traditional grid systems, Scorpion 75 features intelligent repositioning, comprehensive risk management, and multiple operational modes to optimize performance across various market environments.
## Key Features
### **Adaptive Grid

CRT RSI EA - Sistema de Trading de rechazo ycontinuacion de tendencia con RSI PRESENTACIÓN: CRT RSI EA es un experto automatizado especializado en operar rechazos de precio que confirman tendencias , utilizando los límites del RSI como zonas de entrada estratégicas. ESTRATEGIA CENTRAL: El EA se enfoca en identificar: Rechazos en niveles clave que confirman la fuerza de la tendencia actual Operaciones dentro de los límites del RSI entre 30-70, evitando zonas neutras Se

The Follow Line Indicator is an essential technical analysis tool that provides a clear, immediate visualization of the trend while detecting high-probability reversals in real-time. By combining adaptive price tracking with clear visual alerts, it transforms complex data into actionable trading signals. Key Features Dynamic Trend Line: Tracks the market's prevailing direction, automatically adjusting to each new price extreme. Clear Colors: The line turns Blue during uptrends and Red during dow

# Higher-Lower Pending Bot - Advanced Multi-Pending Orders System
## Revolutionize Your Trading with Smart Pending Order Automation
Welcome to the **Higher-Lower Pending Bot** - the most sophisticated pending order management system available on MQL5. Designed for traders who want to maximize opportunities while minimizing manual effort, this EA combines intelligent order placement with comprehensive profit tracking in one powerful package.
## What Makes Our Bot Unique?
### Smart D

MT5 TradeZone Manager – Advanced Position Cluster Control EA Trade Smarter – Earn Steady Profits.
MT5 TradeZone Manager is a powerful Expert Advisor designed for traders who use high-volume or full-margin trading strategies within specific pip ranges. It automatically manages your positions inside a defined “Trade Zone,” ensuring your stop loss and take profit levels stay perfectly synchronized — saving you time and reducing risk. Key Features Zone-Based SL/TP Management
When you modi

Institutional Level of Automated Trading from within! BlockStrike EA is a professional-grade automated trading system that combines Order Block logic with Momentum confirmation to identify and trade high-probability setups with precision. It detects areas where institutional traders (smart money) enter the market, known as order blocks , and confirms entries only when momentum aligns in the same direction. This combination helps filter false signals and maintain strong risk management. By defau

How It Works: Master Mode : Monitors open positions and their SL/TP changes on the Master account for a specified symbol (e.g., BTCUSD). Writes trade details (ticket, symbol, type, volume, price, SL/TP, status) to a master.txt file in the Common\Files directory every 100ms or when changes are detected. Optionally closes all trades at a specified StopTime (e.g., 13:15) if enabled. Supports fixed TP/SL, resetting dynamic SL/TP to zero and monitoring custom levels internally. Slave Mode : Reads tra

Based on the 5-star Petal Ronin free expert advisor, Petal Ronin Extreme incorporates the recommendations of global users for Petal Ronin and adds a few tweaks to push the limits of precision.
Users recommended a risk behaviour that allows for a fixed lot pick and that has been implemented with this Extreme version. Moreover, the trailing stop loss has been tightened and the SMA and ADX settings made a bit more aggressive.
Test across for multiple timeframes with the varied risk behaviour and
Fibonacci Pullback EA detects the latest valid swing via symmetric pivots and projects a configurable Fibonacci level across that range. When the previous closed candle wicks into that level and confirms on close , the EA places an order with SL at the swing extreme plus a points buffer , and TP at the opposite swing extreme. Designed originally for EURUSD M30 and USDJPY M30 , yet fully configurable. Signal logic Determines the latest bearish or bullish swing using symmetric pivots. Computes a F

Fuzzy Oscillator is developed for personal use in future EA projects, so Fuzzy Oscillator is not too special, but it will help make trading easier when you can use Fuzzy Oscillator to identify trends and entry and exit points. Why Choose Fuzzy Oscillator: Fuzzy Oscillator is not repaints. There are many ways to use it like trading pullback, reversals and many more. Can help traders identify potential trend reversals, momentum shifts. Catch the long wave when a new trend starts. Suitable for all
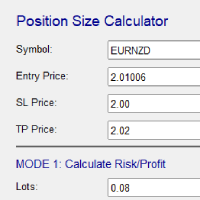
Risk and Position Size Calculator – Expert Advisor Utility A powerful and easy-to-use EA utility designed to help traders manage risk with precision. It automatically calculates the optimal position size based on your account balance, chosen risk percentage, and stop loss. In addition, it calculates potential profit and displays take profit levels directly on the chart. Fully customizable and compatible with all instruments and timeframes, it's the perfect tool for improving your risk management
Indicator converted from tradingview script by 'everget'
"This is a redesign of the Chandelier Exit indicator. It removes stupid transitions between Chandelier Exit' states and highlights initial points for both lines.
This indicator was originally developed by Charles Le Beau and popularized by Dr. Alexander Elder in his book "Come Into My Trading Room: A Complete Guide to Trading" (2002).
In short, this is a trailing stop-loss based on the Average True Range (ATR) ."
Indicator also offers

TradeMind Pro EA - Description Why TradeMind Pro EA is Essential for Your Trading Success Revolutionary LLM-Powered Trading: The world's first Expert Advisor built entirely on Large Language Model technology, bringing the power of advanced AI reasoning directly to your MetaTrader 5 platform. TradeMind Pro EA doesn't rely on traditional technical indicators or hardcoded algorithms – instead, it leverages cutting-edge Language Models (GPT-4, Claude, Gemini) to analyze market conditions with hu

Title: Dynamic SR Levels Pro Short Description: A next-generation, multi-timeframe Support & Resistance indicator that automatically detects, adapts, and invalidates key price zones based on real-time market volatility. Stop guessing, start seeing. Full Description: Tired of manually drawing support and resistance lines that quickly become outdated? Dynamic SR Levels Pro is the ultimate solution for traders who demand precision, adaptability, and a clean, clutter-free chart. This is not just ano
Dual Trend Assassin - Crystal Clear Trading Signals
Why Dual Trend Assassin? Unlike standard indicators, this uses TWO ATR calculations (short-term and long-term) working together to filter out false signals and confirm high-probability trend reversals. You only get signals when BOTH timeframes align - meaning stronger, more reliable entries. Key Features: Clean Visual Signals - Bold buy/sell arrows that are impossible to miss Flexible Alert System - Choose from popup alerts, email notificat

Candle Timer Countdown v2.5 is an advanced MQL5 indicator designed to enhance your trading precision. It provides a live countdown for each candle while simultaneously analyzing multiple timeframes to detect trend direction and potential early reversals. Key features include: Candle Countdown & Progress Bar: Monitor the exact time remaining for each candle with a clear progress visualization. Advanced Trend Detection: Analyze both fast and slow trends with configurable sensitivity and multi-time
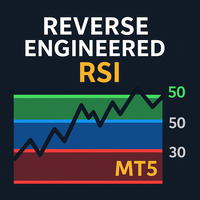
Reverse Engineered RSI Introduction Reverse Engineered RSI transforms the way traders use the RSI indicator.
Instead of displaying RSI in a separate oscillator window, this tool projects the key RSI levels — 30, 50, and 70 — directly onto the price chart . This allows traders to see where overbought, oversold, and equilibrium zones align with actual price levels — without switching charts or guessing momentum conditions.
You get precise RSI-derived support and resistance levels right on the c

MultiTF_Fibonacci is a precision tool for traders who rely on Fibonacci retracements across multiple timeframes. This indicator automatically draws Fibonacci levels from the previous candle of a selected timeframe, allowing you to monitor real-time price reactions with clean visuals and workflow-friendly logic. Key Features: • Multi-Timeframe Support: Choose any reference timeframe (e.g. D1, H4, M15) to anchor your Fibonacci levels. • Custom Level Input: Define your own retracement levels usin
Mini Chart (Canvas) is a lightweight, interactive sub-chart that overlays directly onto your main MetaTrader 5 chart. Designed for traders who want a compact, customizable view of another symbol or timeframe, this tool delivers real-time price action in a clean, resizable canvas — perfect for multi-symbol monitoring, scalping setups, or visual strategy overlays. Key Features: • Multi-Symbol & Multi-Timeframe Support: Display any symbol and timeframe independently from the main chart. • Resizab

Spectrum Trend Pro MTF Professional Multi-Timeframe Moving Average Analyzer Spectrum Trend Pro MTF is a powerful yet lightweight tool designed for traders who want a clear, structured view of market direction across multiple timeframes.
It builds a full-spectrum map of the trend by analyzing dozens of moving averages — from fast intraday shifts to long-term momentum — and visualizes the overall sentiment in a compact on-chart dashboard. Whether you’re trading trends, pullbacks, or reversals, Sp

TrailGuard — Intraday EMA Cross + Smart Trailing & EOD Flat
What it does
Goes Long on EMA bullish cross, Short on bearish cross (closed bars).
Trailing engine increases target and moves SL stepwise after price passes a start threshold (choose % or points).
Intraday profile: trading window + EOD close (no overnight).
No external indicators (EMAs computed internally) → fast, robust backtests.
Why it works
Simple, data-driven edge (EMA 20/50±) on M5–M15 produces frequent, clean signals.
FREE

Short Market Description (recommended) Market Periods Synchronizer highlights higher-timeframe (HTF) sessions directly on your current chart, so you can trade the lower timeframe with full higher-timeframe context. Draws vertical lines for each HTF bar (e.g., H1 on an M5 chart) Optional body fill (green for bullish, red for bearish) for each HTF candle Optional Open/Close markers with labels to spot key reference levels fast Optional minor-timeframe dividers (e.g., M30 & M15) only inside each
FREE

Support & Resistance Reversal EA (((-----Introductory Price for the first 10 buyers only!!!----)))
Overview Support & Resistance Reversal EA is a fully automated Expert Advisor designed to trade reversal strategies at key support and resistance levels. The EA intelligently identifies significant support and resistance zones based on historical price action. When the price enters these zones, the EA actively looks for reversal signals to execute Buy orders at support and Sell orders at resist

Overview
The RSI TrendMaster EA is a fully automated trading system designed for XAUUSD (Gold) on the M5 timeframe . It combines Relative Strength Index (RSI) momentum signals with a trend confirmation filter based on the Exponential Moving Average (EMA) . The Expert Advisor dynamically adjusts position size according to the selected risk percentage and calculates Stop Loss and Take Profit levels using the Average True Range (ATR) . This allows the system to adapt to changing market conditions

# Trading Info Panel - Your Complete Trading Dashboard
## Why This Indicator Was Created
As a fullscreen trader, I was constantly frustrated with the hassle of: - Exiting fullscreen mode to check positions - Switching between charts and the terminal window - Losing focus on price action while checking account status - Missing critical margin levels during active trading
**I needed a simple, elegant solution that kept all vital trading information visible at a glance - without disruptin
FREE

Trendline Toolbox (MT5) Trendline Toolbox is a utility indicator for MetaTrader 5 that helps manage trendlines and common chart objects. It is a charting tool; it does not provide trading signals and does not guarantee any profit. Main functions Clone the selected trendline (keeps style, angle, and price levels). Toggle the Extend/Ray property for the selected trendline. Delete the selected trendline. Purge all objects on the current chart. Draggable panel: double-click the hand icon and drag t
FREE

Your feedback is very valuable to us. By sharing your experience, you help us improve and provide you with better service. Thank you!
PIPnova Candle Signals: Catch the Clearest Reversal Signals in the Market! PIPnova Candle Signals is a professional MetaTrader 5 indicator designed to instantly detect critical moments in price action—namely, potential trend reversals and points of indecision. It reliably catches the most powerful and trustworthy candle patterns, Pinbars and Dojis, with custo
FREE

Overview Anti-Spoofing Strategy (v1.0) is a live-market Expert Advisor designed to detect and counter high-frequency DOM (Depth of Market) spoofing manipulations in ECN/STP environments.
The system monitors real-time Level-2 order book changes via MarketBookGet() and identifies large fake orders that appear and vanish within milliseconds — a hallmark of spoofing. Once such manipulations are detected, the algorithm opens a counter trade in the opposite direction of the spoof, anticipating the tru
FREE

Code Description This is an automatic Expert Advisor (EA) for MetaTrader 5 that opens trades based on comprehensive trend analysis and technical analysis for the Cocoa market ( Cocoa market only). The strategy uses: · TEMA (various periods) to identify bullish, bearish or consolidation phases · RSI, Stochastic, CCI and MACD to confirm trading signals · Fractals for trade entries at local lows · Short-term price action analysis is used for precise entry timing. Key

Momentum Confluence Zone (MCZ) – MetaTrader 5 Indicator Overview
Momentum Confluence Zone is a custom chart indicator for MetaTrader 5.
It calculates dynamic price zones using a combination of moving average, volatility, and momentum measures. The indicator aims to assist traders in observing areas where price behavior and momentum interact. Operation Logic The indicator uses an Exponential Moving Average (EMA) as a reference. Dynamic zones are calculated above and below the EMA using the Avera

EUMaster Pro - Professional EUR/USD Trading System Optimized specifically for EUR/USD M5 timeframe EUMaster Pro is a systematic trading solution designed for EUR/USD on the 5-minute chart. Using Moving Average crossovers combined with RSI confirmation, this Expert Advisor identifies high-probability trade setups and manages positions through an intelligent basket closing system. Core Features: Smart basket management (no traditional stop-losses) Adaptive recovery system for position averaging F

Trade Whale – Tick Compression Breakout (v1.0) is a short-term breakout scalper that filters setups via ATR-based compression . After price coils in a tight band on your chosen timeframe (e.g., H1), it opens a position when the previous candle’s high/low is broken . Risk is anchored by SL = ATR × multiplier , while TP is an R-multiple of that stop distance (e.g., 2.0R). Position size can be percent-risk or fixed lot , and is margin-clamped to broker limits for safety. A timeout can auto-close p

Infinity Gold X – Precision-Engineered XAUUSD (Gold) EA “One shot. One trade. One precision entry.” Infinity Gold X is a precision-engineered Expert Advisor built for disciplined gold traders who value control, stability, and consistency. This system doesn’t chase trades — it waits for perfect technical confirmation and strikes only when probability is on your side. Backtest Period 2024–2025 , current market situation Optimized and tested on historical data from showing stable a

Adaptive Market-Structure Grid (AMSG) Indicator Overview
The Adaptive Market-Structure Grid (AMSG) is a custom indicator for MetaTrader 5 designed to visualize evolving market structure through adaptive grid levels.
It detects price swings, constructs dynamic grids, and adjusts to changing volatility conditions.
The indicator helps traders observe how market structure shifts between trending and ranging phases. How It Works
AMSG continuously evaluates price data to identify swing highs and low

Spike Hunt EA: A Strategy to Capture Reversals After Sharp Price Spikes (((-----Introductory Price for the first 10 buyers only!!!----))) The Spike Hunt EA is an Expert Advisor specifically designed to profit from a common market behavior: a rapid reversal following a strong and sudden price spike. This EA employs a robust logic to identify high-probability reversal "Spike" candles. It uses Bollinger Bands breakouts as an initial alert and
then performs a detailed candlestick analysis to pin

Overview
All in One Swing Points is a precision swing detection indicator that automatically plots three levels of market swing structures—from the strictest 3-bar formations to long-term turning points—all in one visual layer.
This tool gives traders a clear, multi-timeframe perspective on price structure shifts, making it ideal for identifying market reversals, liquidity sweeps, and structure breaks with minimal clutter.
Key Features
a. 3 Swing Levels in One Indicator Strict 3-Bar S

Your feedback is very valuable to us. By sharing your experience, you help us improve and provide you with better service. Thank you!
PIPnova – Advanced Signal Indicator (v2.1) PIPnova is a professional MetaTrader 5 signal indicator powered by advanced algorithms, a multi-layer filtering system, and real-time signal performance tracking. Key Features Powerful signal algorithm based on RSI , Stochastic , and a custom LWTI oscillator Automatic TP / SL level placement for each signal Outc

Overview SDZ Trend Pro is a professional Expert Advisor work for all symbol, recommend XAUUSD (Gold) trading on the H1 timeframe . It combines dynamic price action patterns, EMA filters, and strict session-based trading logic to identify precise market entries with optimal risk control. This EA is ideal for traders who prefer structured, time-filtered trading during active market hours. ️ Core Features Dynamic Stop Loss (SL) logic Automatically sets SL based on candle pattern Chooses the

Night Edge – Futuristic AI Algo for Gold (XAUUSD) Harness the power of AI-driven precision and human-like market logic — trade Gold like never before. About Night Edge Night Edge is an advanced AI-powered trading system built on the core principles of price action , smart money concepts , and machine learning logic .
Designed specifically for XAUUSD (Gold) , this algorithm combines trend detection , break & retest entry logic , and dynamic supply/demand zones with an intelligent risk engin

Matrix Bot: Mock Neural Network EA for XAUUSD Uptrend Trading Matrix Bot is a specialized Expert Advisor for MetaTrader 5, utilizing a mock neural network system to detect and exploit uptrends in XAUUSD. Optimized for the H1 timeframe, it executes buy-only trades to capture bullish momentum, using simulated NN logic alongside traditional indicators to filter signals and reduce noise in sideways or bearish markets. Core Strategy Overview The bot employs a lightweight mock neural network—a simplif
MT5 → Telegram Notifier (Utility · Informers) Send trading events from MetaTrader 5 directly to Telegram. Perfect for journaling, team alerts, or remote monitoring. What it does Trade Open : posts BUY/SELL, BUY/SELL Limit, BUY/SELL Stop, lots, entry, SL/TP, local time. (Optional chart screenshot.) SL/TP Update : short message — only what changed (new SL or TP), posted as reply to the original trade message. Partial / Full Close : posts closed volume, price, Net P/L (swap + commission included),

JiaXu AMSG ( AMSG_ATR ) is an Expert Advisor for automated trading. It calculates trading signals based on moving averages, swing highs and lows, and the Average True Range (ATR). The EA uses a grid approach and ATR-based trailing stops to manage open positions.
Features include: - Adaptive calculation of market swings. - Dynamic adjustment of stop-loss levels using ATR. - Lot size calculation according to a fixed risk percentage per trade. - Configurable grid levels for trade management. -

Sun Bin SCF is an Expert Advisor that identifies moments when market participants act in the same direction. It observes recent price bars and volume to detect situations where buyers or sellers dominate together. When a consistent crowd movement appears, the EA opens a trade in the same direction and manages it using pre-defined risk and exit rules.
Main Features: - Crowd detection based on consecutive bars with similar direction. - Volume confirmation to avoid false signals in low-activity

Symbol: ETHUSDTm , XAUUSD
Timeframe: M15
Minimum Deposit: $100
Single-Order Trading:
Broker Compatibility: Works with any broker (2–3 digit symbols, any currency, any GMT offset)
Setup: Plug-and-play — runs instantly without configuration ️ Overview Eclipse-xNova is an advanced algorithmic trading system designed to capture market inefficiencies across Crypto and Gold markets with unparalleled precision.
Built upon a custom indicator core combined with MA-based trend filters and dynami
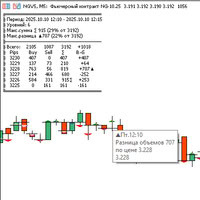
Largest Volumes and Deltas — это инструмент для MetaTrader 5, который проводит анализ рыночных объемов покупок и продаж в реальном времени и точно определяет сумму и разницу по каждому уровню цены внутри периода выбранного таймфрейма. Инструмент визуализирует ценовые уровни максимальных значений, где рыночная активность была максимальной, давая трейдеру четкое понимание расстановки сил "быков" и "медведей".
Ключевые возможности и преимущества: Определение максимумов внутри периода таймфрей

BTC Trading Assistant EA Manual Trading Tool with Automated Risk Management This Expert Advisor assists manual cryptocurrency traders by automating risk management, position sizing, and profit protection while providing visual trade management through an intuitive interface. Brief Description BTC Trading Assistant EA is a utility tool designed for manual cryptocurrency traders. The EA calculates position sizes based on account risk, automatically sets stop loss and take profit levels, manages br

Trade History By Magic Indicator Unlock Your Trading Insights with Trade History By Magic! Enhance your MetaTrader 5 experience with this powerful indicator designed for traders who demand precision and clarity. Trade History By Magic provides a clear, real-time display of your trading history, organized by magic numbers, directly on your chart. Perfect for both automated and manual traders, this tool helps you track performance effortlessly. Key Features: Organized Trade Tracking : Displays tra

TechBot Indicator is an intelligent, high-precision trading system built on complex mathematical logic — not a mix of standard indicators. Using proprietary analytics and dynamic data modelling, TechBot interprets market strength, timing, and momentum with exceptional accuracy. It continuously filters market noise to reveal only high-confidence setups, giving traders a clear, predictive view of upcoming movements. Originally optimized for synthetic markets, TechBot’s self-scaling mathematical m

Unlock the Silver Market's Full Potential: Introducing White Gold for XAG/USD M5
The silver market (XAG/USD) is a realm of immense opportunity, but its rapid volatility can challenge even the most experienced traders. What if you could harness that energy with a system designed for unparalleled performance?
Meet White Gold, your new definitive edge in the precious metals market.
White Gold is not just another trading tool; it is a comprehensive, multi-strategy system forged specifically fo

sTrade UI is a compact, lightweight alternative for O ne-Click Trading which built-in MT5 didn't offer.
Designed for traders especially scalpers who want a clean and fast trade execution. Key features: Minimal CPU footprint Docked One-click Right Panel to Perform New Position*
One-click Close at Position's Price* Ability to Close All Position* Option to stick Position's PL info to latest candle and able to colorize it *: Tied to EA's Magic number (EA's Id), set to 0 if want Globally This is m

Auric Gold EA- An Intelligent Grid System with a Proprietary Core Logic
Auric Gold EA is an advanced algorithmic trading system developed exclusively for the XAUUSD (Gold) market. It is engineered not just to trade, but to intelligently navigate the unique volatility of gold. Our core philosophy is to build sustainable, long-term growth by applying a disciplined and systematic approach to the market, turning its inherent fluctuations into consistent opportunities.
The system's "brain" operate

============== Prop [AUREA] MT5 ============== - Capitalize on daily volatility with this intelligent EA for XAUUSD. (Optimized for Gold, but will work fine for other parities with high volatility). - It automatically defines the opening price channel and trades high-probability breakouts. - A smart adaptive exit strategy aims to let winners run, ensuring consistent performance in both trending and volatile markets.

MA Catcher Pro - 2025 Edition
=====================================
Indicator Type: Moving Average Crossover Alert (MetaTrader 5)
Version: 1.0 (2025)
Platform: MetaTrader 5 (.mq5)
--------------------------------------------------------------
OVERVIEW
--------------------------------------------------------------
MA Catcher Pro is a professional-grade trend detection indicator that alerts you whenever a Fast Moving Average crosses a Slow Moving Average.
It provides visual, sound, and push not

Limited stock at the current price!
Final price: $1999 --> PROMO: From $299 --> The price will go up every 5 purchases, next price : $399 Golden Mirage is a robust gold trading robot designed for traders who value reliability, simplicity, and professional-grade performance. Powered by a proven combination of RSI, Moving Average, ADX, and High/Low Level indicators, Golden Mirage delivers high-quality signals and fully automated trading on the M5 timeframe for XAUUSD (GOLD) . It features a robu
MetaTrader 마켓은 과거 데이터를 이용한 테스트 및 최적화를 위해 무료 데모 거래 로봇을 다운로드할 수 있는 유일한 스토어입니다.
어플리케이션의 개요와 다른 고객의 리뷰를 읽어보시고 터미널에 바로 다운로드하신 다음 구매 전 트레이딩 로봇을 테스트해보시기 바랍니다. 오직 MetaTrader 마켓에서만 무료로 애플리케이션을 테스트할 수 있습니다.
트레이딩 기회를 놓치고 있어요:
- 무료 트레이딩 앱
- 복사용 8,000 이상의 시그널
- 금융 시장 개척을 위한 경제 뉴스
등록
로그인
계정이 없으시면, 가입하십시오
MQL5.com 웹사이트에 로그인을 하기 위해 쿠키를 허용하십시오.
브라우저에서 필요한 설정을 활성화하시지 않으면, 로그인할 수 없습니다.