• 미리보기
  • 리뷰 (28)
  • 코멘트 (160)
  • 새 소식

Zup Universal ZigZag with Pesavento Patterns

4.64

The ZUP is based on two ideas.

  • Idea 1 - combine a variety of methods for identifying extremums (minimums and maximums) on the market price charts in a single indicator.
  • Idea 2 - make it possible to easily bind various graphical tools, which allow to analyze the market behavior, to the identified extremums.

To implement the first idea, the following has been made in the indicator.

Included multiple ZigZag algorithms.

Standard ZIGZAG algorithm. The basis of this algorithm is taken from the ZigZag that comes with the MetaTrader terminal.

  • ZIGZAG by Alex. Nickname on the forum is ANG...
  • ZIGZAG similar to one built into the Canadian Ensign program.
  • ZIGZAG developed by a programmer with the nickname tauber.
  • ZIGZAG corresponding to the Gann swings. The algorithm description is provided in the book by Hyerczyk.

Five DT-ZigZag modes. The DT-ZigZag name has been invented by a programmer with the nickname klot.

The main idea is to plot the zigzags on the current timeframe based on the data from the timeframes higher relative to the current one.

  • DT-ZigZag with the standard zigzag algorithm.
  • DT-ZigZag with the algorithm developed by klot.
  • DT-ZigZag with the algorithm developed by Candid.
  • DT-ZigZag based on fractal searching algorithm. In this particular case, the fractals have nothing to do with Benoit Mandelbrot. The name is taken from the corresponding indicator in the MetaTrader package.
  • DT-ZigZag with the Gann swings in the interpretation by Hyerczyk.
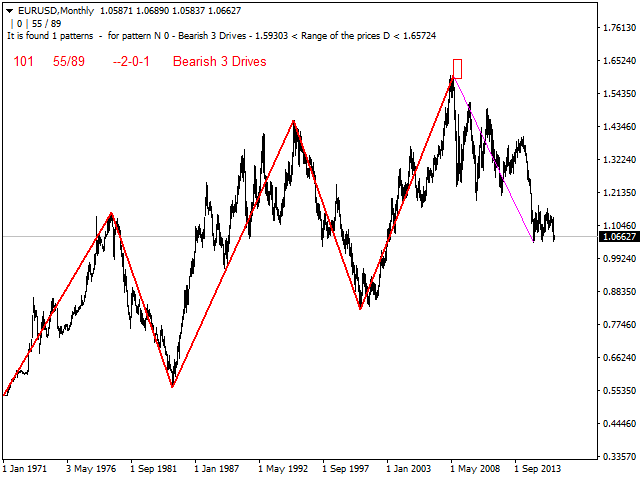
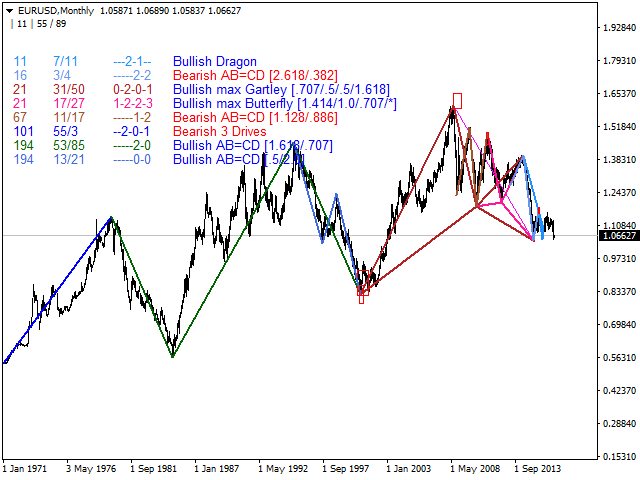
  • 7 different ZigZag algorithms in market scanning mode to search for patterns, codenamed Gartley Patterns.
  • ZIGZAG developed by a programmer with the nickname Talex.
  • SQZZ ZigZag, developed by a programmer with the nickname tovaroved (Alexander Shchukin).
  • ZZ_2L developed by a programmer with the nickname wellx.
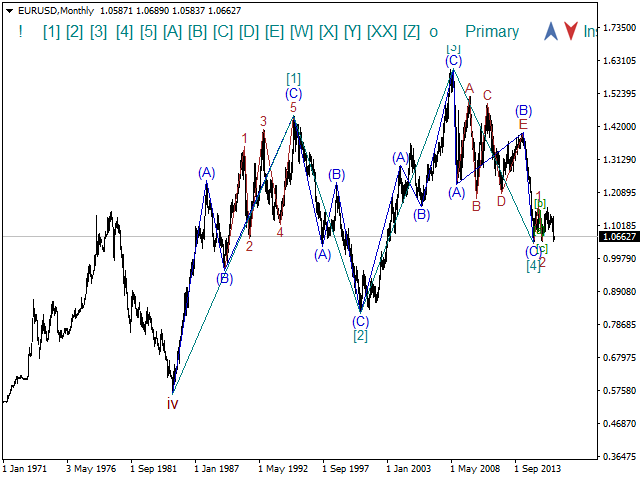
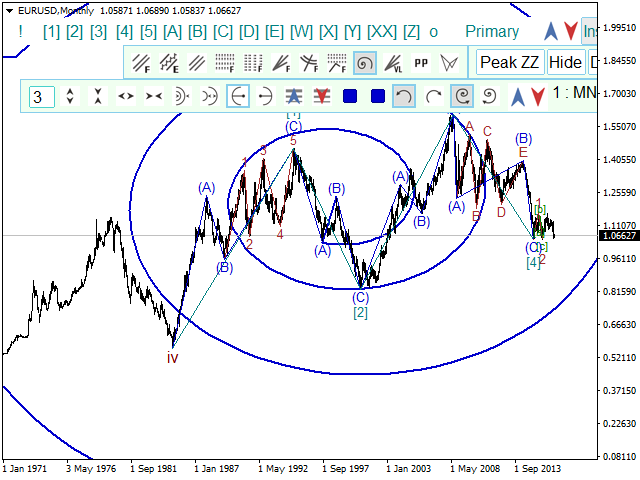
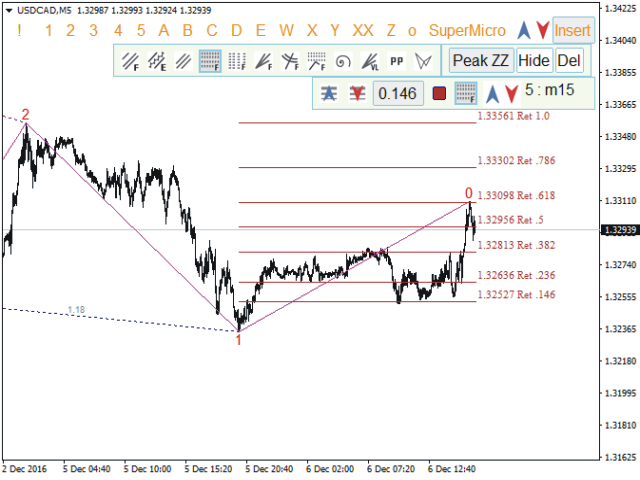
  • Wave ZigZag. This ZigZag allows to manually create a wave layout corresponding to the Elliott waves on 10 wave levels.

To implement the second idea, multiple graphical tools have been included in the indicator.

The indicator contains over 400 parameters in total.

All of the indicator parameters are divided into 16 groups to make navigation easier.

  1. Parameters for managing the built-in ZigZags
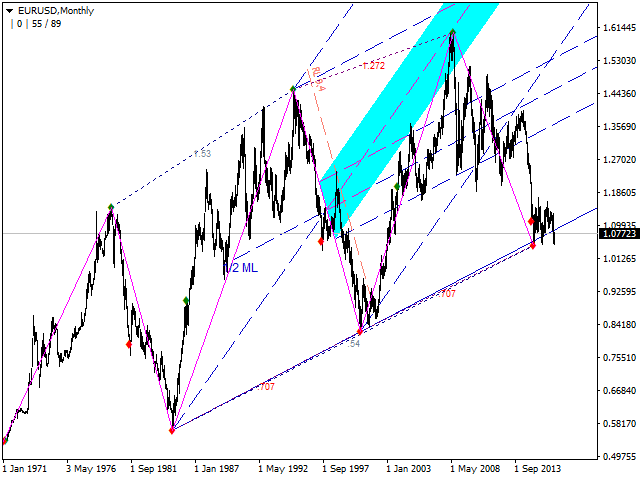
  2. Parameters for managing the Fibonacci levels
  3. Parameters for managing the Pesavento Patterns
  4. Parameters for managing the Gartley Patterns
  5. Parameters for managing the Andrews' Pitchfork
  6. Parameters for managing the micmed's channels
  7. Parameters for managing the Fibonacci fans
  8. Parameters for managing the Fibonacci extensions
  9. Parameters for managing the versum's levels
  10. Parameters for managing the Fibonacci arcs
  11. Parameters for managing the logarithmic spiral
  12. Parameters for managing the Pivot ZigZag
  13. Parameters for managing the channels
  14. Parameters for managing the Fibonacci time zones
  15. Additional Parameters
  16. General Parameters

It is also possible to manage the graphical tools using the mouse and the graphical interface.

In order to use the graphical interface, it is necessary to enable the parameter ExtPanel=true.

If the panel is deleted using the ESC key, it can be restored to the chart using the SHIFT-Z key combination.

The graphical tools drawn using the mouse are binded either to the ZigZag extremums or to the wave layout.

The graphical tools drawn using the parameters are only binded to the ZigZag extremums.

They cannot be binded to the wave layout.

By default, the use of the graphical interface is enabled. For the operation to be correct, it is necessary to use MetaTrader 4 build 1014 or higher.

For the automatic search for the Gartley patterns using the parameters, it is necessary to enable ExtIndicator = 11: search Patterns

For the automatic plotting of the Andrews’ Pitchfork using the parameters, it is necessary to enable

  • ExtPitchforkDynamic = 2
  • ExtPitchforkStatic = 2

The detailed description of all parameters and methods for working with the graphical interface takes up multiple articles.

The full list of parameters is provided in the comments. The attached file contains the brief description of the ZUP.

I express my gratitude to all who participated in the creation of the ZUP.

리뷰 20
Michele Manenti
672
Michele Manenti 2022.04.25 13:21 
 

Great and powerful analysis tool to predict the movements of a cross currency, after some difficulty I managed to understand and use it, it is not easy to approach but I assure that it is worth losing time and study the operation, you get very reliable and accurate results. Congratulations to the developer, we hope to see updates in the future. Thanks

Richard Shoemake
24
Richard Shoemake 2021.04.11 03:49 
 

I would expect it to work right out of the box. It doesnt seem to work unless you set some things up. I'm still trying to get around to going through your links to make sure it's set up correctly. So, far I give it at most a 3. I may revise it lower if I can't get it to work. - I've updated my rating to 5 stars because I got good support from you guys, and it's working as expected now. Thanks again!

Fawkes7k
84
Fawkes7k 2020.05.28 12:31 
 

Один из редчайших индикаторов который действительно стоит своих денег, а цена сильно занижена. Видна колоссальная и многолетняя работа по разработке улучшению оптимизации и поддержке данного индикатора. Автору огромный респект, он явно мастер своего дела.

추천 제품
TrendPlus
Sivakumar Subbaiya
4.38 (13)
Trend Plus   Trendplus  Indicator   Time Frame: Suitable for any time frame.  Purpose: Trend Prediction. Blue and red candle indicate the buy and sell call respectively. Buy: When the blue candle is formed buy call is initiated. close the buy trades when the next red candle will formed.   Sell: When the Red candle is formed Sell call is initiated. close the Sell trades when the next blue candle will formed.   Happy trade!!
FREE
Market Profile 3
Hussien Abdeltwab Hussien Ryad
4 (4)
Market Profile 3 MetaTrader 4 indicator  — is a classic Market Profile implementation that can show the price density over time, outlining the most important price levels, value area, and control value of a given trading session. This indicator can be attached to timeframes between M1 and D1 and will show the Market Profile for daily, weekly, monthly, or even intraday sessions. Lower timeframes offer higher precision. Higher timeframes are recommended for better visibility. It is also possible t
FREE
EZ Binary USJP Pair
Tuan Anh Dao
4 (2)
The indicator allows you to trade binary options. The recommended time frame is М1 and the expiration time is 1,2,3 minutes. The indicator suitable for auto and manual trading. A possible signal is specified as a arrows above/under a candle. You should wait until the candle closes! Arrows are not re-painted Trade sessions: TOKYO section (Half-end) Currency pairs: USD/JPY Working time frame: M1 Expiration time: 1,2,3 minutes. The indicator also shows good results when using the martingale strateg
FREE
Rainbow MT4
Jamal El Alama
Rainbow MT4 is a technical indicator based on Moving average with period 34 and very easy to use. When price crosses above MA and MA changes color to green, it’s a signal to buy. When price crosses below MA and MA changes color to red, it’s a signal to sell. The Expert advisor ( Rainbow EA MT4) based on Rainbow MT4 indicator, as you can see in the short video below is now available here .
FREE
Are you tired of drawing trendlines every time you're analyzing charts? Or perhaps you would like more consistency in your technical analysis. Then this is for you. This indicator will draw trend lines automatically when dropped on a chart. How it works Works similar to standard deviation channel found on mt4 and mt5. It has 2 parameters: 1. Starting Bar 2. Number of bars for calculation The   starting bar   is the bar which drawing of the trend lines will begin, while the   number of bars for c
FREE
Pin Bars
Yury Emeliyanov
주요 목적:"핀 바"는 금융 시장 차트에서 핀 바를 자동으로 감지하도록 설계되었습니다. 핀 바는 특징적인 몸체와 긴 꼬리를 가진 촛불로,추세 반전 또는 교정을 신호 할 수 있습니다. 작동 원리:표시기는 차트의 각 촛불을 분석하여 촛불의 몸,꼬리 및 코의 크기를 결정합니다. 미리 정의 된 매개 변수에 해당하는 핀 막대가 감지되면 표시기는 핀 막대의 방향(강세 또는 약세)에 따라 위 또는 아래 화살표로 차트에 표시합니다. 매개 변수: 꼬리의 길이와 핀 바의 몸체 크기 사이의 최소 비율을 정의합니다. "코"와 핀 바의 꼬리 사이의 최대 허용 비율을 설정합니다. 화살표 크기-표시된 핀 막대와 차트에서 핀 막대를 가리키는 화살표 사이의 거리를 정의합니다. 신청:"핀 바"표시기는 잠재적 인 추세 반전 지점을 식별하고 시장 또는 가까운 위치에 진입하기 위해 신호를 생성하는 데 사용할 수 있습니다. 올바르게 사용하고 다른 기술 지표 및 분석 방법과 결합하면이 지표는 거래 결과를 향상시킬
FREE
PZ Penta O MT4
PZ TRADING SLU
2.67 (3)
The Penta-O is a 6-point retracement harmonacci pattern which usually precedes big market movements. Penta-O patterns can expand and repaint quite a bit. To make things easier this indicator implements a twist: it waits for a donchian breakout in the right direction before signaling the trade. The end result is an otherwise repainting indicator with a very reliable trading signal. The donchian breakout period is entered as an input. [ Installation Guide | Update Guide | Troubleshooting | FAQ | A
FREE
New Bar Alarm Free
Tomoyuki Nakazima
This indicator alerts you when/before new 1 or 5 minute bar candle formed. In other words,this indicator alerts you every 1/5 minutes. This indicator is especially useful for traders who trade when new bars formed. *This indicator don't work propery in strategy tester.Use this in live trading to check functionality. There is more powerful Pro version .In Pro version,you can choose more timeframe and so on. Input Parameters Alert_Or_Sound =Sound ----- Choose alert or sound or both to not
FREE
Extremum Reverse Bar
Yurij Izyumov
3.55 (11)
This indicator has been created for finding the probable reversal points of the symbol price. A small candlestick reversal pattern is used it its operation in conjunction with a filter of extremums. The indicator is not redrawn! If the extremum filter is disabled, the indicator shows all points that have a pattern. If the extremum filter is enabled, the condition works – if the history Previous bars 1 candles back contains higher candles and they are farther than the Previous bars 2 candle, such
FREE
Pips forex
Andrey Kozak
Pips forex - is a ready trading system . This indicator shows with arrows on the chart when and in what direction you need to open an order. If the arrow is green, then we open a buy deal, and if the arrow is red, then we open a sell deal. Everything is very simple and quite effective. TakeProfit set 15-25 points. StopLoss set at the level of points. When the dots move, we immediately override the StopLoss. Recommended timeframe for trading M1 and M5. This is a scalping strategy and works best
MegaTrends
Sivakumar Subbaiya
1 (1)
Megatrends  Indicator   Time Frame: Suitable for any time frame.  Purpose: Trend Prediction. Blue and red color indicate the buy and sell call respectively. Buy: When the blue line is originating it is opened buy call. Sell: When the Red line is origination it is opened sell call Happy trade!! this indicator is suitable for all time frame, but our recommended time frame to use 1hour and 4 hours, suitable for any chart.
FREE
Super Auto Fibonacci
Muhammed Emin Ugur
Discover the power of precision and efficiency in your trading with the " Super Auto Fibonacci " MT4 indicator. This cutting-edge tool is meticulously designed to enhance your technical analysis, providing you with invaluable insights to make informed trading decisions. Key Features: Automated Fibonacci Analysis: Say goodbye to the hassle of manual Fibonacci retracement and extension drawing. "Super Auto Fibonacci" instantly identifies and plots Fibonacci levels on your MT4 chart, saving you tim
FREE
OrderBlock TS Roman
Vladislav Vlastovskii
4 (7)
Индикатор строит блоки заказов (БЗ) по торговой системе (ТС) Романа. Поиск блоков осуществляется одновременно на двух таймфремах: текущем и старшем (определяемым в настройках). Для оптимизации и игнорирования устаревших блоков в настройках задается ограничение количества дней в пределах которых осуществляется поиск блоков. Блоки строятся по правилам ТС состоящем из трех шагов: какую свечу вынесли (что?); какой свечой вынесли (чем?); правило отрисовки (как?).
FREE
This indicator scans for you up to 30 trading instruments and up to 8 timeframes for occurrences of the high probability reversal patterns: Double Tops/Bottoms with fake breakouts . Please read also the blog post " Professional Trading With Double Tops/Bottoms And Divergences! " which explains the concepts behind the ULTIMATE Double Top/Bottom indicator and how you can use a professional top-down approach. This FREE Version of the Scanner scans only EURUSD and GBPUSD. The full version of the sca
FREE
Toby Strategy Indicator
Ahmd Sbhy Mhmd Ahmd ʿYshh
The indicator rely on The Toby strategy >> The mother candle which is bigger in range than the previous six candles. A vertical line shows the last Toby Candle with the targets shown up and down. The strategy is about the closing price out of the range of the toby candle to reach the 3 targets..The most probable to be hit is target1 so ensure reserving your profits and managing your stop lose.
FREE
MASi Three Screens
Aleksey Terentev
5 (2)
MASi Three Screens is based on the trading strategy by Dr. Alexander Elder. This indicator is a collection of algorithms. Algorithms are based on the analysis of charts of several timeframes. You can apply any of the provided algorithms. List of versions of algorithms:     ThreeScreens v1.0 - A simple implementation, with analysis of the MACD line;     ThreeScreens v1.1 - A simple implementation, with analysis of the MACD histogram;     ThreeScreens v1.2 - Combines the first two algorithms
FREE
UPD1 X00 Levels
Vitaliy Kuznetsov
4.92 (12)
인디케이터는 차트의 라운드 레벨을 보여줍니다. 심리적, 뱅킹 또는 주요 플레이어 레벨이라고도 합니다. 이 수준에서 황소와 곰 사이에 실제 싸움이 있고 많은 주문이 누적되어 변동성이 증가합니다. 표시기는 모든 악기와 기간에 따라 자동으로 조정됩니다. 80레벨을 돌파하고 테스트를 하면 구매합니다. 20레벨 돌파 후 테스트 하면 판매합니다. 목표는 00입니다. 주목. 강력한 지원 및 저항 수준으로 인해 가격이 00 수준을 약간 놓칠 수 있습니다. 입력 매개변수. Bars Count - 라인 길이. Show 00 Levels - 00 레벨을 표시하거나 표시하지 않음. Show 10, 90 Levels. Show 20, 80 Levels. Show 30, 70 Levels. Show 40, 60 Levels. Show 50 Levels. N Lines - 차트의 레벨 수를 제한하는 매개변수. Distance 00 Levels - 레벨 사이의 거리(자동 또는 수동). Line Posi
FREE
Follow The Line
Oliver Gideon Amofa Appiah
4 (13)
FOLLOW THE LINE GET THE FULL VERSION HERE: https://www.mql5.com/en/market/product/36024 This indicator obeys the popular maxim that: "THE TREND IS YOUR FRIEND" It paints a GREEN line for BUY and also paints a RED line for SELL.  It gives alarms and alerts of all kinds. IT DOES NOT REPAINT and can be used for all currency pairs and timeframes. Yes, as easy and simple as that. Even a newbie can use it to make great and reliable trades. NB: For best results, get my other premium indicators for more
FREE
Wise Men Indicator demo
Bohdan Kasyanenko
3.67 (3)
The indicator displays signals according to the strategy of Bill Williams on the chart. Demo version of the indicator has the same features as the paid, except that it can work only on a demo account . Signal "First Wise Man" is formed when there is a divergent bar with angulation.  Bullish divergent bar - with lower minimum and closing price in the upper half. Bearish divergent bar - higher maximum and the closing price at the bottom half. Angulation is formed when all three lines of Alligat
FREE
Free automatic fibonacci
Tonny Obare
4.62 (58)
Free automatic Fibonacci is an indicator that automatically plots a Fibonacci retracement based on the number of bars you select on the BarsToScan setting in the indicator. The Fibonacci is automatically updated in real time as new highest and lowest values appears amongst the selected bars. You can select which level values to be displayed in the indicator settings. You can also select the color of the levels thus enabling the trader to be able to attach the indicator several times with differe
FREE
제우스 지표 소개: 귀하의 궁극적인 이윤 돌파 거래 도구. 이 지표는 폭발 전략과 심층 분석 필요성을 제거하여 거래를 단순화합니다. 귀하의 설정된 시간 프레임을 기반으로 자동으로 존을 그리고, 스탑 로스 (SL), 테이크 프로핏 (TP) 및 트레일링 스탑 수준을 제안합니다. 제우스 지표는 가격이 매수 또는 매도 진입점에 다가갈 때 즉각 알림을 제공하고 시그널 화살표를 표시합니다. 또한 네 가지 다른 테이크 프로핏 레벨과 다양한 트레일링 스탑 옵션을 권장합니다. 이 도구는 초보자와 숙련된 트레이더 모두에게 적합합니다. 채널 지원: [ 여기를 클릭 ](채널 지원 링크) 상점: 여기를 클릭하세요. MT5 버전: [ 여기를 클릭 ](MT5 버전 링크) 권장 사항: 시간 프레임: M5 또는 M15 통화 쌍: 모든 통화 쌍과 호환 가능 계정 유형: 모든 계정 유형과 호환 가능 권장 스탑 로스: 제우스 지표에서 제공하는 SL 제안 사용 권장 테이크 프로핏 레벨: 제우스 지표에서 제안하는 TP
"Turbo Helper for scalping" is a fully prepared trading system. It shows the trader with an arrow on the chart when to open an order and in which direction. It also indicates to the trader with a square symbol when to close the trade. After that, the indicator displays the estimated number of points for the trade on the chart. This value may vary slightly as the indicator does not take into account the actual spread size and swap of your broker. However, to calculate more accurately, you can spe
Fx BFP Pivot Points
Maged Ait Abbi
5 (5)
A forex   pivot point   strategy could very well be a trader’s best friend as far as identifying levels to develop a bias, place stops and identify potential profit targets for a trade. Pivot points have been a go-to for traders for decades. The basis of pivot points is such that price will often move relative to a previous limit, and unless an outside force causes the price to do so, price should stop near a prior extreme. Pivot point trading strategies vary which makes it a versatile tool for
FREE
The Day Scalping System
Anton Iudakov
3 (5)
Scalping indicator. It takes into account volatility, price movement in the local interval and the direction of the current trend. Recommended timeframe - M5. Advantages: Low volatility when a signal appears ensures minimal movement against an open position. The indicator does not redraw its signals. There are alert signals. It is a great tool for day trading. Settings: Name Description Period Indicator period Range of each bar in the period (pp.) The maximum size of each candle in the indicat
FREE
피봇 포인트 Fibo RSJ는 피보나치 비율을 사용하여 당일의 지지선과 저항선을 추적하는 지표입니다. 이 멋진 지표는 피보나치 비율을 사용하여 피벗 포인트를 통해 최대 7단계의 지지와 저항을 생성합니다. 가격이 작업의 가능한 진입/종료 지점을 인식할 수 있는 이 지원 및 저항의 각 수준을 어떻게 존중하는지 환상적입니다. 특징 최대 7단계 지원 및 7단계 저항 레벨의 색상을 개별적으로 설정 입력 피벗 유형 피벗 피보 RSJ1 = 피보 비율 1 계산 피벗 피보 RSJ2 = 피보 비율 2 계산 피벗 Fibo RSJ3 = Fibo 비율 3 계산 피벗 피보 클래식 = 클래식 피벗 계산 최소 피벗 수준 피벗 3 레벨 피벗 4 레벨 피벗 5 레벨 6단계 피벗 피벗 7 레벨 여전히 질문이 있는 경우 다이렉트 메시지로 저에게 연락하십시오: https://www.mql5.com/ko/users/robsjunqueira/
FREE
Cumulative Delta MT4
Evgeny Shevtsov
4.69 (35)
The indicator analyzes the volume scale and splits it into two components - seller volumes and buyer volumes, and also calculates the delta and cumulative delta. The indicator does not flicker or redraw, its calculation and plotting are performed fairly quickly, while using the data from the smaller (relative to the current) periods. The indicator operation modes can be switched using the Mode input variable: Buy - display only the buyer volumes. Sell - display only the seller volumes. BuySell -
FREE
Check my paid tools they work great and I share Ea's based on them for free please r ate The Dual Timeframe RSI (Relative Strength Index) indicator is a novel trading tool that allows traders to monitor RSI readings from two different timeframes on a single chart. This dual perspective enables traders to identify potential trend confirmations and divergences more effectively. For instance, a trader might use a 1-hour RSI alongside a daily RSI to ensure that short-term trades align with the bro
FREE
QualifiedEngulfing
Ashkan Hazegh Nikrou
QualifiedEngulfing - ProEngulfing 지표의 무료 버전입니다. ProEngulfing - Advance Engulf 지표의 유료 버전으로, 여기에서 다운로드할 수 있습니다. ProEngulfing 의 무료 버전과 유료 버전의 차이점은 무엇인가요? 무료 버전은 하루에 하나의 신호로 제한되어 있습니다. QualifiedEngulfing을 소개합니다 - MT4용 전문 Engulf 패턴 지표 QualifiedEngulfing을 사용하여 외환 시장에서 자격을 갖춘 Engulf 패턴을 식별하고 강조하는 혁신적인 지표로 정밀력의 힘을 발휘하세요. MetaTrader 4용으로 개발된 QualifiedEngulfing은 Engulf 패턴을 정확하게 인식하고 강조하기 위한 첨단 접근법을 제공하여 거래 결정에 대해 가장 신뢰할 수 있는 신호만을 제공합니다. QualifiedEngulfing 작동 방식: QualifiedEngulfing은 Engulf 패턴을 분석하기 위한 정교한
FREE
This indicator shows the latest untouched support and resistance as horizontal lines. The indicator can show support/resistance from higher timeframes. With this indicator you can e.g. easily see the support/resistance of the timeframes H4, D1 and W1 on a H1 chart, which can be a big advantage while time your entry on H1. This is the FREE version of the indicator: Support Resistance Multi Time Frame The free version works only on EURUSD and GBPUSD! Parameters referenceTF: the timeframe from wh
FREE
Boundaries
Sergio D. Rocha
This indicator plots a line that shows the high and low of a higher time frame than the one where you have actually in your chart. For example if you want to see the high and low of the day while you are in 1hour chart, set Boundaries to Daily. Boundaries have predefined Monthly, Weekly, Daily and Hourly time frames, but if you want to use a different timeframe, just choose the option Other_TF and write on the next field the minutes for your desired timeframe. As MT4 only works beyond M1 with 5,
이 제품의 구매자들이 또한 구매함
현재 20% 할인 ! 초보자 또는 전문가 트레이더를 위한 최고의 솔루션! 이 대시보드 소프트웨어는 28개의 통화 쌍에서 작동합니다. 2가지 주요 지표(Advanced Currency Strength 28 및 Advanced Currency Impulse)를 기반으로 합니다. 전체 Forex 시장에 대한 훌륭한 개요를 제공합니다. 고급 통화 강도 값, 통화 이동 속도 및 모든(9) 시간대의 28 Forex 쌍에 대한 신호를 보여줍니다. 추세 및/또는 스캘핑 기회를 정확히 파악하기 위해 차트의 단일 지표를 사용하여 전체 시장을 볼 수 있을 때 거래가 어떻게 개선될지 상상해 보십시오! 잠재적인 거래를 식별하고 확인하면서 강력한 통화와 약한 통화를 더욱 쉽게 식별할 수 있도록 이 지표에 기능을 내장했습니다. 이 표시기는 통화의 강세 또는 약세가 증가 또는 감소하는지 여부와 모든 시간대에서 수행되는 방식을 그래픽으로 보여줍니다. 추가된 새로운 기능은 현재 시장 조건 변화에 적
TrendMaestro
Stefano Frisetti
5 (2)
note: this indicator is for METATRADER4, if you want the version for METATRADER5 this is the link: TRENDMAESTRO recognizes a new TREND in the bud, he never makes mistakes. The certainty of identifying a new TREND is priceless. DESCRIPTION TRENDMAESTRO identifies a new TREND in the bud, this indicator examines the volatility, volumes and momentum to identify the moment in which there is an explosion of one or more of these data and therefore the moment in which prices have strong probability of f
TPSpro RFI Levels
Roman Podpora
5 (13)
Reversal First Impulse levels (RFI) - are the maximum volume levels/areas that turn the market around, so they play a critical role in future trading decisions. The logic behind the movement of any chart is that the price moves from the first impulse level (RFI) to the first impulse level (RFI) of the past trend. The first impulse level (RFI) is the most powerful level during a trend reversal, which forms a reversal zone. The first impulse level from the reversal of the previous movement is also
Quantum Trend Sniper Indicator MT4
Bogdan Ion Puscasu
4.57 (37)
소개       Quantum Trend Sniper Indicator는   추세 반전을 식별하고 거래하는 방식을 변화시키는 획기적인 MQL5 지표입니다! 13년 이상의 거래 경험을 가진 숙련된 트레이더 팀이 개발한       Quantum Trend Sniper 표시기       매우 높은 정확도로 추세 반전을 식별하는 혁신적인 방법으로 거래 여정을 새로운 차원으로 끌어올리도록 설계되었습니다. ***Quantum Trend Sniper Indicator를 구입하면 Quantum Breakout Indicator를 무료로 받을 수 있습니다!*** Quantum Trend Sniper Indicator는 추세 반전을 식별하고 세 가지 이익실현 수준을 제안할 때 경고, 신호 화살표를 제공합니다. 초보자 거래자와 전문 거래자 모두에게 적합합니다. Quantum EA 채널:       여기를 클릭하세요 MT5 버전:       여기를 클릭하세요
Advanced Currency Strength28 Indicator
Bernhard Schweigert
4.9 (660)
현재 26% 할인 초보자 또는 전문가 트레이더를 위한 최고의 솔루션! 이 지표는 우리가 독점 기능과 새로운 공식을 통합했기 때문에 독특하고 고품질이며 저렴한 거래 도구입니다. 단 하나의 차트로 28 Forex 쌍의 통화 강도를 읽을 수 있습니다! 새로운 추세 또는 스캘핑 기회의 정확한 트리거 포인트를 정확히 찾아낼 수 있기 때문에 거래가 어떻게 개선될지 상상해 보십시오. 사용 설명서: 여기를 클릭  https://www.mql5.com/en/blogs/post/697384 그것이 첫 번째, 원본입니다! 쓸모없는 지망생 클론을 사지 마십시오. 더 스페셜  강력한 통화 모멘텀을 보여주는 하위 창의 화살표 GAP가 거래를 안내합니다! 기본 또는 호가 통화가 과매도/과매도 영역(외부 시장 피보나치 수준)에 있을 때 개별 차트의 기본 창에 경고 표시가 나타납니다. 통화 강도가 외부 범위에서 떨어질 때 풀백/반전 경고. 교차 패턴의 특별 경고 추세를 빠르게 볼 수 있는
Atomic Analyst
Issam Kassas
5 (2)
First of all Its worth emphasizing here that this Trading Indicator is   Non-Repainting ,   Non-Redrawing   and   Non-Lagging   Indicator, Which makes it ideal from both manual and robot trading.  The Atomic Analyst  is a PA Price Action Indicator that uses Strength and Momentum of the price to find a better edge in the market. Equipped with Advanced filters which help remove noises and false signals, and Increase Trading Potential. Using Multiple layers of complex Indicators, the Atomic Anal
TPSproTREND PrO
Roman Podpora
5 (15)
TPSpro TRENDPRO  - is a trend indicator that automatically analyzes the market and provides information about the trend and each of its changes, as well as giving signals for entering trades without redrawing! The indicator uses each candle, analyzing them separately. referring to different impulses - up or down impulse. Exact entry points into transactions for currencies, crypto, metals, stocks, indices!  - To maximize the potential and learn how to trade using this indicator, read the full des
Quantum Breakout Indicator PRO
Bogdan Ion Puscasu
4.96 (25)
소개       Quantum Breakout PRO   , 브레이크아웃 존 거래 방식을 변화시키는 획기적인 MQL5 지표! 13년 이상의 거래 경험을 가진 숙련된 트레이더 팀이 개발한   Quantum Breakout PRO는   혁신적이고 역동적인 브레이크아웃 영역 전략으로 거래 여정을 새로운 차원으로 끌어올리도록 설계되었습니다. Quantum Breakout Indicator는 5개의 이익 목표 영역이 있는 브레이크아웃 영역의 신호 화살표와 브레이크아웃 상자를 기반으로 한 손절 제안을 제공합니다. 초보자 거래자와 전문 거래자 모두에게 적합합니다. Quantum EA 채널:       여기를 클릭하세요 MT5 버전 :   여기를 클릭하세요 중요한! 구매 후 설치 매뉴얼을 받으려면 개인 메시지를 보내주십시오. 추천: 기간: M15 통화쌍: GBPJPY, EURJPY, USDJPY,NZDUSD, XAUUSD 계정 유형: 스프레드가 매우 낮은 ECN, Ra
Gann Swing Structure
Kirill Borovskii
5 (1)
This indicator is based on the mathematics of the great trader W.D. Ganna. With its help, you can easily find strong levels by analyzing swings to find the optimal entry point. The indicator works on all instruments and all timeframes. The indicator is fully manual and has control buttons. All you need to do is press the NEW button, a segment will appear, which you can place on any movement, swing or even 1 candle that you want to analyze. By placing the segment, press the OK button. A grid (th
Weis Wave with Alert
Trade The Volume Waves Single Member P.C.
4.79 (19)
Rental/Lifetime Package Options and Privileges' * For optimum results the yearly or lifetime package is suggested due to live training and Discord  channel trading with the  creator! Rent Monthly Six Months   Yearly/Lifetime Weis Wave with Speed with Alert+Speed Index x x x Manual  x x x Quick Set up Video x x x Blog x x x Lifetime Updates x x x Setup and Training Material x x Free Rectangle Break Alert Tool      x Discord Access Channel "The SI traders" x 2-hour live methodology traini
Advanced Supply Demand
Bernhard Schweigert
4.92 (309)
현재 33% 할인! 초보자나 전문 트레이더를 위한 최고의 솔루션! 이 보조지표는 우리가 다수의 독창적 기능과 새로운 공식을 통합한 독특하고 고품질이며 저렴한 거래 도구입니다. 이 업데이트를 통해 이중 시간대를 표시할 수 있습니다. 더 높은 TF를 표시할 수 있을 뿐만 아니라 차트 TF와 더 높은 TF 모두를 표시할 수 있습니다: 중첩 영역 표시. 모든 Supply Demand 트레이더들이 좋아할 것입니다. :) 중요한 정보 공개 Advanced Supply Demand의 잠재력을 극대화하려면 다음을 방문하십시오. https://www.mql5.com/ko/blogs/post/720245   진입 또는 목표의 명확한 트리거 포인트를 정확히 찾아냄으로 해서 거래가 어떻게 개선될지 상상해 보십시오. 새로운 알고리즘을 기반으로 매수자와 매도자 간의 잠재적인 불균형을 훨씬 더 쉽게 분간할 수 있습니다. 왜냐하면 가장 강한 공급영역과 가장 강한 수요 영역과 과거에 어떻게 진행 되었는지를(이
Gann Price Level
Kirill Borovskii
The indicator is designed to work on any trading platform. The program is based on proprietary algorithms and W.D.Ganna's mathematics, allowing you to calculate target levels of price movement based on three points with the highest degree of certainty. It is a great tool for stock trading. The indicator has three buttons: NEW - call up a triangle for calculation. DEL - delete the selected triangle. DELS - completely remove all constructions. The probability of achieving the goals is more than 80
Scalper Inside PRO
Alexey Minkov
4.74 (54)
GET 10% OFF NOW! Last 2 copies at current price! An exclusive indicator that utilizes an innovative algorithm to swiftly and accurately determine the market trend. The indicator automatically calculates opening, closing, and profit levels, providing detailed trading statistics. With these features, you can choose the most appropriate trading instrument for the current market conditions. Additionally, you can easily integrate your own arrow indicators into Scalper Inside Pro to quickly evaluate t
FX Power MT4 NG
Daniel Stein
5 (7)
모닝 브리핑 여기 mql5 와 텔레그램에서 FX Power MT4 NG 는 오랫동안 인기 있는 통화 강도 측정기인 FX Power의 차세대 버전입니다. 이 차세대 강도 측정기는 무엇을 제공합니까? 기존 FX Power에서 좋아했던 모든 것 PLUS GOLD/XAU 강도 분석 더욱 정밀한 계산 결과 개별 구성 가능한 분석 기간 더 나은 성능을 위한 사용자 정의 가능한 계산 한도 특별 멀티더 많은 것을보고 싶은 사람들을위한 특별한 다중 인스턴스 설정 모든 차트에서 좋아하는 색상을위한 끝없는 그래픽 설정 수많은 알림 옵션, 중요한 것을 다시는 놓치지 않도록 Windows 11 및 macOS 스타일의 둥근 모서리가 있는 새로운 디자인 마법처럼 움직이는 인디케이터 패널 FX 파워 키 특징 모든 주요 통화의 완전한 강세 이력 모든 시간대에 걸친 통화 강세 이력 모든 브로커 및 차트에서 고유 계산 결과 100% 신뢰할 수있는 실시간100 % 신뢰할 수있는 실시간 계산-> 다시 칠하지 않음
How to use Pair Trading Station Pair Trading Station is recommended for H1 time frame and you can use it for any currency pairs. To generate buy and sell signal, follow few steps below to apply Pair Trading Station to your MetaTrader terminal. When you load Pair Trading Station on your chart, Pair Trading station will assess available historical data in your MetaTrader platforms for each currency pair. On your chart, the amount of historical data available will be displayed for each currency pai
Currency Strength Exotics
Bernhard Schweigert
4.88 (33)
현재 20% 할인! 초보자 또는 전문가 트레이더를 위한 최고의 솔루션! 이 표시기는 Exotic Pairs Commodities, Indexes 또는 Futures와 같은 기호에 대한 통화 강도를 표시하는 데 특화되어 있습니다. 금, 은, 석유, DAX, US30, MXN, TRY, CNH 등의 진정한 통화 강도를 보여주기 위해 9번째 줄에 모든 기호를 추가할 수 있습니다. 이것은 독특하고 고품질이며 저렴한 거래 도구입니다. 우리는 많은 독점 기능과 새로운 공식을 통합했습니다. 새로운 추세 또는 스캘핑 기회의 정확한 트리거 포인트를 정확히 찾아낼 수 있기 때문에 거래가 어떻게 개선될지 상상해 보십시오. 사용 설명서: 여기를 클릭 https://www.mql5.com/en/blogs/post/708876 모든 시간대에 작동합니다. TREND를 빠르게 확인할 수 있습니다! 새로운 기본 알고리즘을 기반으로 설계되어 잠재적인 거래를 더욱 쉽게 식별하고 확인할 수 있습니다.
Owl smart levels
Sergey Ermolov
4.62 (53)
MT5 버전  |   FAQ Owl Smart Levels Indicator 는   Bill Williams 의 고급 프랙탈, 시장의 올바른 파동 구조를 구축하는 Valable ZigZag, 정확한 진입 수준을 표시하는 피보나치 수준과 같은 인기 있는 시장 분석 도구를 포함하는 하나의 지표 내에서 완전한 거래 시스템입니다. 시장과 이익을 취하는 장소로. 전략에 대한 자세한 설명 표시기 작업에 대한 지침 고문-거래 올빼미 도우미의 조수 개인 사용자 채팅 ->구입 후 나에게 쓰기,나는 개인 채팅에 당신을 추가하고 거기에 모든 보너스를 다운로드 할 수 있습니다 힘은 단순함에 있습니다! Owl Smart Levels   거래 시스템은 사용하기 매우 쉽기 때문에 전문가와 이제 막 시장을 연구하고 스스로 거래 전략을 선택하기 시작한 사람들 모두에게 적합합니다. 전략 및 지표에는 눈에 보이지 않는 비밀 공식 및 계산 방법이 없으며 모든 전략 지표는 공개되어 있습니다. Owl Smart Lev
TPA True Price Action indicator reveals the true price action of the market makers through 100% non-repainting signals (except early signals mode) strictly at the close of a candle! TPA shows entries and re-entries, every time the bulls are definitely stronger than the bears and vice versa. Not to confuse with red/green candles. The shift of power gets confirmed at the earliest stage and is ONE exit strategy of several. There are available now two free parts of the TPA User Guide for our custo
GOLD Impulse with Alert
Bernhard Schweigert
4.56 (9)
이 지표는 Advanced Currency IMPULSE with ALERT  +   Currency Strength Exotics  의 2가지 제품의 슈퍼 조합입니다. 그것은 모든 시간 프레임에 대해 작동하며 8개의 주요 통화와 하나의 기호에 대한 강약의 충동을 그래픽으로 보여줍니다! 이 표시기는 금, 이국적인 쌍, 상품, 지수 또는 선물과 같은 기호에 대한 통화 강도 가속을 표시하는 데 특화되어 있습니다. 금, 은, 오일, DAX, US30, MXN, TRY, CNH 등의 진정한 통화 강도 가속(충동 또는 속도)을 표시하기 위해 9번째 줄에 모든 기호를 추가할 수 있습니다. 새로운 기본 알고리즘을 기반으로 구축되어 잠재적인 거래를 훨씬 더 쉽게 식별하고 확인할 수 있습니다. 이는 통화의 강세 또는 약세가 가속되는지 여부를 그래픽으로 표시하고 가속 속도를 측정하기 때문입니다. 자동차의 속도계처럼 생각하면 됩니다. 가속화할 때 Forex 시장에서 동일한 일이 분명히
주기적인 상승 또는 하락 매매추세를 소, 중, 대 측면에서 분석하는 우수한 기술지표 시스템입니다. 파라미터의 period1은 작은 기간, period2는 중간 기간, period3은 큰 기간이며 small_symbol은 1번 신호의 식별자, middle_symbol은 2번 신호의 식별자, big_symbol은 식별자이다. 신호 3번의 ;alert는 경고 버튼의 스위치, Mail은 이메일을 보내는 스위치, Notification은 인스턴트 메시지를 보내는 스위치입니다. 이 지표 세트는 다양한 전략을 통합하고 다양한 밴드에서 구매 및 판매 신호를 제공합니다. 신호 1번은 초단기 투기 거래에 사용할 수 있는 가장 작은 대역 신호이고, 신호 2번은 중간 대역 신호로 1시간 신호 거래에 사용할 수 있으며, 신호 3번은 추세를 보는 데 사용할 수 있는 주요 추세 신호. 거래할 때: 먼저 3번 신호의 추세를 확인한 다음 2번 또는 1번에서 제공하는 신호를 기준으로 주문합니다.
Quantum Heiken Ashi PRO MT4
Bogdan Ion Puscasu
4.43 (7)
소개       Quantum Heiken Ashi PRO   차트 시장 동향에 대한 명확한 통찰력을 제공하도록 설계된 Heiken Ashi 양초는 노이즈를 필터링하고 잘못된 신호를 제거하는 기능으로 유명합니다. 혼란스러운 가격 변동에 작별을 고하고 더 매끄럽고 신뢰할 수 있는 차트 표현을 만나보세요. Quantum Heiken Ashi PRO를 정말 독특하게 만드는 것은 전통적인 촛대 데이터를 읽기 쉬운 색상 막대로 변환하는 혁신적인 공식입니다. 빨간색과 녹색 막대는 각각 약세와 강세 추세를 우아하게 강조하여 잠재적 진입점과 퇴장점을 매우 정확하게 파악할 수 있습니다. Quantum EA 채널:       여기를 클릭하세요 MT5 버전:       여기를 클릭하세요 이 놀라운 지표는 다음과 같은 몇 가지 주요 이점을 제공합니다. 선명도 향상: Heiken Ashi 바는 가격 변동을 완화하여 시장 추세를 보다 명확하게 나타내므로 유리한 거래 기회를 쉽게 식별할 수 있
THISE INDICATOR NOT WORK ON FREE DEMO. there is a protocol to work it. target finder indicator is a forecast the find probably targets.up and down. to use thise indicator, there is a protocol,i explain below. first load indicator  you will see blue and red lines. on the left side look to the higher value of line ,and draw horizantal line on top it. and on the right side see the LEVEL NUMBER. Finding UP TARGET h=put that level number  m=1 b=1 pres ok. you will see on the screen ,on top right ,r
Thise indicator is up down v6  comes with tradingwiev version. purchased people contact me on mql5 to get BONUS  TradingView version. up-down indicator is no repaint and works all pairs and lower than weekly time frames charts. it is suitable also 1 m charts for all pairs. and hold long way to signal. dont gives too many signals. when red histogram cross trigger line that is up signal.and price probably will down when blue histogram cross trigger line that is down signal.and price probably wil
Step into the realm of Forex trading with confidence and precision using XQ, a cutting-edge Forex indicator designed to elevate your trading game to unprecedented heights. Whether you're a seasoned trader or just stepping into the world of currency exchange,   XQ Forex Indicator   empowers you with the insights and signals needed to make informed trading decisions. The signal conditions are a combination of three indicators, and XQ Forex Indicator only display  medium and long-term trends . The
This is a trend indicator that automatically analyzes the market and provides information about the trend and each of its changes. As well as giving signals for entering trades without redrawing after finished drawing previous candle! I use Rangebar candles in my stategies (important) I created several strategies based on this indicator. You will also create on your trading The indicator uses each candle, analyzing them separately. Referring to different impulses - up or down impulse.
TakePropips Donchian Trend Pro
Eric John Pajarillaga Aldana
4.81 (16)
TakePropips Donchian Trend Pro   (MT4)는 Donchian 채널을 사용하여 추세의 방향을 자동으로 감지하고 진입 및 퇴장 거래 신호를 제공하는 강력하고 효과적인 도구입니다! 이 다기능 지표에는 추세 스캐너, 거래 신호, 통계 패널, 스크리너, 거래 세션 및 경고 내역 대시보드가 포함됩니다. 거래 신호를 제공하고 차트 분석 시간을 절약하도록 설계되었습니다! 다음 블로그 게시물에서 사용자 설명서 및 설치 가이드를 다운로드할 수 있습니다.   https://www.mql5.com/en/blogs/post/751368 오늘 50% 할인을 받으세요! 가격이 $98에서 $49로 인하되었습니다! 전략 테스터에서 이 지표를 테스트할 수 있습니다(비주얼 모드 활성화). 실시간 차트에서 테스트하고 싶다면 저에게 메시지를 보내 7일 평가판을 받을 수도 있습니다. 자세한 내용은 설명 아래에 비디오 자습서도 제공됩니다. 질문이 있거나 도움이 필요하면 저에게 연락하십시오.
All in One Trade
Alexey Minkov
4.48 (27)
GET 10% OFF NOW! The All-in-One Trade Indicator (AOTI) determines daily targets for EURUSD, EURJPY, GBPUSD, USDCHF, EURGBP, EURCAD, EURAUD, AUDJPY, GBPAUD, GBPCAD, GBPCHF, GBPJPY, AUDUSD, and USDJPY. All other modules work with any trading instruments. The indicator includes various features, such as Double Channel trend direction, Price channel, MA Bands, Fibo levels, Climax Bar detection, and others. The AOTI indicator is based on several trading strategies, and created to simplify market anal
Gold ATR MTF 4
Sergei Linskii
5 (1)
Gold ATR MTF   - 이것은 훌륭한 주식 기술 지표입니다. ATR(Average True Range) 지표의 알고리즘은 자산 가격의 움직임을 분석하고 지정된 기간(D1) 시가의 지정된 백분율(%)로 해당 수준을 그려 변동성을 반영합니다. 기호 가격 이동 방향의 표시기(빨간색 및/또는 파란색 D1 H4)와 화살표 신호는 편안하고 수익성 있는 일중 거래 및/또는 스캘핑을 위한 추가적이고 필수적인 보조 도구입니다. 일일 이익은 외환 기호의 경우 20핍, 금 기호의 경우 50핍부터 가능합니다. 표시기 기능: 이것은 편안하고 수익성 있는 거래를 위한 매직, 추세 방향 탐지기 및 두 개의 추세 화살표 블록을 갖춘 슈퍼 지표입니다. 블록 전환을 위한 빨간색 버튼이 차트에 표시됩니다. 매직은 표시기 설정에서 설정되므로 서로 다른 블록을 표시하는 두 개의 차트에 표시기를 설치할 수 있습니다. Gold ATR MTF는 서로 다른 화살표 버퍼(FP 및 SA)를 사용하여 두 개의 차
Shepherd Harmonic Pattern
Abdullah Alrai
4.68 (59)
이 지표는 수동 및 자동 방법으로 차트에 그려진 고조파 패턴을 감지합니다. 사용자 매뉴얼은 다음 링크에서 확인할 수 있습니다. 리뷰를 작성하고 문의하면 무료 버전으로 MT4에서 제품을 시도할 수 있습니다. Gartley 및 Nenstar 패턴을 감지하는 데 사용할 수 있습니다. https://www.mql5.com/en/market/product/30181 전체 MT4 버전을 구입하려면 다음에서 구입할 수 있습니다. https://www.mql5.com/en/market/product/15212 참고 사항 지표에는 제어 패널이 있으며 모든 (차트 및 시간대) 설정을 저장합니다. 차트에서 더 많은 공간을 확보하려면 최소화할 수 있으며, 다른 분석 도구로 작업하는 것이 선호되는 경우 모든 지표 데이터를 숨기려면 닫기 버튼을 누를 수 있습니다. 이 지표를 사용하고 설정을 변경하면 이동 평균 또는 볼린저 밴드와 같은 지표를 추가하면 자동으로 템플릿을 저장하고 필요할 때 언제든지 로드할 수
Gann Time Forecast
Kirill Borovskii
This indicator is based on the work of legendary trader William Gann, specifically using mathematical models and data from past days. It calculates potential time for a reversal based on selected parameters for the current day. The time is displayed in the future, at the opening of the day and does not change thereafter. The indicator also includes alerts when potential reversal time approaches. An algorithm for possible price movement is built into the indicator. When the time comes, an alert i
필터:
allexflame4848
19
allexflame4848 2022.11.07 13:29 
 

Отличная работа ..Пожалуй самая лучшая работа , которую я встречал по тех.анализу .Работает отлично ..Спасибо автору

Leoarab
33
Leoarab 2022.09.19 21:58 
 

need alot of help to understand it. i guess template also would be helpful to have it clear.a help would be appreciated.

Michele Manenti
672
Michele Manenti 2022.04.25 13:21 
 

Great and powerful analysis tool to predict the movements of a cross currency, after some difficulty I managed to understand and use it, it is not easy to approach but I assure that it is worth losing time and study the operation, you get very reliable and accurate results. Congratulations to the developer, we hope to see updates in the future. Thanks

Richard Shoemake
24
Richard Shoemake 2021.04.11 03:49 
 

I would expect it to work right out of the box. It doesnt seem to work unless you set some things up. I'm still trying to get around to going through your links to make sure it's set up correctly. So, far I give it at most a 3. I may revise it lower if I can't get it to work. - I've updated my rating to 5 stars because I got good support from you guys, and it's working as expected now. Thanks again!

Eugeni Neumoin
6250
개발자의 답변 Eugeni Neumoin 2021.04.20 08:54
Write what you need to configure. Everyone using ZUP has different requests. If you set it up for all requests, then the graph will contain a lot of unnecessary information. For example, I use Andrews' pitchfork, fibo levels, Pesavento patterns, channels. Sometimes I create wave counting. I don't use Gartley pattern search. Write what interests you.
=============
In a simplified form, to enable the search for Gartley patterns on the graphical interface panel, press the Insert - ZZ- 11 buttons. For better understanding -
you can read articles https://www.mql5.com/en/articles/2966 https://www.mql5.com/en/articles/2990
But after the release of the second article, there were some changes in the interface. Instead of the Select button, the Default button and the "Choice and creation of 5 dot patterns" button appeared And you can read about it in Russian https://www.mql5.com/ru/articles/6363 Also, more than 10 years ago, two articles were published for working with ZUP without a graphical interface.
https://www.mql5.com/en/articles/1468
https://www.mql5.com/en/articles/1470
faithdefender
1666
faithdefender 2021.01.09 20:56 
 

사용자가 평가에 대한 코멘트를 남기지 않았습니다

Andrey Belchenko
63
Andrey Belchenko 2020.06.04 15:34 
 

Отличный индикатор, Евгений. Было бы здорово еще на него поставить Алерт (Push-сообщение, чтобы получать на смартфон) при торговле "ExtIndicator = 11: search Patterns", с установками по тайм-фреймам)

Eugeni Neumoin
6250
개발자의 답변 Eugeni Neumoin 2021.04.28 20:21
Это давно сделано.
Fawkes7k
84
Fawkes7k 2020.05.28 12:31 
 

Один из редчайших индикаторов который действительно стоит своих денег, а цена сильно занижена. Видна колоссальная и многолетняя работа по разработке улучшению оптимизации и поддержке данного индикатора. Автору огромный респект, он явно мастер своего дела.

Profit_Trader
88
Profit_Trader 2020.03.13 20:04 
 

The system in complicated but it works! Thank you!

Heiner G.
370
Heiner G. 2020.02.14 19:56 
 

사용자가 평가에 대한 코멘트를 남기지 않았습니다

Jebs siptungkha
836
Jebs siptungkha 2019.08.22 12:44 
 

사용자가 평가에 대한 코멘트를 남기지 않았습니다

Christoph Michael Hoelzel
128
Christoph Michael Hoelzel 2019.05.02 17:29 
 

This is a very fine program if you know how to use it. The extensive variation of the ZigZag parameters come in handy especially if you play around with the Fibonacci tools. And the included pattern searching tools for the harmonics are nicely done. For this price you get a well done and powerful tool.

Peter
1087
Peter 2019.04.18 07:49 
 

Still learning about this excellent tool and great support.

[삭제] 2019.04.16 11:54 
 

사용자가 평가에 대한 코멘트를 남기지 않았습니다

Barour Bilal
2466
Barour Bilal 2019.04.08 14:16 
 

사용자가 평가에 대한 코멘트를 남기지 않았습니다

Aravind Kolanupaka
8780
Aravind Kolanupaka 2019.04.08 12:36 
 

사용자가 평가에 대한 코멘트를 남기지 않았습니다

xusim
34
xusim 2019.01.01 11:55 
 

Excellent !!!

Shaheen Hassanali
6551
Shaheen Hassanali 2018.12.02 15:35 
 

사용자가 평가에 대한 코멘트를 남기지 않았습니다

[삭제] 2018.11.25 21:13 
 

사용자가 평가에 대한 코멘트를 남기지 않았습니다

ismail Öztürk
244
ismail Öztürk 2018.11.18 20:55 
 

사용자가 평가에 대한 코멘트를 남기지 않았습니다

TipMyPip
2644
TipMyPip 2018.09.15 17:04 
 

사용자가 평가에 대한 코멘트를 남기지 않았습니다

12
리뷰 답변
버전 154.20 2024.02.19
Исправлен вывод small menu при редактировании параметров вил Эндрюса
버전 154.19 2024.02.16
Исправлен вывод small menu при задании параметров вил Эндрюса.
버전 154.18 2023.07.22
В некоторых случаях при создании графического объекта через графический интерфейс объект не создается.
Во вкладке Эксперты в данном случае будет выводиться сообщение: "Unable to create object. Choose another anchor point." - Невозможно создать объект. Выберите другую точку привязки.
버전 154.17 2023.07.21
Исправлена ошибка, связанная с пропуском котировок.
버전 154.16 2023.07.21
Исправил вывод цвета линий UWL и LWL в вилах Эндрюса.
버전 154.15 2023.06.29
Исправлен вывод графических объектов при ExtIndicator = 15
버전 154.14 2023.06.29
Исправлен вывод графических объектов при ExtIndicator = 15
버전 154.13 2023.02.03
Исправил в мониторе паттернов цвет надписей с названиями паттернов. Цвет надписей стал соответствовать цвету паттернов на графике.
버전 154.12 2022.11.23
Исправлена "работа" параметров ExtFractal и ExtFractalEnd.
Сделал по умолчанию вывод следующих графических объектов:
паттерны Песавенто, поиск паттернов Gartley, динамических и статических уровней Фибоначчи, динамических и статических комплектов вил Эндрюса.
Для отключения перечисленных графических инструментов необходимо устновить параметры со следующими значениями:
ExtHidden=0
ExtIndicator=0
ExtFiboDynamic=false
ExtFiboStatic=false
ExtPitchforkDynamic=0
ExtPitchforkStatic=0
버전 154.11 2022.11.23
Исправлена "работа" параметров ExtFractal и ExtFractalEnd.
Сделал по умолчанию вывод следующих графических объектов:
паттерны Песавенто, поиск паттернов Gartley, динамических и статических уровней Фибоначчи, динамических и статических комплектов вил Эндрюса.
Для отключения перечисленных графических инструментов необходимо устновить параметры со следующими значениями:
ExtHidden=0
ExtIndicator=0
ExtFiboDynamic=false
ExtFiboStatic=false
ExtPitchforkDynamic=0
ExtPitchforkStatic=0
버전 154.10 2022.11.23
Исправлена "работа" параметров ExtFractal и ExtFractalEnd.
Сделал по умолчанию вывод следующих графических объектов:
паттерны Песавенто, поиск паттернов Gartley, динамических и статических уровней Фибоначчи, динамических и статических комплектов вил Эндрюса.
Для отключения перечисленных графических инструментов необходимо устновить параметры со следующими значениями:
ExtHidden=0
ExtIndicator=0
ExtFiboDynamic=false
ExtFiboStatic=false
ExtPitchforkDynamic=0
ExtPitchforkStatic=0
버전 154.9 2022.11.11
Удален код преобразования базы данных из первых верси ZUP с графическим интерфейсом в более поздние версии. Как устаревший.
Испрравлено выделение символов волновой разметки на графике для перемещения символа или удаления символа. При нажатии клавиши CTRL и левой кнопки мыши на символе волны.
Исправлена работа с комбинацией клавиш SHIFT-S.
버전 154.7 2022.05.29
В данной версии корректируются параметры линий реакции динамических и статических вил Эндрюса, которые были неверно преобразованы после версии 154.3
버전 154.6 2022.05.28
Исправлена ошибка преобразования значения линий реакции динамических вил Эндрюса при переходе с версии 154.3 на последующие версии.
버전 154.5 2022.05.07
Исправлена ошибка расчета красной зоны в вилах Эндрюса.
버전 154.4 2022.02.06
Исправлены ошибки.
버전 154.3 2021.07.07
Сделаны небольшие изменения, улучшающие работу программы.
버전 154.2 2021.06.11
Проведена небольшая оптимизация. Исправлены ошибки.
버전 154.1 2021.06.10
Исправлены ошибки.
버전 154.0 2021.06.08
Изменен формат хранения графических объектов в файлах в папке //MQL4/Files/ZUP/Objects/
Это сделано для привязки цвета объектов к цвету волнового уровня, если объект был создан с привязкой к вершинам какого-либо волнового уровня. Но если в дальнейшем цвет объекта будет изменен вручную, то произойдет отвязка цвета объекта от волнового уровня.

Также изменена структура хранения параметров в файлах.

В пункты меню Default графических инструментов добавлена возможность корректировки параметров зигзага ExtIndicator=0.

Добавлен параметр FiboFan для включения вывода произвольных фибо вееров. Ранее включение данного графического инструмента осуществлялось изменением цвета.
Аналогичные параметры добавлены для Versum level - VLStatic и VLDynamic.

Появилась возможность вывода на один график до 10 экземпляров ZUP. При этом все 10 индикаторов можно настраивать с помощью графического интерфейса.
Каким образом это делается.
Важно - все экземпляры ZUP должны иметь уникальные номера параметра ExtSet. Этот параметр для удобства настройки переведен в начало списка параметров индикатора. При выводе второго и последующих экземпляров индикатора необходимо задать уникальное значение данного параметра.
Первому экземпляру будет присвоен номер панели графического интерфейса 0.
Второму и последующим экземплярам от 1 до 9. Но не рекомендуется устанавливать большое количество эземпляров. Это повышает нагрузку на процессор компьютера. Лучше обходиться одним экземпляром.

Каким образом производится переключение графических панелей между экземлярами.
Это производится с помощью комбинации клавиш SHIFT - 0, SHIFT - 1 и так далее вторая клавиша соответствует номеру графической панели.

Как узнать, какой экземпляр индикатора подключен к графической панели.
В левом верхнем углу окна с графиком на графической панели выведена кнопка в виде восклицательного знака.
При наведении курсору мыши на данную кнопку во всплывающей подсказке номер окна с графиком, номер графической панели и значение параметра ExtSet.
Номер окна с графиком заносится в названия файлов, которые ZUP создает в данном окне с графиком.

Также эти три параметра выводятся в меню Common в конце списка. То есть внизу четвертой колонки параметров данного меню.

Исправлены замеченные ошибки. Например, ошибка возникавшие при создании волновой разметки. И другие.
버전 153.60 2021.02.13
Добавлена возможность включения/выключения <small menu> с помощью сочетания клавиш SHIFT-S.
Внесены изменения при выборе канала ExtTypeChannals=3
버전 153.59 2020.08.08
Немного доработан алгоритм вывода канала при ExtTypeChannels=3
버전 153.58 2020.07.16
Для стандартного зигзага (ExtIndicator=0) в меню Default равноудаленных каналов добавлена возможность редактирования параметров зигзага также как в меню Default вил Эндрюса. Это позволяет быстро выявить структуру движений рынка.
버전 153.57 2020.07.15
Исправлена работа каналов в динамическом режиме.
버전 153.56 2020.07.09
Исправлена ошибка.
버전 153.55 2020.07.07
Исправлена ошибка.
버전 153.53 2020.07.04
Добавлены еще два вида каналов.
При ExtTypeChannels=3 формируется такой же канал как и при ExtTypeChannels=2, но на трех лучах зигзага.
При ExtTypeChannels=4 можно выводить на первых 10 лучах зигзага такой же канал, как при создании канала путем привязки к экстремумам зигзага или к волновой разметке с помощью графического интерфейса. Но без жесткой привязки.

Исправлены ошибки.
버전 153.52 2020.07.04
Добавлены еще два вида каналов.
При ExtTypeChannels=3 формируется такое же канал, но на трех лучах зигзага.
При ExtTypeChannels=4 можно выводить на первых 10 лучах зигзага такой же канал, как при создании канала путем привязки к экстремумам зигзага или к волновой разметке с помощью графического интерфейса. Но без жесткой привязки.
버전 153.51 2020.06.25
Исправил равноудаленные каналы.
버전 153.49 2020.05.26
Исправлен алгоритм расширенного режима.
버전 153.48 2020.05.14
Исправлен вывод каналов. Два вида каналов были включены в ZUP примерно в 2007 году. Трендовый канал ранее выводился на график иногда с ошибками.
Доработан алгоритм расширенного режима для графических инструментов, привязываемых к двум точкам.
버전 153.47 2020.04.27
Исправил задание расчета зигзага через графический интерфейс при значении ExtMaxBar=0.
При данном значении зигзаг рассчитывается на всей доступной истории.
버전 153.46 2020.04.12
Исправил вывод статических вил при значении ExtPitchforkStatic=3
버전 153.45 2020.04.04
Исправил вывод ценовых меток в вилах Эндрюса, созданных с помощью графического интерфейса.
버전 153.44 2020.04.04
Исправил вывод ценовых меток в вилах Эндрюса, созданных с помощью графического интерфейса.
버전 153.43 2020.02.11
В маленькое меню Default корректировки параметров вил Эндрюса в режиме поиска паттернов (ExtIndicator=11 и AlgorithmSearchPatterns=0) добавлены параметры настройки зигзагов: ParametresZZforDMLEWA, minBars и ExtBackstep.
버전 153.42 2020.02.11
В маленькое меню Default корректировки параметров вил Эндрюса в режиме поиска паттернов (ExtIndicator=11) добавлены параметры настройки зигзагов: ParametresZZforDMLEWA, minBars и ExtBackstep.
버전 153.41 2019.08.26
Исправил вывод паттернов
버전 153.40 2019.08.22
Изменил вывод паттернов Gartley
버전 153.39 2019.08.22
Добавлена в меню Common всплывающая подсказка с номером фибо уровня в поле редактирования параметра ExtFiboTypeFree
버전 153.38 2019.08.21
Восстановил рамку потенциальной разворотной зоны паттернов Gartley
버전 153.37 2019.08.21
Исправлена прорисовка паттернов Gartley
버전 153.36 2019.08.20
Исправлено вывод фибо уровней.
Добавлено значение параметра ParametresZZforDMLEWA=9
버전 153.35 2019.08.19
Исправлена в меню Common корректировка параметра ExtFiboTypeFree
버전 153.34 2019.08.14
Исправлен вывод динамических патттернов Песавенто.
버전 153.33 2019.08.01
Внесены небольшие исправления
버전 153.32 2019.07.22
Внесены небольшие исправления.
버전 153.30 2019.07.06
Если значение параметра Save Parameters в меню Common равно 0 или 1, изменение любых параметров вызывает изменение соответствующих параметров ZUP на всех связанных графиках.
버전 153.29 2019.07.06
Исправил логику работы с параметром Save Parameters в меню Common.
버전 153.28 2019.06.18
Исправлен вывод на график паттернов Песавенто.
버전 153.27 2019.06.13
Оптимизировал вывод на график паттернов Песавенто.
버전 153.26 2019.06.13
Исправлен вывод паттернов Песавенто.
버전 153.25 2019.06.12
Внесены исправления по замечаниям пользователей.
버전 153.24 2019.06.10
Исправил работу редактора паттернов.
버전 153.23 2019.06.10
В меню Common графического интерфейса добавлены кнопки для редактирования параметров изменения стиля вывода зигзагов: ExtStyleZZ, ExtColorZigzag, ExtWidthZigzag, ExtStyleZigzag.
Откорректирован инамический вывод паттернов Песавенто.
버전 153.22 2019.06.07
Сделаны небольшие исправления.
버전 153.21 2019.06.01
Откорректировал редактирование параметра GrossPeriod в маленьком меню Default для вил Эндрюса.
버전 153.20 2019.05.31
Откорректирована работа динамических графических инструментов.
Исправлена работа ZUP при отключенном графическом интерфейсе.
버전 153.19 2019.05.23
Исправлены ошибки
버전 153.18 2019.05.15
Исправлена логика работы параметра maxBarToD
버전 153.17 2019.05.14
Исправил вывод на график графического инструмента Versum level
버전 153.16 2019.05.08
Исправил логику работы программы с параметром ExtIndicator
버전 153.15 2019.05.05
Исправлена ошибка.
버전 153.14 2019.05.05
Исправлены граничные значения параметров.
버전 153.13 2019.05.04
Исправлены ошибки.
버전 153.12 2019.04.27
Добавил всплывающие подсказки для зависимых кнопок редактирования параметров.
Например, с помощью кнопки minBars для ExtIndicator=0 можно редактировать параметр minBars только когда параметр ParametresZZforDMLEWA=0.
При наведении на число в кнопке minBars во всплывающей подсказке выводится значение параметра ParametresZZforDMLEWA, при котором можно редактировать параметр minBars.

Некоторые зависимые параметры могут выводиться в меню Default только после того, как параметр от которого они зависят примет допустимое значение.
버전 153.11 2019.04.23
Сделаны небольшие исправления.
버전 153.10 2019.04.18
Исправил работу с поверхностью создания паттернов.
버전 153.9 2019.04.16
Сделаны небольшие изменения при работе с поверхностью создания паттернов.
버전 153.8 2019.04.15
Добавлен вывод монитора паттернов совместно с панелями графического интерфейса.
Включается в меню Default для паттернов Gartley кнопкой MonitorPatterns. По умолчанию включен.

Добавлены всплывающие подсказки к некоторым кнопкам меню.
У кнопки ZZ во всплывающей подсказке выводится текущее значение ExtIndicator.
У кнопки ! в левом верхнем углу во всплывающей подсказке выводится номер окна с графиком. Например номер 123456789.
Программа сложная. Не искючаю, что может возникнуть аварийное завершение при каких-то значениях параметров, установленных с помощью графического интерфейса. Можно попробовать переключить таймфрейм для восстановления работы. Если это не поможет, то необходимо удалить один или два файла.

Для этого открыть каталог с данными. Зайти в папку MQL\Files\ZUP. В этой папке удалить файл spR_123456789.bin. Если он там будет находиться. Этого файла может и не быть.
В папке MQL\Files\ZUP\SaveParametrs удалить файл pE123456789.bin с параметрами для ZUP, установленного в этом окне. Номер окна может быть любым. Здесь взят условный номер для примера. Этот номер буде при значении кнопки Save Parameters = 2 в меню Common.

Создано маленькое меню Default для оперативной настройки вил Эндрюса. Включается кнопкой small menu.
В этом меню находятся самые необходимые кнопки с параметрами для быстрой настройки вил Эндрюса и кнопки настройки зигзагов для быстрого нахождения экстремумов, к которым вилы привязываются.


Исправлены замеченные ошибки.
버전 153.7 2019.04.09
Восстановил работу выбора параметра в окне создания паттернов с помощью графического интерфейса.
В 153 версии данное окно подключается кнопкой "Choice and creation of 5 dot patterns".
Ранее эта кнопка называлась "Select".
버전 153.6 2019.04.09
Изменил вывод паттернов Песавненто.
버전 153.5 2019.04.09
Внесено небольшое изменение при вызове меню Default.

------------------------------------------------------------------------
Существенное изменение в 153 версии ZUP.

При подключенном графическом интерфейсе (ExtPanel=true) на работу ZUP влияют параметры, задаваемые через графический интерфейс. Графический интерфейс подключен по умолчанию. Поэтому, например, на поиск паттернов при подключенном графическом интерфейсе не влияют параметры, заданные через окно изменения параметров. Для поиска паттернов необходимо нажать кнопку ZZ и потом выбрать кнопку 11. При нажатии на кнопку 11 подключается режим ExtIndicator=11 - режим поиска паттернов. И в меню, выводимом у кнопки 11 настраиваются параметры поиска паттернов. Кнопки с номерами соответствуют режимам ExtIndicator. И меню подключаемые этими кнопками будут настраивать соответствующие зигзаги.
А с помощью меню Default настраиваются параметры графических инструментов.
В меню Common настраиваются все остальные параметры.
Есть параметры, которые настраиваются только через окно настройки параметров.
Перечислю их.
Для поиска паттернов:
CustomPattern
NameCustomPattern
minXB
maxXB
minAC
maxAC
minBD
maxBD
minXD
maxXD

Для вил Эндрюса:
ExtCustomStaticAP
AutoMagnet
AMBars
ExtPitchforkCandle
ExtDateTimePitchfork_1
ExtDateTimePitchfork_2
ExtDateTimePitchfork_3
ExtPitchfork_1_HighLow

Другие параметры:
chHL_PeakDet_or_vts
NumberOfBars
NumberOfVTS
NumberOfVTS1

ExtObjectColor
ExtObjectStyle
ExtObjectWidth


ZigZagHighLow

ExtSave
info_comment
infoTF

ExtVisible
ExtReset
ExtPanel
ExtSet


Если отключить (ExtPanel=false) графический интерфейс, то настраивать параметры можно, как и раньше, через окно настройки параметров.
버전 153.4 2019.04.08
Добавлено удаление объектов меню с графика
버전 153.3 2019.04.07
Сделал контроль ввода допустимых значений в параметр ExtPitchforkStaticNum.
Исправил замеченные ошибки.
버전 153.2 2019.04.05
Добавил кнопку SelectPattern в меню редактирования параметров паттернов Gartley.
Исправил удаление символов волновой разметки на графике.
버전 153.1 2019.04.03
Большинство параметров стало возможно настраивать через графический интерфейс.
Для настройки параметра ExtIndicator добавлена кнопка ZZ. Параметры каждого зигзага стало возможно настраивать индивидуально. Настройка осуществляется мгновенно.
Для настройки параметров графических инструментов добавлена кнопка Default. Для настройки спиралей эта кнопка называется D.
Все остальные параметры настраиваются через кнопку Common.
Небольшое количество параметров не настраивается через графический интерфейс.
Это параметры, которые потеряли актуальность после создания графического интерфейса, параметры, которые не соответствуют идеологии ZUP (VTS), параметры, которые при настройке через графический интерфейс могут создать тупиковую ситуацию (ExtSet, ExtPanel...).


Добавлены в графический интерфейс несколько новых параметров для удобства.
Например, в группе Common, параметр Save Parameters позволяет сохранять настройки, то есть все параметры.
Save Parameters = 0 - при такой настройке параметры может использовать любой экземпляр ZUP терминала.
Save Parameters = 1 - при такой настройке параметры используются для настройки отпереленного финансового инструмента, например, валютной пары EURUSD.
Save Parameters = 2 - настройка по умолчанию. Параметры сохраняются только для текущего окна с графиком финансового инструмента.

Важно!
При нажатии на выше приведенные кнопочки выпадает меню со списками параметров. Меню имеют определенный размер по вертикали. Чтобы все строки меню умещались на экране, необходимо чтобы монитор по вертикали имел настройку не менее 800 точек.

Настройка параметров производится с помощью кнопок.
С помощью стрелок около кнопок можно перебирать значения параметра из допустимого диапазона или из списка и редактировать - изменять значение параметра. Но, например, при настройке списков фибо уровней или списков наборов цветов стрелками выбирается значение из списка. Но редактировать выбранное значение можно при нажатии на кнопку со значением фибо уровня или после нажатия на кнопку с цветом.
Все кнопки, на которых выводится какое-либо числовое значение можно редактировать как с помощью стрелок, так и при нажатии на кнопку.
Кнопки параметров со списком "битов" - выводится список 1 и 0 - редактируются при нажатии на 1 или на 0. После этого изменяется соответствующее значение на 0 или на 1. При подведении курсора мыши к значению бита во всплывающей подсказке выводится, на что влияет значение этого бита.

Для удобства некоторые меню разбиваются на несколько страниц. Количество страниц зависит от разрешения монитора по горизонтали. С помощью кнопки Page выбирается страница. Также можно выбрать отдельную колонку меню с помощью кнопки Column. Это сделано для того, чтобы окно с меню не перекрывало график.

버전 152.21 2019.01.22
Исправил работу с цветом при выводе вил Эндрюса.
버전 152.20 2018.12.03
Добавлена возможность изменения порядка расположения кнопок на меню выбора графических инструментов.
Для изменения порядка расположения кнопок необходимо нажать на кнопку Insert. Нажимаем на кнопку одного из 12 графических инструментов. Нажимаем на клавиши SHIFT и стрелка вправо на чистовой клавиатуре для перемещения кнопки вправо. Или нажимаем SHIFT и стрелка влево для перемещения кнопки влево. Одно нажатие на стрелку вызывает одно перемещение позиции кнопки.

버전 152.19 2018.11.25
Добавлено.
Если на меню выбора графических инструментов задана работа с фибо проекциями, то при нажатии на графике на линию фибо уровня в графическом инструменте фибо проекции, созданного с помощью графического интерфейса ZUP, на дополнительном меню для фибо проекций будет выведено значение фибо уровня для этой линии.
버전 152.18 2018.11.25
Добавлено.
Если на меню выбора графических инструментов задана работа с фибо каналами, то при нажатии на графике на линию фибо уровня в графическом инструменте фибо каналы, созданного с помощью графического интерфейса ZUP, на дополнительном меню для фибо каналов будет выведено значение фибо уровня для этой линии.
버전 152.17 2018.11.06
Отрегулировал работу кнопок Hide и Del на графическом интерфейсе.
Если надпись на кнопке черного цвета, то кнопка работает.
Если серого цвета, то кнопка не работает.
버전 152.16 2018.11.04
Отрегулировал работу кнопок "Target Line" для канала Фибоначчи и равноудаленного канала и кнопки "Target" для вил Эндрюса в графическом интерфейсе. Надписи на данных кнопках стали выводиться черным или серым цветом. Серым цветом надпись выводится в том случае, когда не имеет смысла или не предусматривается работа кнопок.
버전 152.15 2018.10.30
Добавлено.
Если на меню выбора графических инструментов задана работа с фибо уровнями, то при нажатии на графике на линию фибо уровня, созданного с помощью графического интерфейса ZUP, на дополнительном меню для фибо уровней будет выведено значение фибо уровня для этой линии.
버전 152.14 2018.10.24
Добавлены всплывающие подсказки к линиям Шиффа в комплекте вил Эндрюса.
버전 152.13 2018.09.14
Добавлены возможность корректировки волновой разметки с помощью графического интерфейса.
После нанесения на график символов волновой разметки необходимо подвести курсор мыши к символу волновой разметки. Далее нажать комбинацию клавиша CTRL и левая кнопка мыши. Появится меню.
Стрелками можно изменить волновой уровень волны, к которой относится выбранный символ. Или волновой уровень волны и всех волн, входящих в структуру выбранной волны.
Также можно удалить. Для удаления внизу меню расположено 5 кнопок.
S - удаление выбранного символа.
W - удаление волны, в состав которой входит выбранный символ.
St - удаление волны, в состав которой входит выбранный символ, и всех волн входящих в структуру этой волны. Удаление структуры.
L - удаление всех символов волнового уровня, к которому относится выбранный символ.
M - удаление всей разметки.
Перед удалением появляется предупреждающее окно. В данном окне необходимо подтвердить согласие или не согласие с предложенными действиями.
При наведении на любой пункт меню курсора мыши появляются всплывающие подсказки.

Добавлено множество небольших исправлений в графическом интерфейсе.
버전 152.12 2018.07.30
Добавлены всплывающие подсказки для линий VectorOfAMirrorTrend и для рамки PointD при выводе паттернов.
버전 152.11 2018.07.26
Исправлена логика работы параметра ExtSet
버전 152.10 2018.07.24
Added tooltips for Equilibrium, Reaction1 and Reaction2 lines when displaying five-dot Gartley patterns.
Fixed errors occurring in case of big ExtMaxBar values.
버전 152.9 2018.05.14
Fixed the display of price labels in the Andrews' Pitchfork.
버전 152.8 2018.03.08
Added a tooltip when hovering the mouse cursor over PivotZZ line
버전 152.7 2018.01.23
Fixed bugs.
버전 152.6 2017.12.14
Fixed display of target labels in Andrews' Forks created using the graphics interface.
버전 152.5 2017.10.23
Fixed the button that shows/hides the Fibonacci projection graphics tool in Fibonacci projections editing menu.
버전 152.4 2017.10.11
Fixed an error in processing of extremums.
버전 152.3 2017.09.12
Fixed the error with the output of wave character highlight when applying the wave layout to the chart.
버전 152.2 2017.07.13
Added the ability to create new five-point patterns by editing parameters of one of the 33 patterns built into the indicator. When editing is complete, it is suggested to save the new pattern to an external CSV file.

Fixed the logic of connection to pattern search using the graphical interface.

Fixed known bugs.
버전 152.1 2017.06.27
Added graphical interface controls for patter search.
Using the GUI, it is now possible to:
1. enable or disable search for different patterns;
2. create new patterns;
3. edit pattern parameters;
4. save newly created patterns to a file;
5. enable search for patterns from the selected file;
6. create lists of patterns for search.
버전 151.9 2017.03.20
Changed the algorithm of binding the wave symbols to extremums of the price bars.
버전 151.8 2017.03.14
Made changes to the pattern search algorithm
버전 151.7 2017.03.09
Fixed the pattern search algorithm
버전 151.6 2017.02.13
Fixed the algorithm for fractal filtering of the wave layout.
Earlier, the fractal filtering hid the wave layout, when certain timeframes were missing quotes.
버전 151.5 2017.02.09
Fixed saving of the number of the wave layout attached to the chart.
Added a monthly check for presence of files with object archives for the deleted windows with charts.
In case such files are found, they are deleted.

Fixed names of the colors in the color selection table.
버전 151.4 2017.01.31
Fixed the deletion of one wave level of the wave layout.
There was the following error. If one wave level was created, and then only this level was deleted, the ZigZag was removed but the symbols of the wave level remained on the chart until the indicator was reloaded or timeframe was changed.
버전 151.3 2017.01.09
Added. When hovering over the pattern lines created using parameters, the tooltip displays the range of timeframes where the tooltips can be displayed without distortions.
Also, when hovering the pattern name in the pattern monitor, the tooltip displays a similar range of timeframes.
Fixed known bugs.