Volume Horizon MT4
- 지표
- 버전: 1.41
- 업데이트됨: 9 10월 2024
- 활성화: 5

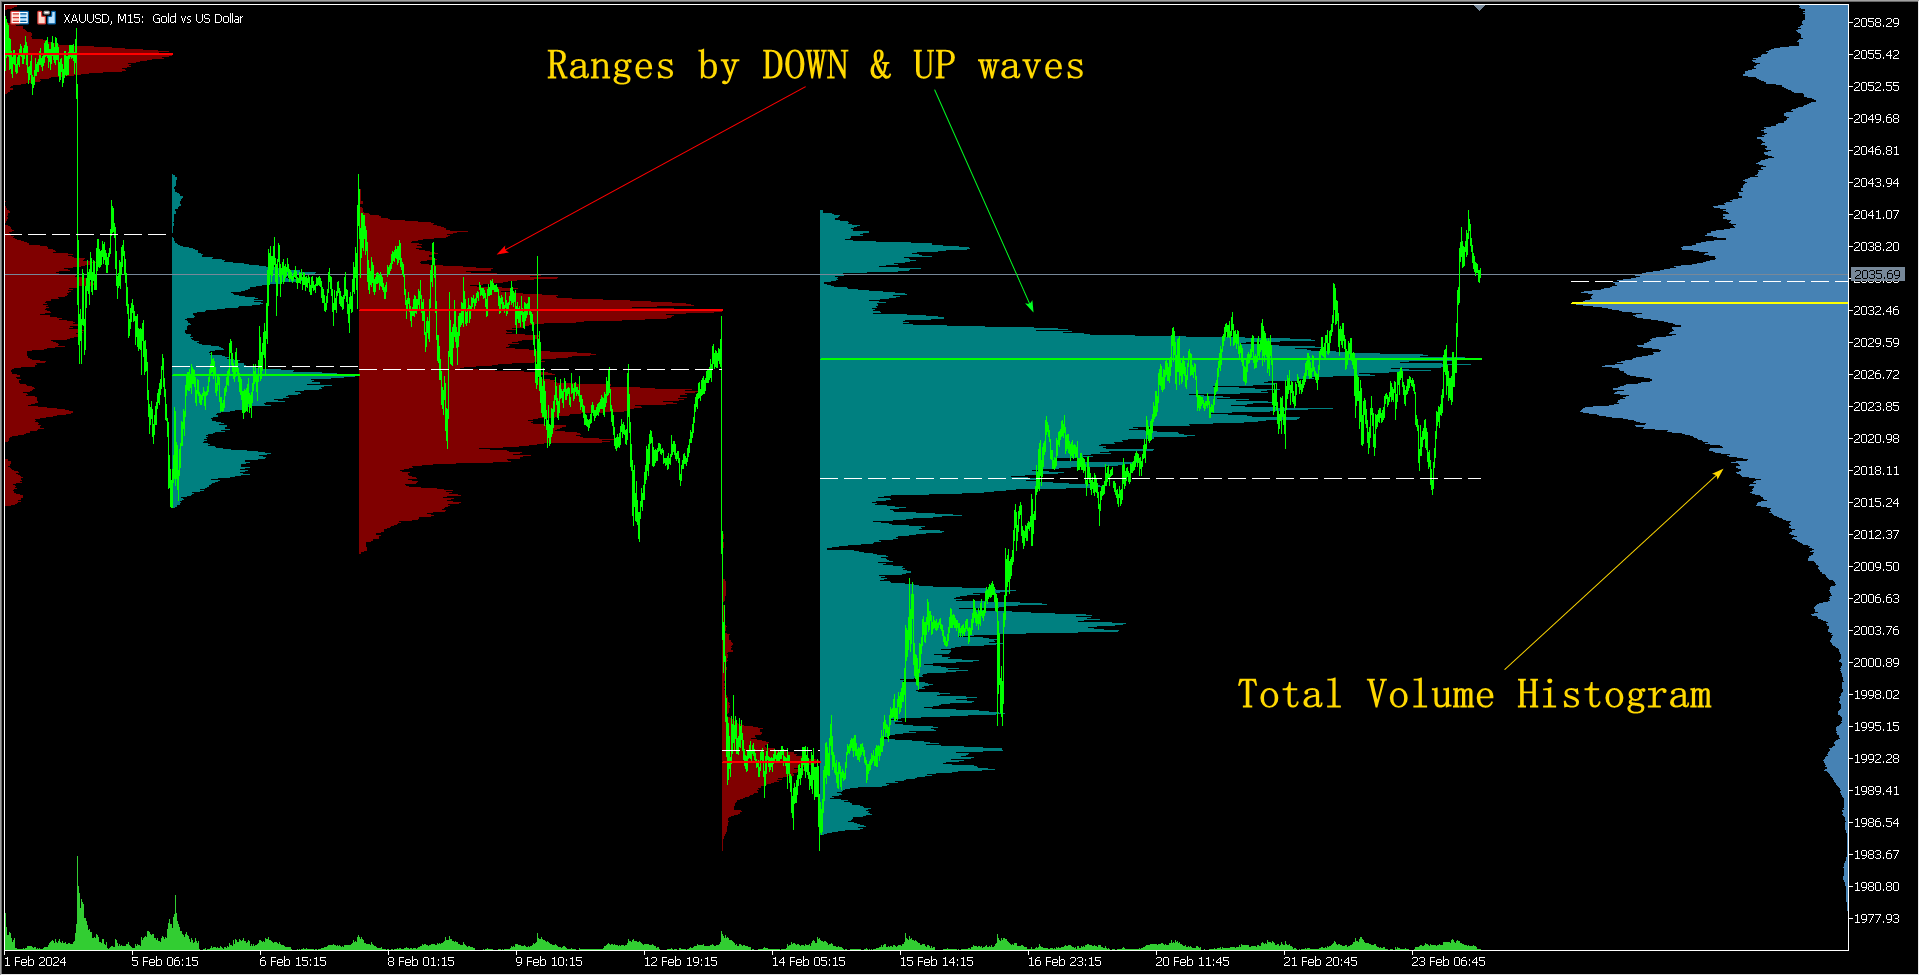
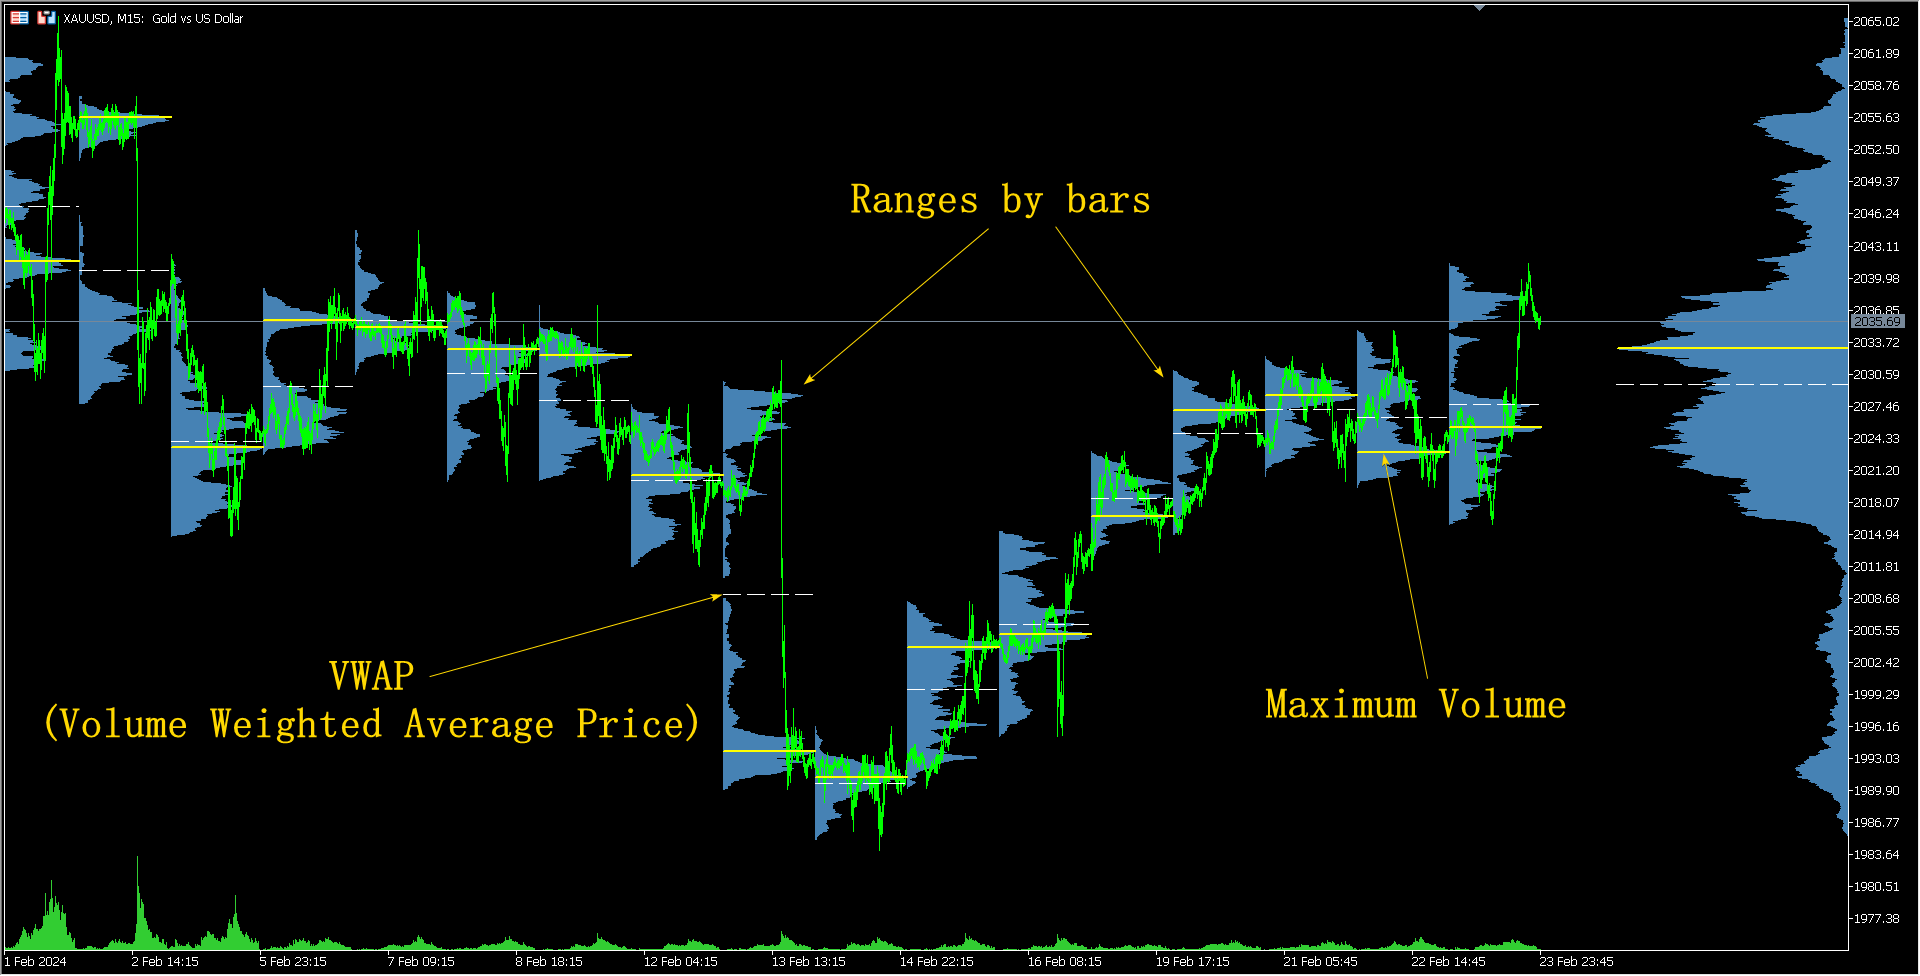
Volume Horizon is a horizontal volume indicator that allows you to observe the density of market participants' volumes across various price and time intervals. Volume histograms can be constructed based on ascending or descending market waves, as well as individual bars. This tool enables more precise determination of entry or exit points, relying on levels of maximum volumes or volume-weighted average prices (VWAP).
What makes Volume Horizon unique?
1. Segmentation into ascending and descending waves: Volume Horizon not only analyzes trading volumes but also classifies them based on the market's directional movement, allowing you to better understand its structure and dynamics.
2. Horizontal volumes within ranges: The indicator constructs volume histograms within specific ranges, enabling you to explore trading intensity at specific price levels and identify potential support and resistance zones.
3. Maximum volume levels and VWAP: Volume Horizon automatically identifies maximum volume levels in each range and calculates VWAP levels, helping you more accurately determine entry and exit points.
4. Generalized histogram for holistic analysis: The indicator creates a generalized volume histogram, providing you with a broader overview of the market's current state and overall trends.
The advantages of using Volume Horizon are evident:
- Deep understanding of the market: Allows you to see not only individual volumes but also their distribution over time and space, opening up new opportunities for analysis.
- Trend forecasting: Thanks to segmentation into ascending and descending waves, you gain a more precise understanding of the current market direction and potential future trends.
- Identification of key entry and exit points: Automatically calculated maximum volume levels and VWAP help you make informed trading decisions in any situation.
Adjust the indicator to suit yourself:
=== RANGES === - Ranges settings.
Ranges Mode - Ranges mode: RANGES BY BARS - build ranges by bars; RANGES BY WAVES - build ranges by up and down waves.
Ranges Timeframe - Ranges timeframe.
Ranges Count - Number of ranges.
Ranges Price Step - Price step in ranges.
Ranges Price Step - Price step in ranges.
=== HISTOGRAMS === - Histograms settings.
Show Total Histogram - Show total histogram.
Histograms Volumes Lines Color - Colour of histograms volume lines.
Histograms Volumes Lines Up Color - Upward colour of histograms volume lines.
Histograms Volumes Lines Down Color - Downward colour of histograms volume lines.
Histograms Volumes Lines Width - Width of histograms volume lines.
Histograms Max. Volume Levels Color - Colour of the maximum volume levels of the histograms.
Histograms Max. Volume Levels Up Color - Upward colour of the maximum volume levels of the histograms.
Histograms Max. Volume Levels Down Color - Upward colour of the maximum volume levels of the histograms.
Histograms Max. Volume Levels Width - Width of the maximum volume levels of the histograms.
Histograms VWAP (Volume Weighted Average Price) Levels Color - Colour of VWAP (Volume Weighted Average Price) histograms levels.
Histograms VWAP Levels Width - Width of VWAP histograms levels.
Histograms VWAP Levels Style - VWAP histograms levels style.
Histograms Mark - Histograms mark.