
MQL5에서의 진보된 적응형 인디케이터 이론 및 구현
들어가며
이 문서는 John F. Ehlers의 훌륭한 저작물 두 개에 기반을 두고 있습니다 "Rocket Science for Traders" 및 "Сybernetic Analysis for Stock and Futures". 저는 J.F. Ehlers의 디지털 신호 처리 방법 및 시장 사이클 인식에 복소수를 도입하는 독특한 시장 분석 접근을 보고 영감을 받아 일련의 주제에 대해 더욱 깊숙이 들어가보기로 했고, 그 결과로 MQL5으로 3개의 적응형 인디케이터를 구현하게 되었습니다.
이 문서에서는 적응형 인디케이터와 그것을 MQL5으로 구현하는 것에 대한 대한 기본 이론에 대해 다루어 볼 것입니다. 적응형 인디케이터는 적응형이 아닌 버전과 비교될 것입니다.
시장 사이클을 측정하기 위한 복소수와 페이저
복소수 이론에 대한 발상은 공학적 배경이 없으신 독자분들께는 상당히 복잡할 지도 모르겠습니다. 따라서 본 문서를 읽으시기 전에 사전에 위키에서 이론에 대해 알아보시거나 혹은 튜토리얼을 보는 것을 추천드립니다.
페이저
페이저나 페이즈 벡터는 사이클의 페이즈와 폭을 보여주는 벡터입니다. 오일러의 공식에 따르면 사인파는 두 복소수로 나타내어질 수 있습니다. 아래에 나타난 사인파를 나타내는 회전 페이저를 확인해주시가 바랍니다.
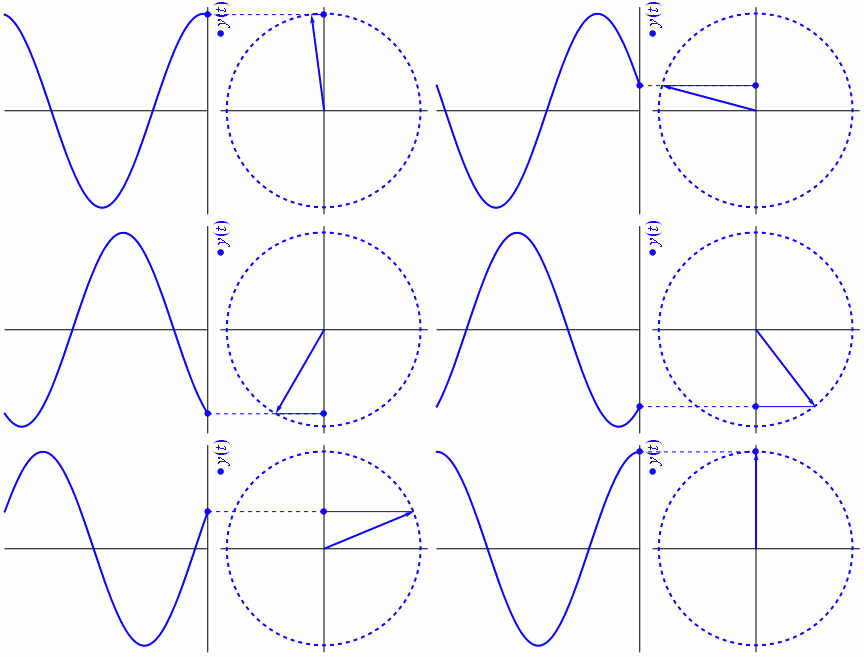
이 애니메이션을 처음 보시는 경우 사이클과 페이저간의 관계를 알아차리기 힘드실 수도 있습니다. 제대로 이해하기 위해서는 애니메이션의 왼쪽에서 볼 수 있는 일반적인 파형이 아니라 오른쪽에서 회전하는 페이저로 사이클을 인식하도록 발상을 전환해야합니다.
처음에는 상상하기 힘들겠지만, 페이저의 완전 회전은 360도 또는 ![]() 라디안이고, 완전 사이클에 대해서도 마찬가지입니다. 페이저의 현재 각은 주기 내 어느 (페이즈)에 있는가를 알려주는 것입니다. Y 축은 주어진 페이즈 내의 사이클의 진폭을 나타냅니다.
라디안이고, 완전 사이클에 대해서도 마찬가지입니다. 페이저의 현재 각은 주기 내 어느 (페이즈)에 있는가를 알려주는 것입니다. Y 축은 주어진 페이즈 내의 사이클의 진폭을 나타냅니다.
페이저는 두 가지 구성 요소로 나뉠 수 있습니다. InPhase 성분(코사인) 및 Quadrature 성분(사인)입니다. 각 성분에 대한 구체적인 설명은 "Rocket Science for Traders"의 챕터 6, "Hilbert Transforms" 에서 찾아보실 수 있습니다. 만약 관심이 있으신 분이 있다면 이 챕터를 자세히 보세요.
지금은 적응형 인디케이터 계산을 위해 분석 신호(파형)를 두 개의 구성요소로 구성된 복합 신호로 변환하면 된다는 사실에만 집중하면 됩니다. 어떻게 해야 될까요? 제가 힐베르트 변환에 대해 언급한 적 있던가요? 그렇습니다. 힐베르트 변환이 바로 정답입니다.
주기 판정
힐베르트 변환을 트레이더들이 써먹을 수 있도록 하기 위하여, John Ehlers는 자신의 저서에서 힐베르트 변환 시리즈를 네 가지 요소로 나누었습니다.
직각 성분(Quadrature component) 방정식은 다음과 같습니다.
![]()
InPhase 성분에 대한 방정식은 바 세 개 만큼 지연된 매매가입니다.
![]()
InPhase 및 Quadratuure 성분의 계산을 끝마쳤다면 현재 막대에 대해 측정된 페이즈와 바 1개 전에 측정된 페이즈 각에서 차동 위상 계산을 도출할 수 있습니다. 현재 바의 페이즈는 ![]() 그리고 이전 바의 페이즈는
그리고 이전 바의 페이즈는![]() . 삼각 항등식을 이용하여
. 삼각 항등식을 이용하여
![]()
델타페이즈(DeltaPhase) 라 불리는 페이즈 미분 방정식을 얻습니다.
Ehlers는 DeltaPhase 변수에 추가 제약 조건을 적용합니다. 결과는 음수일 수 없으며 DeltaPhase는 <0.1, 1.1> 라디안으로 제한됩니다 (6~63bar 사이의 사이클을 의미). 실제 데이터에 대해 측정된 DeltaPhase는 노이즈가 매우 크기 때문에 평활화가 필요한 것으로 나타났습니다.
들쑥날쑥한 데이터에 대한 최상의 평활 방법은 중간값 필터이므로, DeltaPhase 샘플 5개의 중간값을 이용하여 MedianDelta 변수를 만듭니다 중앙값 델타를 ![]() 로 나눈 값으로는 우리가 찾고 있는 시장 사이클인 주요 사이클(Dominant Cycle) 을 계산할 때 사용됩니다.
로 나눈 값으로는 우리가 찾고 있는 시장 사이클인 주요 사이클(Dominant Cycle) 을 계산할 때 사용됩니다.
개발단계의 테스트 결과 약 0.5의 편향이 있는 것을 확인하였기에 편향을 제거하기 위한 조정이 추가되었습니다. 마지막으로, 주요 사이클은 각각 0.33과 0.15에 해당하는 알파 값을 가진 EMA에 의해 두 번 평활됩니다. 사이클 주기가 6에서 40으로 점차 증가하는 사인파에 적용되는 알고리즘의 신뢰성을 확인하기 위해 이 책을 꼭 읽어보기를 권합니다.
지금까지 이론에 대한 지식을 확보하였으니 지금부터는 MQL5에서 CyclePeriod 인디케이터를 구현해보도록 하겠습니다.
Cycle Period 인디케이터
이 인디케이터는 사이클 주기가 표시된 사이클 라인과 트리거 라인, 기본적으로 1 바 지연된 사이클 라인으로 구성되어 있습니다. "Measuring Cycle Period" 섹션의 설명과 OnCalculate() 함수의 소스 코드를 따르면 사이클 주기 측정을 담당하는 라인이 어떤 것인지 쉽게 알게되실 것입니다.
//+------------------------------------------------------------------+
//|                                                  CyclePeriod.mq5 |
//|                                      Copyright 2011, Investeo.pl |
//|                                               http://Investeo.pl |
//+------------------------------------------------------------------+
#property copyright "Copyright 2011, Investeo.pl"
#property link      "http://Investeo.pl"
#property version   "1.00"
#property indicator_separate_window

#property description "CyclePeriod indicator - described by John F. Ehlers"
#property description "in \"Cybernetic Analysis for Stocks and Futures\""

#property indicator_buffers 2
#property indicator_plots 2
#property indicator_width1 1
#property indicator_width2 1
#property indicator_type1   DRAW_LINE
#property indicator_type2   DRAW_LINE
#property indicator_color1  Green
#property indicator_color2  Red
#property indicator_label1  "Cycle"
#property indicator_label2  "Trigger Line"

#define Price(i) ((high[i]+low[i])/2.0)

double Smooth[];
double Cycle[];
double Trigger[];
//double Price[];
double Q1[]; // Quadrature component
double I1[]; // InPhase component
double DeltaPhase[];
double InstPeriod[];
double CyclePeriod[];


input double InpAlpha=0.07; // alpha
//+------------------------------------------------------------------+
//| Custom indicator initialization function                         |
//+------------------------------------------------------------------+
int OnInit()
  {
//--- indicator buffers mapping
   ArraySetAsSeries(Cycle,true);
   ArraySetAsSeries(CyclePeriod,true);
   ArraySetAsSeries(Trigger,true);
   ArraySetAsSeries(Smooth,true);
   //ArraySetAsSeries(Price,true);

   SetIndexBuffer(0,CyclePeriod,INDICATOR_DATA);
   SetIndexBuffer(1,Trigger,INDICATOR_DATA);

   PlotIndexSetDouble(0,PLOT_EMPTY_VALUE,0.0);
   PlotIndexSetDouble(1,PLOT_EMPTY_VALUE,0.0);

   return(0);
  }
//+------------------------------------------------------------------+
//| Custom indicator iteration function                              |
//+------------------------------------------------------------------+
int OnCalculate(const int rates_total,
                const int prev_calculated,
                const datetime &time[],
                const double &open[],
                const double &high[],
                const double &low[],
                const double &close[],
                const long &tick_volume[],
                const long &volume[],
                const int &spread[])
  {
//---
   long tickCnt[1];
   int i;
   int ticks=CopyTickVolume(Symbol(), 0, 0, 1, tickCnt);
   if(ticks!=1) return(rates_total);
   double DC, MedianDelta;

   Comment(tickCnt[0]);

   if(prev_calculated==0 || tickCnt[0]==1)
     {
      //--- last counted bar will be recounted
      int nLimit=rates_total-prev_calculated-1; // start index for calculations

      ArraySetAsSeries(high,true);
      ArraySetAsSeries(low,true);

      ArrayResize(Smooth,Bars(_Symbol,_Period));
      ArrayResize(Cycle,Bars(_Symbol,_Period));
      //ArrayResize(Price,Bars(_Symbol,_Period));
      ArrayResize(CyclePeriod,Bars(_Symbol,_Period));
      ArrayResize(InstPeriod,Bars(_Symbol,_Period));
      ArrayResize(Q1,Bars(_Symbol,_Period));
      ArrayResize(I1,Bars(_Symbol,_Period));
      ArrayResize(DeltaPhase,Bars(_Symbol,_Period));

      if (nLimit>rates_total-7) // adjust for last bars
         nLimit=rates_total-7;

      for(i=nLimit;i>=0 && !IsStopped();i--)
      {
         Smooth[i] = (Price(i)+2*Price(i+1)+2*Price(i+2)+Price(i+3))/6.0;

         if (i<rates_total-7)
         {
            Cycle[i] = (1.0-0.5*InpAlpha) * (1.0-0.5*InpAlpha) * (Smooth[i]-2.0*Smooth[i+1]+Smooth[i+2])
                      +2.0*(1.0-InpAlpha)*Cycle[i+1]-(1.0-InpAlpha)*(1.0-InpAlpha)*Cycle[i+2];

         } else
         {
            Cycle[i]=(Price(i)-2.0*Price(i+1)+Price(i+2))/4.0;
         }

         Q1[i] = (0.0962*Cycle[i]+0.5769*Cycle[i+2]-0.5769*Cycle[i+4]-0.0962*Cycle[i+6])*(0.5+0.08*InstPeriod[i+1]);
         I1[i] = Cycle[i+3];

         if (Q1[i]!=0.0 && Q1[i+1]!=0.0)
            DeltaPhase[i] = (I1[i]/Q1[i]-I1[i+1]/Q1[i+1])/(1.0+I1[i]*I1[i+1]/(Q1[i]*Q1[i+1]));
         if (DeltaPhase[i] < 0.1)
            DeltaPhase[i] = 0.1;
         if (DeltaPhase[i] > 0.9)
            DeltaPhase[i] = 0.9;

         MedianDelta = Median(DeltaPhase, i, 5);

         if (MedianDelta == 0.0)
            DC = 15.0;
         else
            DC = (6.28318/MedianDelta) + 0.5;

         InstPeriod[i] = 0.33 * DC + 0.67 * InstPeriod[i+1];
         CyclePeriod[i] = 0.15 * InstPeriod[i] + 0.85 * CyclePeriod[i+1];
         Trigger[i] = CyclePeriod[i+1];
      }
     }
//--- return value of prev_calculated for next call
   return(rates_total);
  }
//+------------------------------------------------------------------+

double Median(double& arr[], int idx, int m_len)
{
   double MedianArr[];
   int copied;
   double result = 0.0;

   ArraySetAsSeries(MedianArr, true);
   ArrayResize(MedianArr, m_len);

   copied = ArrayCopy(MedianArr, arr, 0, idx, m_len);
   if (copied == m_len)
   {
      ArraySort(MedianArr);
      if (m_len %2 == 0)
            result = (MedianArr[m_len/2] + MedianArr[(m_len/2)+1])/2.0;
      else
            result = MedianArr[m_len / 2];

   }
   else Print(__FILE__+__FUNCTION__+"median error - wrong number of elements copied.");
   return result;
}
본 인디케이터의 테스트는 아무 차트에나 붙이는 것으로 수행가능합니다. 어떠한 통화나 어떠한 타임프레임에 대해서도 적용가능할 것입니다.
아래에서 테스팅 스크린 샷을 확인하실 수 있습니다.
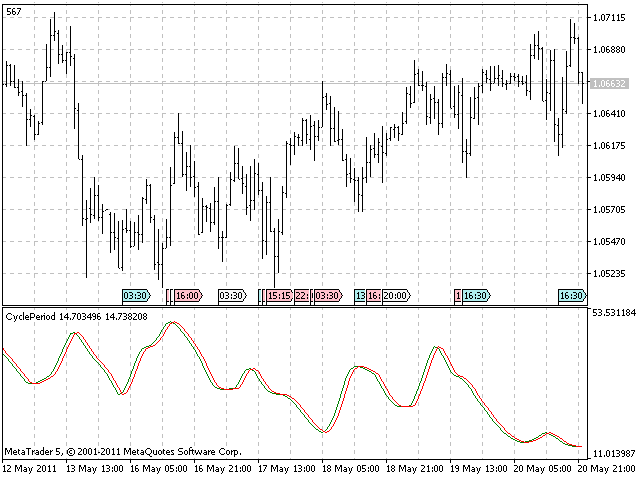
이 인디케이터를 통해 시장의 현 사이클 주기에 적응할 수 있는 적응형 인디케이터를 도입할 수 있게 됩니다.
Cyber Cycle 인디케이터
Cyber Cycle 인디케이터는 "Сybernetic analysis for stocks and futures"에서 가져온 하이 패스 필터입니다. 이 필터는 타임시리즈에서 사이클 모드 성분만 남기는 역할을 수행합니다.
추가적으로, 유한 임펄스 응답 로우 패스 필터를 통해 결과물을 평활화하는 과정에서 2 바와 3 바 사이클 성분이 추출됩니다.
본 인디케이터의 MQL5 코드나 책에서 같이 다룬 EFL(트레이드스테이션) 언어판 기타 인디케이터들이 본 문서에 첨부되어있습니다.
//+------------------------------------------------------------------+
//|                                                   CyberCycle.mq5 |
//|                                      Copyright 2011, Investeo.pl |
//|                                               http://Investeo.pl |
//+------------------------------------------------------------------+
#property copyright "Copyright 2011, Investeo.pl"
#property link      "http://Investeo.pl"
#property version   "1.00"
#property indicator_separate_window

#property description "CyberCycle indicator - described by John F. Ehlers"
#property description "in \"Cybernetic Analysis for Stocks and Futures\""
#property description "This indicator is available for free download."

#property indicator_buffers 2
#property indicator_plots 2
#property indicator_width1 1
#property indicator_width2 1
#property indicator_type1   DRAW_LINE
#property indicator_type2   DRAW_LINE
#property indicator_color1  Green
#property indicator_color2  Red
#property indicator_label1  "Cycle"
#property indicator_label2  "Trigger Line"

#define Price(i) ((high[i]+low[i])/2.0)

double Smooth[];
double Cycle[];
double Trigger[];

input double InpAlpha=0.07; // alpha
//+------------------------------------------------------------------+
//| Custom indicator initialization function                         |
//+------------------------------------------------------------------+
int OnInit()
  {
//--- indicator buffers mapping
   ArraySetAsSeries(Cycle,true);
   ArraySetAsSeries(Trigger,true);
   ArraySetAsSeries(Smooth,true);

   SetIndexBuffer(0,Cycle,INDICATOR_DATA);
   SetIndexBuffer(1,Trigger,INDICATOR_DATA);

   PlotIndexSetDouble(0,PLOT_EMPTY_VALUE,0.0);
   PlotIndexSetDouble(1,PLOT_EMPTY_VALUE,0.0);

   return(0);
  }
//+------------------------------------------------------------------+
//| Custom indicator iteration function                              |
//+------------------------------------------------------------------+
int OnCalculate(const int rates_total,
                const int prev_calculated,
                const datetime &time[],
                const double &open[],
                const double &high[],
                const double &low[],
                const double &close[],
                const long &tick_volume[],
                const long &volume[],
                const int &spread[])
  {
//---
   long tickCnt[1];
   int i;
   int ticks=CopyTickVolume(Symbol(), 0, 0, 1, tickCnt);
   if(ticks!=1) return(rates_total);

   Comment(tickCnt[0]);

   if(prev_calculated==0 || tickCnt[0]==1)
     {
      //--- last counted bar will be recounted
      int nLimit=rates_total-prev_calculated-1; // start index for calculations

      ArraySetAsSeries(high,true);
      ArraySetAsSeries(low,true);

      ArrayResize(Smooth,Bars(_Symbol,_Period));
      ArrayResize(Cycle,Bars(_Symbol,_Period));

      if(nLimit>rates_total-4) // adjust for last bars
         nLimit=rates_total-4;

      for(i=nLimit;i>=0 && !IsStopped();i--)
        {
         Smooth[i]=(Price(i)+2*Price(i+1)+2*Price(i+2)+Price(i+3))/6.0;

         if(i<rates_total-5)
           {
            Cycle[i]=(1.0-0.5*InpAlpha) *(1.0-0.5*InpAlpha) *(Smooth[i]-2.0*Smooth[i+1]+Smooth[i+2])
                     +2.0*(1.0-InpAlpha)*Cycle[i+1]-(1.0-InpAlpha)*(1.0-InpAlpha)*Cycle[i+2];
           }
         else
           {
            Cycle[i]=(Price(i)-2.0*Price(i+1)+Price(i+2))/4.0;
           }

         //Print(__FILE__+__FUNCTION__+" received values: ",rCnt);
         Trigger[i]=Cycle[i+1];
        }
     }
//--- return value of prev_calculated for next call
   return(rates_total);
  }
//+------------------------------------------------------------------+
해당 인디케이터의 스크린 샷을 아래 첨부해 두었습니다.
이 문서에서 다룬 인디케이터들은 전부 비슷해보이지만 실제로 매우 다른 알고리즘으로 구현되어있습니다.
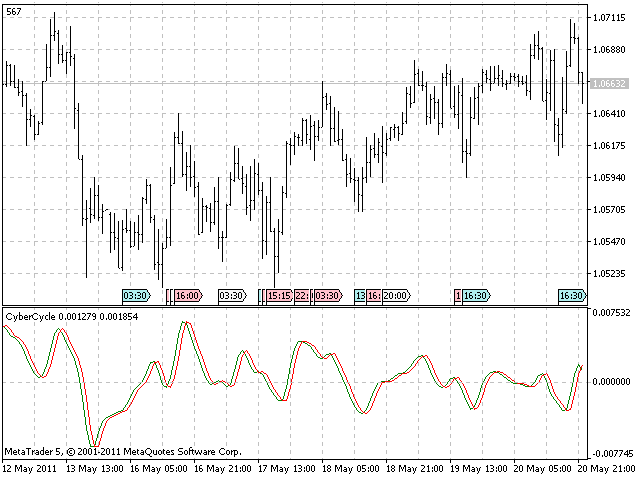
이 인디케이터의 원래 매매 방법은 간단합니다. 즉, 사이클 라인이 트리거 라인 위로 교차할 때 매수합니다. 사이클 라인이 트리거 라인을 아래로 교차할 때 매도합니다. 이 인디케이터를 사용하여 자신만의 전략과 거래 신호 모듈을 구현해보고 싶으실거고, 또한 그리 해보시는 것을 추천드립니다.
적응형 Cyber Cycle 인디케이터
이 문서에서 알려드리고자하는 핵심은 어떻게 인디케이터를 적응형으로 탈바꿈시킬 수 있는지, 다시 말해, 정적 설정으로 계산하는 것이 아니라 동적 사이클 주기 입력을 통해 계산하도록 하는 것입니다. 그를 위해서 우리는 현재 기간에 대해 읽어올 수 있게 해주는 CyclePeriod 인디케이터에 연결해야하고, 그 뒤에는 이 결과물을 OnCalculate() 함수로 사용해야합니다.
먼저 인디케이터의 핸들을 확보해야합니다.
hCyclePeriod=iCustom(NULL,0,"CyclePeriod",InpAlpha);
   if(hCyclePeriod==INVALID_HANDLE)
     {
      Print("CyclePeriod indicator not available!");
      return(-1);
     }
그 후 OnCalculate() 함수 안에서 핸들을 읽어옵니다.
int copied=CopyBuffer(hCyclePeriod,0,i,1,CyclePeriod);
    if(copied<=0)
      {
       Print("FAILURE: Could not get values from CyclePeriod indicator.");
       return -1;
      }
alpha1 = 2.0/(CyclePeriod[0]+1.0);
전위 이동 알파는 방정식 ![]() 에 의한 단순 이동 평균의 길이와 관련이 있는데, Ehlers는 적응형 Cyber Cycle 인디케이터 안에서 주요 사이클 기간을 alpha1 계수 계산용 길이로 이용했습니다.
에 의한 단순 이동 평균의 길이와 관련이 있는데, Ehlers는 적응형 Cyber Cycle 인디케이터 안에서 주요 사이클 기간을 alpha1 계수 계산용 길이로 이용했습니다.
소스 코드 전문은 다음과 같습니다.
//+------------------------------------------------------------------+
//|                                           AdaptiveCyberCycle.mq5 |
//|                                      Copyright 2011, Investeo.pl |
//|                                               http://Investeo.pl |
//+------------------------------------------------------------------+
#property copyright "Copyright 2011, Investeo.pl"
#property link      "http://Investeo.pl"
#property version   "1.00"
#property indicator_separate_window

#property description "Adaptive CyberCycle indicator - described by John F. Ehlers"
#property description "in \"Cybernetic Analysis for Stocks and Futures\""
#property description "This indicator is available for free download."

#property indicator_buffers 2
#property indicator_plots 2
#property indicator_width1 1
#property indicator_width2 1
#property indicator_type1   DRAW_LINE
#property indicator_type2   DRAW_LINE
#property indicator_color1  Green
#property indicator_color2  Red
#property indicator_label1  "Cycle"
#property indicator_label2  "Trigger Line"

#define Price(i) ((high[i]+low[i])/2.0)

double Smooth[];
double Cycle[];
double Trigger[];

int hCyclePeriod;

input double InpAlpha=0.07; // alpha for Cycle Period
//+------------------------------------------------------------------+
//| Custom indicator initialization function                         |
//+------------------------------------------------------------------+
int OnInit()
  {
//--- indicator buffers mapping
   ArraySetAsSeries(Cycle,true);
   ArraySetAsSeries(Trigger,true);
   ArraySetAsSeries(Smooth,true);

   SetIndexBuffer(0,Cycle,INDICATOR_DATA);
   SetIndexBuffer(1,Trigger,INDICATOR_DATA);

   PlotIndexSetDouble(0,PLOT_EMPTY_VALUE,0.0);
   PlotIndexSetDouble(1,PLOT_EMPTY_VALUE,0.0);

   hCyclePeriod=iCustom(NULL,0,"CyclePeriod",InpAlpha);
   if(hCyclePeriod==INVALID_HANDLE)
     {
      Print("CyclePeriod indicator not available!");
      return(-1);
     }
   return(0);
  }
//+------------------------------------------------------------------+
//| Custom indicator iteration function                              |
//+------------------------------------------------------------------+
int OnCalculate(const int rates_total,
                const int prev_calculated,
                const datetime &time[],
                const double &open[],
                const double &high[],
                const double &low[],
                const double &close[],
                const long &tick_volume[],
                const long &volume[],
                const int &spread[])
  {
//---
   long tickCnt[1];
   int i;
   int ticks=CopyTickVolume(Symbol(), 0, 0, 1, tickCnt);
   if(ticks!=1) return(rates_total);
   double CyclePeriod[1],alpha1;

   Comment(tickCnt[0]);

   if(prev_calculated==0 || tickCnt[0]==1)
     {
      //--- last counted bar will be recounted
      int nLimit=rates_total-prev_calculated-1; // start index for calculations

      ArraySetAsSeries(high,true);
      ArraySetAsSeries(low,true);

      ArrayResize(Smooth,Bars(_Symbol,_Period));
      ArrayResize(Cycle,Bars(_Symbol,_Period));

      if(nLimit>rates_total-4) // adjust for last bars
         nLimit=rates_total-4;

      for(i=nLimit;i>=0 && !IsStopped();i--)
        {
         Smooth[i]=(Price(i)+2*Price(i+1)+2*Price(i+2)+Price(i+3))/6.0;
         int copied=CopyBuffer(hCyclePeriod,0,i,1,CyclePeriod);

         if(copied<=0)
           {
            Print("FAILURE: Could not get values from CyclePeriod indicator.");
            return -1;
           }
         alpha1 = 2.0/(CyclePeriod[0]+1.0);
         //Print(alpha1);
         //Print(CyclePeriod[0]);
         if(i>=0)
           {
            Cycle[i]=(1.0-0.5*alpha1) *(1.0-0.5*alpha1) *(Smooth[i]-2.0*Smooth[i+1]+Smooth[i+2])
                     +2.0*(1.0-alpha1)*Cycle[i+1]-(1.0-alpha1)*(1.0-alpha1)*Cycle[i+2];

            //Print("Smooth["+IntegerToString(i)+"]="+DoubleToString(Smooth[i])+" Cycle["+IntegerToString(i)+"]="+DoubleToString(Cycle[i]));
           }
         else
           {
            Cycle[i]=(Price(i)-2.0*Price(i+1)+Price(i+2))/4.0;
           }

         //Print(__FILE__+__FUNCTION__+" received values: ",rCnt);
         Trigger[i]=Cycle[i+1];
        }
     }
//--- return value of prev_calculated for next call
   return(rates_total);
  }
//+------------------------------------------------------------------+
첨부된 스크린 샷에서 인디케이터를 보십시오.
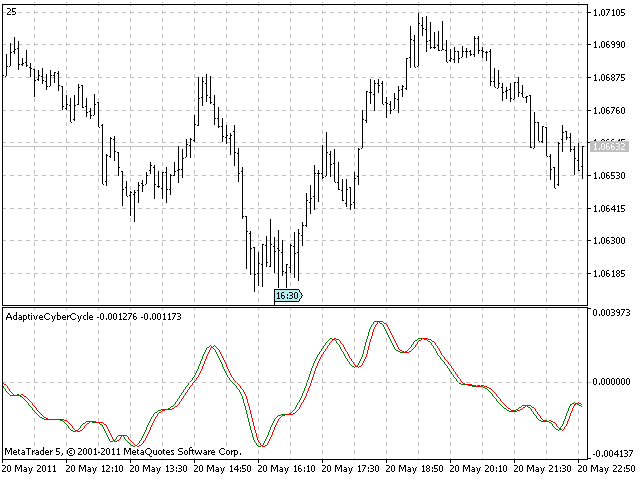
첫 적응형 인디케이터가 완성되었습니다. 책에 따르면 비적응형 버전보다 반응성이 더 높아야 합니다.
매수 및 매도 신호는 종종 비적응 버전보다 한 바 일찍 발생해야 합니다.
두 가지 인디케이터 예제를 더 진행할 수 있습니다. 적응 인디케이터를 만드는 방법을 알아내는 것으로 충분할 것입니다.
Center of Gravity 인디케이터
물리적인 물체의 무게중심을 말할 때 우리는 그것의 균형점을 의미합니다. 거래에 이 개념을 도입하려는 아이디어는 다양한 필터의 지연이 필터의 계수와 어떤 관련이 있는지를 관찰한 데서 시작되었습니다.
단순이동평균(SMA) 용 - 단순이동평균(Simple Moving Average), 모든 계수는 동일하며 무게중심은 중앙에 있습니다.
가중이동평균(WMA) 용 - 가중이동평균(Weighted Moving Average), 최근 가격일수록 예전 가격보다 더 중요합니다. 구체적으로 WMA 계수는 삼각형의 윤곽을 설명합니다. 삼각형의 무게중심은 삼각형 밑면 길이의 3분의 1에 있습니다. 주어진 관측 창에서 무게 중심을 계산하기 위해 더 일반적인 방정식은 다음과 같습니다.

균형점의 위치는 창구 내의 위치 제품 합계와 이 위치에서의 가격(+1)을 창구 내의 가격 합계로 나누어 계산하기 때문에 도입은 1부터 N까지의 값이 아니라 0부터 N까지의 값을 계산하기 때문입니다.
무게 중심의 주요 특징은 가격 변동과 함께 감소하고 상승하는 것이며, 이건 쉽게 말해 제로랙 오실레이터입니다.
아래의 소스 코드를 확인하세요.
//+------------------------------------------------------------------+
//|                                              CenterOfGravity.mq5 |
//|                                      Copyright 2011, Investeo.pl |
//|                                               http://Investeo.pl |
//+------------------------------------------------------------------+
#property copyright "Copyright 2011, Investeo.pl"
#property link      "http://Investeo.pl"
#property version   "1.00"
#property indicator_separate_window

#property description "CG indicator - described by John F. Ehlers"
#property description "in \"Cybernetic Analysis for Stocks and Futures\""
#property description "This indicator is available for free download."

#property indicator_buffers 2
#property indicator_plots 2
#property indicator_width1 1
#property indicator_width2 1
#property indicator_type1   DRAW_LINE
#property indicator_type2   DRAW_LINE
#property indicator_color1  Green
#property indicator_color2  Red
#property indicator_label1  "Cycle"
#property indicator_label2  "Trigger Line"

#define Price(i) ((high[i]+low[i])/2.0)

double Smooth[];
double Cycle[];
double Trigger[];

input double InpAlpha=0.07; // alpha
input int InpCGLength=10; //CG window size

//+------------------------------------------------------------------+
//| Custom indicator initialization function                         |
//+------------------------------------------------------------------+
int OnInit()
  {
//--- indicator buffers mapping
   ArraySetAsSeries(Cycle,true);
   ArraySetAsSeries(Trigger,true);
   ArraySetAsSeries(Smooth,true);

   SetIndexBuffer(0,Cycle,INDICATOR_DATA);
   SetIndexBuffer(1,Trigger,INDICATOR_DATA);

   PlotIndexSetDouble(0,PLOT_EMPTY_VALUE,0.0);
   PlotIndexSetDouble(1,PLOT_EMPTY_VALUE,0.0);

   return(0);
  }
//+------------------------------------------------------------------+
//| Custom indicator iteration function                              |
//+------------------------------------------------------------------+
int OnCalculate(const int rates_total,
                const int prev_calculated,
                const datetime &time[],
                const double &open[],
                const double &high[],
                const double &low[],
                const double &close[],
                const long &tick_volume[],
                const long &volume[],
                const int &spread[])
  {
//---
   long tickCnt[1];
   int i;
   double Num, Denom; // Numerator and Denominator for CG
   int ticks=CopyTickVolume(Symbol(), 0, 0, 1, tickCnt);
   if(ticks!=1) return(rates_total);

   Comment(tickCnt[0]);

   if(prev_calculated==0 || tickCnt[0]==1)
     {
      //--- last counted bar will be recounted
      int nLimit=rates_total-prev_calculated-1; // start index for calculations

      ArraySetAsSeries(high,true);
      ArraySetAsSeries(low,true);

      ArrayResize(Smooth,Bars(_Symbol,_Period));
      ArrayResize(Cycle,Bars(_Symbol,_Period));

      if(nLimit>rates_total-InpCGLength) // adjust for last bars
         nLimit=rates_total-InpCGLength;

      for(i=nLimit;i>=0 && !IsStopped();i--)
        {
         Num = 0.0;
         Denom = 0.0;
         for (int count=0; count<InpCGLength; count++)
            {
               Num += (1.0+count)*Price(i+count);
               Denom += Price(i+count);
            }
         if (Denom != 0.0)
            Cycle[i] = -Num/Denom+(InpCGLength+1.0)/2.0;
         else
            Cycle[i] = 0.0;

         //Print(__FILE__+__FUNCTION__+" received values: ",rCnt);
         Trigger[i]=Cycle[i+1];
        }
     }
//--- return value of prev_calculated for next call
   return(rates_total);
  }
//+------------------------------------------------------------------+
아래의 스크린 샷을 확인하세요. 짧은 랙이 발생하는 것을 확인하실 수 있을 겁니다.
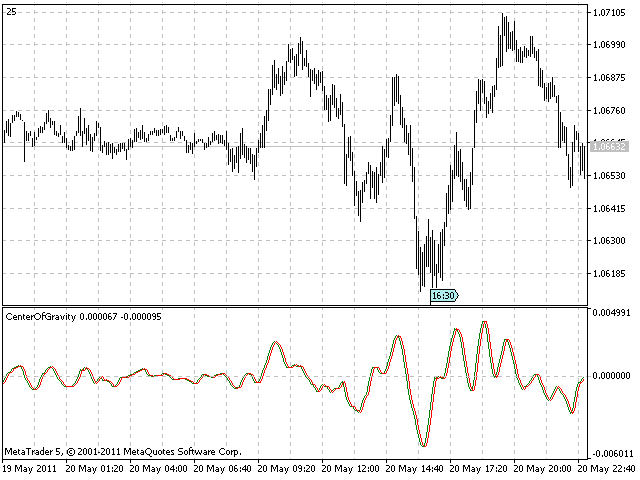
적응형 Center of Gravity(CG) 인디케이터
CG 오실레이터는 고정된 길이 시간 창에서 무게 중심을 찾습니다. 적응형 CG 오실레이터는 측정된 주요 사이클 기간 중 절반을 동적 창 길이로 사용합니다. 측정된 주요 사이클 기간의 절반을 추출하기 위해 다음 코드를 사용했습니다.
copied=CopyBuffer(hCyclePeriod,0,i,1,CyclePeriod);

if(copied<=0)
  {
   Print("FAILURE: Could not get values from CyclePeriod indicator.");
   return -1;
  }
CG_len = floor(CyclePeriod[0]/2.0);
아래에서 전체 표시기 소스 코드를 찾아 비적응 버전 및 Adaptive Cyber Cycle 표시기와 비교하여 유사성을 확인하십시오.
//+------------------------------------------------------------------+
//|                                      AdaptiveCenterOfGravity.mq5 |
//|                                      Copyright 2011, Investeo.pl |
//|                                               http://Investeo.pl |
//+------------------------------------------------------------------+
#property copyright "Copyright 2011, Investeo.pl"
#property link      "http://Investeo.pl"
#property version   "1.00"
#property indicator_separate_window

#property description "Adaptive CG indicator - described by John F. Ehlers"
#property description "in \"Cybernetic Analysis for Stocks and Futures\""
#property description "This indicator is available for free download."

#property indicator_buffers 2
#property indicator_plots 2
#property indicator_width1 1
#property indicator_width2 1
#property indicator_type1   DRAW_LINE
#property indicator_type2   DRAW_LINE
#property indicator_color1  Green
#property indicator_color2  Red
#property indicator_label1  "Cycle"
#property indicator_label2  "Trigger Line"

#define Price(i) ((high[i]+low[i])/2.0)

double Smooth[];
double Cycle[];
double Trigger[];

int hCyclePeriod;

input double InpAlpha=0.07; // alpha
//+------------------------------------------------------------------+
//| Custom indicator initialization function                         |
//+------------------------------------------------------------------+
int OnInit()
  {
//--- indicator buffers mapping
   ArraySetAsSeries(Cycle,true);
   ArraySetAsSeries(Trigger,true);
   ArraySetAsSeries(Smooth,true);

   SetIndexBuffer(0,Cycle,INDICATOR_DATA);
   SetIndexBuffer(1,Trigger,INDICATOR_DATA);

   PlotIndexSetDouble(0,PLOT_EMPTY_VALUE,0.0);
   PlotIndexSetDouble(1,PLOT_EMPTY_VALUE,0.0);

   hCyclePeriod=iCustom(NULL,0,"CyclePeriod",InpAlpha);
   if(hCyclePeriod==INVALID_HANDLE)
     {
      Print("CyclePeriod indicator not available!");
      return(-1);
     }

   return(0);
  }
//+------------------------------------------------------------------+
//| Custom indicator iteration function                              |
//+------------------------------------------------------------------+
int OnCalculate(const int rates_total,
                const int prev_calculated,
                const datetime &time[],
                const double &open[],
                const double &high[],
                const double &low[],
                const double &close[],
                const long &tick_volume[],
                const long &volume[],
                const int &spread[])
  {
//---
   long tickCnt[1];
   int i, copied;
   double Num,Denom; // Numerator and Denominator for CG
   double CG_len;
   int ticks=CopyTickVolume(Symbol(), 0, 0, 1, tickCnt);
   if(ticks!=1) return(rates_total);
   double CyclePeriod[1];

   Comment(tickCnt[0]);

   if(prev_calculated==0 || tickCnt[0]==1)
     {
      //--- last counted bar will be recounted
      int nLimit=rates_total-prev_calculated-1; // start index for calculations

      ArraySetAsSeries(high,true);
      ArraySetAsSeries(low,true);

      ArrayResize(Smooth,Bars(_Symbol,_Period));
      ArrayResize(Cycle,Bars(_Symbol,_Period));

      copied=CopyBuffer(hCyclePeriod,0,0,1,CyclePeriod);

      if(copied<=0)
        {
         Print("FAILURE: Could not get values from CyclePeriod indicator.");
         return -1;
        }

      if(nLimit>rates_total-int(CyclePeriod[0])-2) // adjust for last bars
         nLimit=rates_total-int(CyclePeriod[0])-2;


      for(i=nLimit;i>=0 && !IsStopped();i--)
        {
         copied=CopyBuffer(hCyclePeriod,0,i,1,CyclePeriod);

         if(copied<=0)
           {
            Print("FAILURE: Could not get values from CyclePeriod indicator.");
            return -1;
           }
         CG_len = floor(CyclePeriod[0]/2.0);
         //Print("CG_len="+DoubleToString(CG_len));

         Num=0.0;
         Denom=0.0;
         for(int count=0; count<int(CG_len); count++)
           {
            Num+=(1.0+count)*Price(i+count);
            Denom+=Price(i+count);
           }
         if(Denom!=0.0)
            Cycle[i]=-Num/Denom+(CG_len+1.0)/2.0;
         else
            Cycle[i]=0.0;

         //Print(__FILE__+__FUNCTION__+" received values: ",rCnt);
         Trigger[i]=Cycle[i+1];
        }
     }
//--- return value of prev_calculated for next call
   return(rates_total);
  }
//+------------------------------------------------------------------+
아래에 붙인 적응형 CG 인디케이터의 스크린 샷을 확인해주시기 바랍니다.
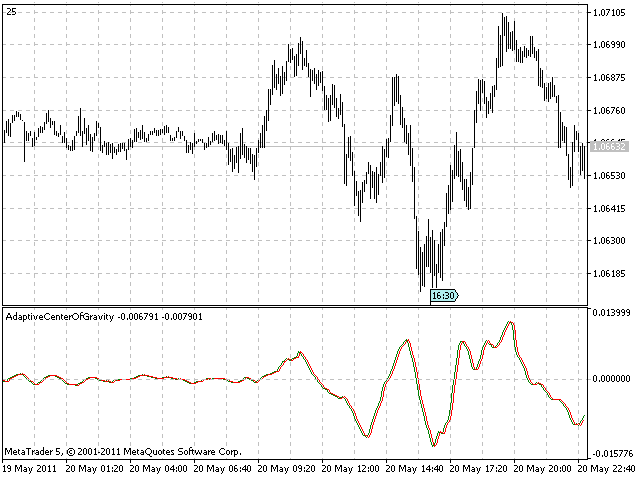
RVI 인디케이터
RVI는 Relative Vigor Index의 약자입니다. 강세장에서는 공개 가격보다 근접 가격이 높고 약세장에서는 공개 가격보다 근접 가격이 낮은 경향이 있다는 게 이 인디케이터의 기반 이론입니다.
이러한 움직임의 원동력은 일일 거래범위에 따른 근접 가격과 공개 가격 간의 차이로 측정됩니다.

이 인디케이터는 MetaTrader 5에 내장되어 있기 때문에 많은 MetaTrader 사용자에게 잘 알려진 인디케이터입니다.
참조를 위해 소스 코드를 붙여넣는 중입니다.
//+------------------------------------------------------------------+
//|                                                          RVI.mq5 |
//|                        Copyright 2009, MetaQuotes Software Corp. |
//|                                              https://www.mql5.com |
//+------------------------------------------------------------------+
#property copyright   "2009, MetaQuotes Software Corp."
#property link        "https://www.mql5.com"
#property description "Relative Vigor Index"
//--- indicator settings
#property indicator_separate_window
#property indicator_buffers 2
#property indicator_plots   2
#property indicator_type1   DRAW_LINE
#property indicator_type2   DRAW_LINE
#property indicator_color1  Green
#property indicator_color2  Red
#property indicator_label1  "RVI"
#property indicator_label2  "Signal"
//--- input parameters
input int InpRVIPeriod=10; // Period
//--- indicator buffers
double    ExtRVIBuffer[];
double    ExtSignalBuffer[];
//---
#define TRIANGLE_PERIOD  3
#define AVERAGE_PERIOD   (TRIANGLE_PERIOD*2)
//+------------------------------------------------------------------+
//| Custom indicator initialization function                         |
//+------------------------------------------------------------------+
void OnInit()
  {
//--- indicator buffers mapping
   SetIndexBuffer(0,ExtRVIBuffer,INDICATOR_DATA);
   SetIndexBuffer(1,ExtSignalBuffer,INDICATOR_DATA);
   IndicatorSetInteger(INDICATOR_DIGITS,3);
//--- sets first bar from what index will be drawn
   PlotIndexSetInteger(0,PLOT_DRAW_BEGIN,(InpRVIPeriod-1)+TRIANGLE_PERIOD);
   PlotIndexSetInteger(1,PLOT_DRAW_BEGIN,(InpRVIPeriod-1)+AVERAGE_PERIOD);
//--- name for DataWindow and indicator subwindow label
   IndicatorSetString(INDICATOR_SHORTNAME,"RVI("+string(InpRVIPeriod)+")");
   PlotIndexSetString(0,PLOT_LABEL,"RVI("+string(InpRVIPeriod)+")");
   PlotIndexSetString(1,PLOT_LABEL,"Signal("+string(InpRVIPeriod)+")");
//--- initialization done
  }
//+------------------------------------------------------------------+
//| Relative Vigor Index                                             |
//+------------------------------------------------------------------+
int OnCalculate(const int rates_total,const int prev_calculated,
                const datetime &Time[],
                const double &Open[],
                const double &High[],
                const double &Low[],
                const double &Close[],
                const long &TickVolume[],
                const long &Volume[],
                const int &Spread[])
  {
   int    i,j,nLimit;
   double dValueUp,dValueDown,dNum,dDeNum;
//--- check for bars count
   if(rates_total<=InpRVIPeriod+AVERAGE_PERIOD+2) return(0); // exit with zero result
//--- check for possible errors
   if(prev_calculated<0) return(0); // exit with zero result
//--- last counted bar will be recounted
   nLimit=InpRVIPeriod+2;
   if(prev_calculated>InpRVIPeriod+TRIANGLE_PERIOD+2)
      nLimit=prev_calculated-1;
//--- set empty value for uncalculated bars
   if(prev_calculated==0)
     {
      for(i=0;i<InpRVIPeriod+TRIANGLE_PERIOD;i++) ExtRVIBuffer[i]=0.0;
      for(i=0;i<InpRVIPeriod+AVERAGE_PERIOD;i++)  ExtSignalBuffer[i]=0.0;
     }
//--- RVI counted in the 1-st buffer
   for(i=nLimit;i<rates_total && !IsStopped();i++)
     {
      dNum=0.0;
      dDeNum=0.0;
      for(j=i;j>i-InpRVIPeriod;j--)
        {
         dValueUp=Close[j]-Open[j]+2*(Close[j-1]-Open[j-1])+2*(Close[j-2]-Open[j-2])+Close[j-3]-Open[j-3];
         dValueDown=High[j]-Low[j]+2*(High[j-1]-Low[j-1])+2*(High[j-2]-Low[j-2])+High[j-3]-Low[j-3];
         dNum+=dValueUp;
         dDeNum+=dValueDown;
        }
      if(dDeNum!=0.0)
         ExtRVIBuffer[i]=dNum/dDeNum;
      else
         ExtRVIBuffer[i]=dNum;
     }
//--- signal line counted in the 2-nd buffer
   nLimit=InpRVIPeriod+TRIANGLE_PERIOD+2;
   if(prev_calculated>InpRVIPeriod+AVERAGE_PERIOD+2)
      nLimit=prev_calculated-1;
   for(i=nLimit;i<rates_total && !IsStopped();i++)
      ExtSignalBuffer[i]=(ExtRVIBuffer[i]+2*ExtRVIBuffer[i-1]+2*ExtRVIBuffer[i-2]+ExtRVIBuffer[i-3])/AVERAGE_PERIOD;

//--- OnCalculate done. Return new prev_calculated.
   return(rates_total);
  }
//+------------------------------------------------------------------+
기간이 기본값 10으로 설정된 표준 RVI 표시기의 스크린샷이 아래에 붙여넣어져 있습니다.
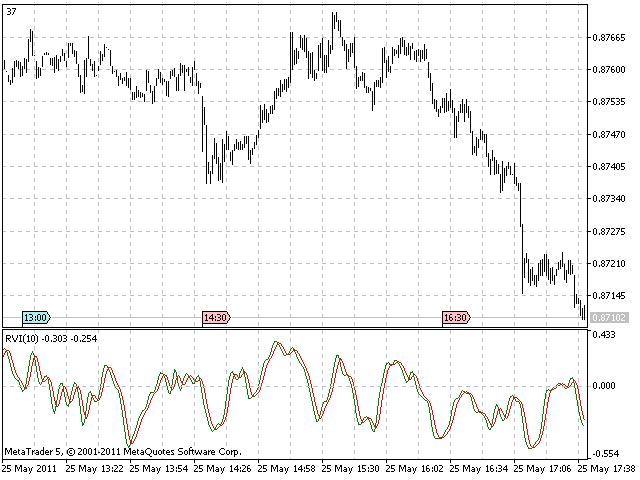
적응형 RVI 인디케이터
앞의 두 적응 표시기와 마찬가지로 CyclePeriod 인디케이터에서 주요 사이클 측정을 추출하여 RVI 주기에 적용해야 합니다. "길이" 변수는 기간의 4 바 가중 이동 평균으로 계산됩니다.
copied=CopyBuffer(hCyclePeriod,0,0,4,CyclePeriod);

if(copied<=0)
  {
   Print("FAILURE: Could not get values from CyclePeriod indicator.");
   return -1;
  }
AdaptiveRVIPeriod = int(floor((4*CyclePeriod[0]+3*CyclePeriod[1]+2*CyclePeriod[2]+CyclePeriod[3])/20.0));
아래에서 어댑티브 RVI 표시기의 전체 소스 코드를 보실 수 있습니다.
//+------------------------------------------------------------------+
//|                                                 Adaptive RVI.mq5 |
//|                        Based on RVI by MetaQuotes Software Corp. |
//|                        Copyright 2009, MetaQuotes Software Corp. |
//|                                              https://www.mql5.com |
//+------------------------------------------------------------------+
#property copyright   "2009, MetaQuotes Software Corp."
#property copyright   "2011, Adaptive version Investeo.pl"
#property link        "https://www.mql5.com"
#property description "Adaptive Relative Vigor Index"
//--- indicator settings
#property indicator_separate_window
#property indicator_buffers 2
#property indicator_plots   2
#property indicator_type1   DRAW_LINE
#property indicator_type2   DRAW_LINE
#property indicator_color1  Green
#property indicator_color2  Red
#property indicator_label1  "AdaptiveRVI"
#property indicator_label2  "Signal"

#define Price(i) ((high[i]+low[i])/2.0)

//--- input parameters
input int InpRVIPeriod=10; // Initial RVI Period
//--- indicator buffers
double    ExtRVIBuffer[];
double    ExtSignalBuffer[];
//---
int hCyclePeriod;
input double InpAlpha=0.07; // alpha for Cycle Period
int AdaptiveRVIPeriod;

#define TRIANGLE_PERIOD  3
#define AVERAGE_PERIOD   (TRIANGLE_PERIOD*2)
//+------------------------------------------------------------------+
//| Custom indicator initialization function                         |
//+------------------------------------------------------------------+
int OnInit()
  {
//--- indicator buffers mapping
   SetIndexBuffer(0,ExtRVIBuffer,INDICATOR_DATA);
   SetIndexBuffer(1,ExtSignalBuffer,INDICATOR_DATA);
   IndicatorSetInteger(INDICATOR_DIGITS,3);
   hCyclePeriod=iCustom(NULL,0,"CyclePeriod",InpAlpha);
   if(hCyclePeriod==INVALID_HANDLE)
     {
      Print("CyclePeriod indicator not available!");
      return(-1);
     }

//--- sets first bar from what index will be drawn
   PlotIndexSetInteger(0,PLOT_DRAW_BEGIN,(InpRVIPeriod-1)+TRIANGLE_PERIOD);
   PlotIndexSetInteger(1,PLOT_DRAW_BEGIN,(InpRVIPeriod-1)+AVERAGE_PERIOD);
//--- name for DataWindow and indicator subwindow label
   IndicatorSetString(INDICATOR_SHORTNAME,"AdaptiveRVI");
   PlotIndexSetString(0,PLOT_LABEL,"AdaptiveRVI");
   PlotIndexSetString(1,PLOT_LABEL,"Signal");
//--- initialization done
  return 0;
  }
//+------------------------------------------------------------------+
//| Relative Vigor Index                                             |
//+------------------------------------------------------------------+
int OnCalculate(const int rates_total,const int prev_calculated,
                const datetime &Time[],
                const double &Open[],
                const double &High[],
                const double &Low[],
                const double &Close[],
                const long &TickVolume[],
                const long &Volume[],
                const int &Spread[])
  {
   int    i,j,nLimit;
   double dValueUp,dValueDown,dNum,dDeNum;
   double CyclePeriod[4];
   int copied;

   copied=CopyBuffer(hCyclePeriod,0,0,4,CyclePeriod);

         if(copied<=0)
           {
            Print("FAILURE: Could not get values from CyclePeriod indicator.");
            return -1;
           }
   AdaptiveRVIPeriod = int(floor((4*CyclePeriod[0]+3*CyclePeriod[1]+2*CyclePeriod[2]+CyclePeriod[3])/20.0));
//--- check for bars count
   if(rates_total<=AdaptiveRVIPeriod+AVERAGE_PERIOD+2) return(0); // exit with zero result
//--- check for possible errors
   if(prev_calculated<0) return(0); // exit with zero result
//--- last counted bar will be recounted
   nLimit=AdaptiveRVIPeriod+2;
   if(prev_calculated>AdaptiveRVIPeriod+TRIANGLE_PERIOD+2)
      nLimit=prev_calculated-1;
//--- set empty value for uncalculated bars
   if(prev_calculated==0)
     {
      for(i=0;i<AdaptiveRVIPeriod+TRIANGLE_PERIOD;i++) ExtRVIBuffer[i]=0.0;
      for(i=0;i<AdaptiveRVIPeriod+AVERAGE_PERIOD;i++)  ExtSignalBuffer[i]=0.0;
     }
//--- RVI counted in the 1-st buffer
   for(i=nLimit;i<rates_total && !IsStopped();i++)
     {
      copied=CopyBuffer(hCyclePeriod,0,rates_total-i-1,4,CyclePeriod);

         if(copied<=0)
           {
            Print("FAILURE: Could not get values from CyclePeriod indicator.");
            return -1;
           }
      AdaptiveRVIPeriod = int(floor((4*CyclePeriod[0]+3*CyclePeriod[1]+2*CyclePeriod[2]+CyclePeriod[3])/20.0));
      dNum=0.0;
      dDeNum=0.0;
      for(j=i;j>MathMax(i-AdaptiveRVIPeriod, 3);j--)
        {
         //Print("rates_total="+IntegerToString(rates_total)+" nLimit="+IntegerToString(nLimit)+
         //      " AdaptiveRVIPeriod="+IntegerToString(AdaptiveRVIPeriod)+" j="+IntegerToString(j));
         dValueUp=Close[j]-Open[j]+2*(Close[j-1]-Open[j-1])+2*(Close[j-2]-Open[j-2])+Close[j-3]-Open[j-3];
         dValueDown=High[j]-Low[j]+2*(High[j-1]-Low[j-1])+2*(High[j-2]-Low[j-2])+High[j-3]-Low[j-3];
         dNum+=dValueUp;
         dDeNum+=dValueDown;
        }
      if(dDeNum!=0.0)
         ExtRVIBuffer[i]=dNum/dDeNum;
      else
         ExtRVIBuffer[i]=dNum;
     }
//--- signal line counted in the 2-nd buffer
   nLimit=AdaptiveRVIPeriod+TRIANGLE_PERIOD+2;
   if(prev_calculated>AdaptiveRVIPeriod+AVERAGE_PERIOD+2)
      nLimit=prev_calculated-1;
   for(i=nLimit;i<rates_total && !IsStopped();i++)
    ExtSignalBuffer[i]=(ExtRVIBuffer[i]+2*ExtRVIBuffer[i-1]+2*ExtRVIBuffer[i-2]+ExtRVIBuffer[i-3])/AVERAGE_PERIOD;

//--- OnCalculate done. Return new prev_calculated.
   return(rates_total);
  }
//+------------------------------------------------------------------+
동적 윈도우 길이를 가진 적응형 RVI 인디케이터의 스크린 샷.
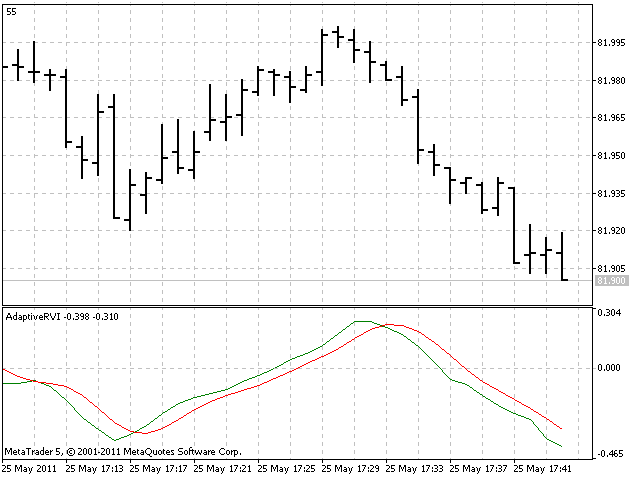
마치며
지금까지 이 문서에서는 세 가지 적응형 기술 인디케이터의 행동 양식과 MQL5로 구현하는 법에 대해서 살펴보았습니다.
문서를 다 읽으신 후라면 적응형 인디케이터를 구현하기 위한 메커니즘이 이제 이해가 되실 것입니다. 본문 중에서 다룬 인디케이터는 모두 첨부파일에서 확인하실 수 있습니다.
저는 이미 사용 가능한 것을 이용해보신 후에 다른 적응형 인디케이터를 가지고 실험을 해보시거나 구축해보시는 것을 권장드립니다.
MetaQuotes 소프트웨어 사를 통해 영어가 번역됨
원본 기고글: https://www.mql5.com/en/articles/288
경고: 이 자료들에 대한 모든 권한은 MetaQuotes(MetaQuotes Ltd.)에 있습니다. 이 자료들의 전부 또는 일부에 대한 복제 및 재출력은 금지됩니다.
이 글은 사이트 사용자가 작성했으며 개인의 견해를 반영합니다. Metaquotes Ltd는 제시된 정보의 정확성 또는 설명 된 솔루션, 전략 또는 권장 사항의 사용으로 인한 결과에 대해 책임을 지지 않습니다.
 시계열 주요 특성의 분석
 천재반을 위한 MQL5 Wizard
 지수 평활을 이용한 시계열 예측
 Expert Advisor 최적화 시 커스텀 조건 만들기
누구든지 기사에 나와있는 6의 간격 기간을 63으로 변경하는 방법을 알고 있습니까?
미리 감사드립니다.
나는누군가가 같은 의심을 가지고 있다면주기 기간의 코드에서"DC = (6.28318 / MedianDelta)+0.5;" 이 방정식에서 원가 6.28318과 계산 번호 0.5를 다른 다른 변경에 대한 가변주기를 변경하는 방법을 알아 냈습니다.
기사에 실수가 있거나델타 위상을 <0.1, 1.1> 사이로 제한하고 코드에서는 <0.1, 0.9> 사이로 설명하는 이유가 명확하지 않다는 것을 깨달았습니다.
이것은 제 의심과 생각 일 뿐이지만 훌륭한 기사라고 말하고 싶습니다.
감사합니다.
게시글 MQL5의 고급 적응형 지표 이론 및 구현:
저자: investeo
수고하셨습니다, investeo,
힐버트 변환에서 위상 및 직교 공식을 수학적으로 구하는 방법에 대한 힌트를 주실 수 있나요?
노력 중인데 잘 안 풀리네요.
고마워요
이 MQL5 지표를 MQL4에서 사용할 수 있나요?
아니요! MQL4에서 작동하려면 코드를 변환하고 조정해야 합니다.