• 概要
  • レビュー
  • コメント

Smart Signals


Introducing Smart Signals - Your Ultimate Expert Advisor for Precise Market Analysis and Trading Automation

Are you tired of spending countless hours analyzing market charts, looking for profitable trading opportunities? Look no further! Smart Signals is the expert advisor you've been searching for. With its advanced features and user-friendly interface, Smart Signals empowers traders to make informed decisions and automate their trading strategies effortlessly.


Key Features:

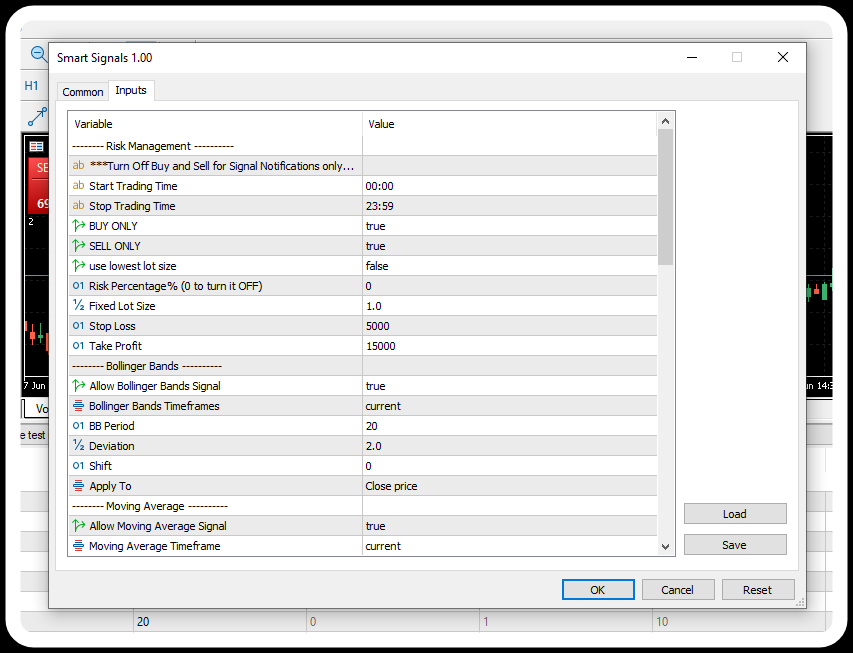
1. Multiple Indicator Integration: Smart Signals combines the power of various indicators to provide accurate and timely signals.

  • Moving Average: If Fast MA cross Slow MA, signal will be triggered-
  • RSI:  If rsi reaches overbought/oversold levels, signal will be triggered
  • Bollinger Bands: if the price touches upper or lower bands, signal will be triggered
  • Stochastic: if stochastic reaches overbought/oversold levels, signal will be triggered
  • ADX: if adx cross level and filtered with +DI and -DI for trend guidance, signal will be triggered
  • MACD: if macd crosses above sell level or below buy level(default 0)

you can choose the ones that align with your trading style and preferences.


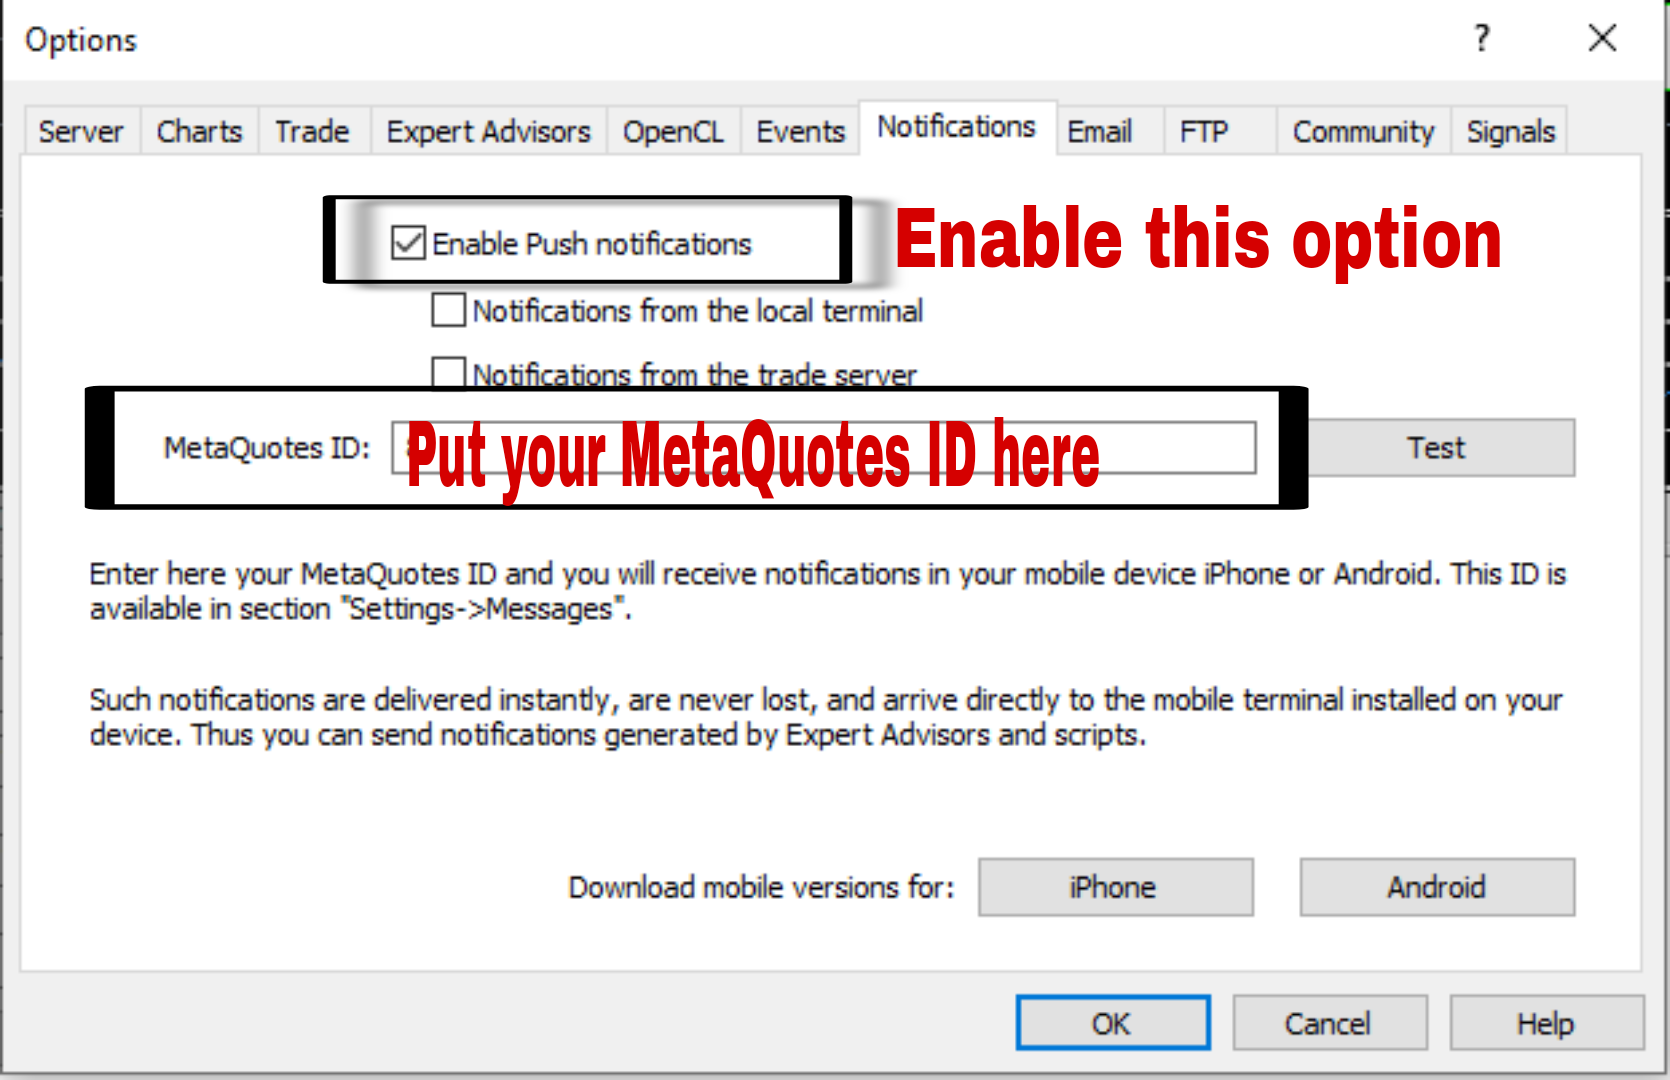
2. Reliable Signal Generation: Don't miss out on potential trading opportunities. Smart Signals scans the market continuously, keeping a watchful eye on the selected indicators. When a signal is detected, you'll be instantly notified, ensuring that you never overlook a lucrative trade setup again. Stay ahead of the market with timely and accurate signals.

3. Customizable Trading Preferences: Smart Signals understands that every trader has unique strategies and risk appetites. You have the flexibility to customize the EA according to your preferences. If you prefer to manually execute trades, Smart Signals can provide you with reliable signals for analysis. On the other hand, if you prefer a more hands-off approach, you can grant Smart Signals permission to execute trades on your behalf, following your predefined rules and risk management settings.

4. Time Filter: Smart Signals offers a convenient time filter feature that allows you to define specific trading hours. By setting your preferred trading window, you can ensure that Smart Signals generates signals exclusively during that period. This feature is particularly beneficial for traders who have specific times when they want to focus on the market, eliminating unnecessary notifications outside of their preferred trading hours.

5. Time-Saving Automation: Bid farewell to the tedious hours spent on chart analysis. Smart Signals automates the process, saving you valuable time and effort. By harnessing the power of cutting-edge technology, you can free yourself from mundane tasks and focus on strategic decision-making, improving your overall trading efficiency.


Don't miss the opportunity to streamline your trading activities with Smart Signals. Invest in this powerful expert advisor today and unlock a new level of trading precision and automation. Boost your trading success and achieve your financial goals with Smart Signals by your side.


おすすめのプロダクト
A useful feature may be to determine the normal frequency of round-sized trades, and monitor deviations from that expected value. The ML algorithm could, for example, determine if a larger-than-usual proportion of round-sized trades is associated with trends, as human traders tend to bet with a fundamental view, belief, or conviction. Conversely, a lower-than-usual proportion of round-sized trades may increase the likelihood that prices will move sideways, as silicon traders do not typically hol
VWAP Cloud
Flavio Javier Jarabeck
4.38 (13)
Do you love VWAP? So you will love the VWAP Cloud . What is it? Is your very well known VWAP indicator plus 3-levels of Standard Deviation plotted on your chart and totally configurable by you. This way you can have real Price Support and Resistance levels. To read more about this just search the web for "VWAP Bands" "VWAP and Standard Deviation". SETTINGS VWAP Timeframe: Hourly, Daily, Weekly or Monthly. VWAP calculation Type. The classical calculation is Typical: (H+L+C)/3 Averaging Period
FREE
Apresentação:  - O Indicador "VWAP Contínua" da CIT Group é um indicador especializado na bolsa brasileira (B3). Objetivo:  - Especificamente desenvolvido para o perfil de pessoas que operam IntraDay. Funcionamento:  - Calculado com base nos trades realizados durante o pregão, sendo atualizado a cada 1 segundo, tendo maior precisão dos preços Funcionalidades:  - Entrega de até 5 VWAPs simultâneas, onde as 4 primeiras são configuráveis, e a última é fixa sendo a diária  - Opção para visualiz
Utilities
Douglas Lucio De Araujo
Indicator with 3 features - Clock : Clock independent of the chart, counting continues even when the market is closed. - Template : After setting up a configuration in any graphic, be it color patterns, indicators, zoom ... The configuration will be copied to all active graphics. - TimeFrame : Set the TimeFrame on a chart, and with just one click all the active charts will be changed to the same TimeFrame.
Rush Point Histogram Continuity force indicator. Operation: After a breach of support or resistance of an asset, the trader can understand by reading the histogram if such a move tends to continue, thus filtering false breaks or short breaks without trend formation. Through a simple, level-based reading, the trader can make a decision based on the histogram, where: Below 21: No trend formation 21 to 34: Weak trend 34 to 55: Strong Trend 55 to 89: Strong tendency Suggested Reading: Observed disru
Here I present you this awesome indicator I made. This is a nique combination witch puts you in the same level as MM's. So you can surf a lot of waves and identify the rally time, breakouts, and the perfect time to get in the market. ---- The SSL Channel is a great all-rounder based on 2 Simple Moving Averages, one of recent Highs, one of recent Lows. The calculation prints a   channel   on the chart consisting of 2 lines. This strategy gives a Long signal when price closes above the top of the
Day Points Indicadtor that shows the points considered important for X days. (Open,Close, High, Low) Used a lot by those who do day trade. These points can be used for decision making by a trader. You will choose the amount of days ago for it to show. Settings High/Low/Close/Open Show - True/False. Days - Number of days that will show on the chart. Color - Line Color. Style - Line Style.
このインジケーターを使用すると、フィボナッチレベルのラベルを大きなフォントサイズで表示できます。 。 最大 25 のフィボナッチレベルをサポートします - フィボナッチを描画するとすぐに、入力パラメータとして追加したレベルが、選択した色とフォントの大きなフォント サイズで表示されます。 カスタマイズ可能なオプション: 1.フィボテキストフォント 2.フィボテキストサイズ 3.フィボテキストの色 3. 各レベルに説明を追加します 4. アンカーや度数などのその他のオプション このインジケーターを使用すると、フィボナッチレベルのラベルを大きなフォントサイズで表示できます。 。 最大 20 のフィボナッチレベルをサポートします - フィボナッチを描画するとすぐに、入力パラメータとして追加したレベルが、選択した色とフォントの大きなフォント サイズで表示されます。 カスタマイズ可能なオプション: 1.フィボテキストフォント 2.フィボテキストサイズ 3.フィボテキストの色 3. 各レベルに説明を追加しま
Phi Cubic Fractals Pack1A with FuTuRe   PACK 1A é uma melhoria sobre o Pack 1 que inclui a possibilidade de selecionar as linhas LINE 4/8/17/34/72/144/305/610 individualmente. Este produto contém os indicadores do PACK 1A (Lines + LineSAR + Channels + BTL + Ladder) + MODO FUTURO Phi Lines  - medias moveis especiais, semelhantes às MIMAs do Phicube, capazes de indicar com muita clareza tanto a tendencia como a consolidação; Phi LineSAR  - apaga ou destaca as Phi Lines para mostrar apenas as linha
Analisa Segundo
Marcio Sales Santana
4 (1)
Analisador de Segundos, exibição de sinais e formação de padrões. Alteração a precisão do tempo em: Ferramentas --> Opções --> Aba Graficos --> item: Escola de Tempo Precisa. / --> indica uma compra \ --> indica uma venda "-" --> indica um movimento de indecisão. ^ --> indica um esforço dos compradores para manter e ou reverter a direção do mercado. _ -->  indica um esforço dos vendedores para manter e ou reverter a direção do mercado. As linhas de compra e venda tenta indicar o real spread do
FREE
市場構造は、より高い時間枠でのブレイクアウトがトレーダーにトレンドをクリアするのに役立つ可能性があるものです. 1. このインディケータは最後の 2 つの構造 (ZigZag の前の高値と安値) のみに ZigZag を描画し、ZigZag の新しいバーは構造のブレークが発生したときにのみ形成されます。 2. 構造体の破壊時にターミナルとプッシュ通知を提供 3. [ と ] キーから ZigZag の Extdepth を増減して、スイングを調整します。 4. Line AB BC と CD の色を変える 5.多くのチャートに追加し、複数のシンボルでアラートを取得します Break of Structure Multi ExtDepth Breakout Multi Symbol Scanner を探している場合は、この製品を使用できます。 Multi Symbol Multi ExtDepth ZigZag Breakout Scanner
Candle Timer 2X
Ronaldo Franco De Oliveira Cardoso
5 (4)
The RFOC Candle Timer 2x was created for the trader to locate himself in time, having access to the pending time for the formation of a new candle. Additionally, it is possible to include in the chart a second timer that shows the pending time for the formation of a new candle in a time period different from the current one.   The user will have the option to select up to 4 different positions for the timer display ("No candle", lower left corner, lower right corner or upper right corner). In ad
FREE
KT DMA is a modified and advanced version of the classic Displaced Moving Averages with buy/sell crossover alerts and a Multi-Timeframe scanner that shows DMA's direction across each real-time time frame. A Displaced Moving Average is a simple moving average that moves ahead or backward in a time frame (either short-term or long-term). It also allows you to predict price movement more accurately. Features Depicts the trend direction using the alignment of three moving averages. Buy/Sell signa
VWAP Bands Indicator
Hilario Henrique Silva Ribeiro
4.69 (13)
Do you know VWAP Bands? It is an indicator used to identify support and resistance points from the daily VWAP and you can use it to check the best entry and exit points. This indicator does not use the principle of bollinger bands. There is a difference in the calculation method. Use it according to your strategy. See the applications and what results you can get. The indicator is free and can be used on any account.
FREE
PACK 2 do Phi Cubic Fractals com opção para extender os indicadores no FUTURO, para o lado direito do gráfico Este produto contem os indicadores do   PACK 2 (ROC full / SAINT 8 / SAINT 17 / SAINT 34 / SAINT 72 ) + MODO FUTURO Phi ROC - indicador do tipo oscilador, semelhante ao MIMAROC, que é capaz de mostrar a direção e a força do mercado, bem como determinar o ponto de entrada ótimo; Phi SAINT - indicador do tipo oscilador, semelhante ao SANTO do Phicube, que é capaz de mostrar a direção e a
KT De Munyuk MT5
KEENBASE SOFTWARE SOLUTIONS
The KT De Munyuk is a trend-based indicator that uses   Parabolic SAR   to identify the market direction. The indicator shows the PSAR in the form of green/red dots using a separate window. Buy Signal:   When a green dot appears after a series of at least three red dots. Buy Exit:   When a red dot appears on the current or next higher time frame. Sell Signal:   When a red dot appears after a series of at least three green dots. Sell Exit:   When a green dot appears on the current or next higher
The Rocket Trend indicator is trending. The indicator draws two-color points connected by lines along the chart. This is a trend indicator, it is an algorithmic indicator. It is easy to work and understand when a blue circle appears, you need to buy, when a red one appears, sell. The indicator is used for scalping and pipsing, and has proven itself well. Rocket Trend is available for analyzing the direction of the trend for a specific period of time. Ideal for novice traders learning the laws o
範囲の枯渇は、価格が現在の期間の予想される範囲を満たすか超えると発生します。これらのレベルでは、価格は期間の初期に比べて勢いを失い始めるため、新しいポジションをとっていないことを確認するのに良いポイントです. このインジケーターは、チャート上でこれが発生する可能性が高い場所を示し、日次、週次、月次の期間のレベルを示します。 価格がこれらの枯渇レベルを超えている場合は、動きの背後にある勢いが非常に強く、より高い時間枠レベルに向かっている可能性が高いことを示しています. インジケーターは、好みに応じて、Average True Range (ATR) または Average Range (ADR) 計算を使用できます。デフォルトでは、外国為替チャートでよりうまく機能することがわかっているため、ATR を使用しますが、ADR は株式ベースのインデックスとシンボルで優位に立っています。 インジケーターには、以下で説明するいくつかの描画モードがあり、ニーズに合わせて調整できます。 設定 計算モード レベルの計算には、AverageTrueRange (ATR) または AverageDai
Hunt markets with Hunttern ZigZag . Easy to use with one parameter    You can use it for the following:       -Classic patterns       -Heads and shoulders       -Harmonic patterns       -Elliott Wave       -Support and resistance       -Supply and Demand Single parameter:      -Period (1-120) Features:        -Candle time        -Single parameter        -Light mode template This is version 1 of Hunttern ZigZag. We are very happy to receive feedback from you.
FREE
Trendy Stocks
Innovicient Limited
5 (2)
Trendy Stock is a price following indicator that uses Stochastic to show when the price is out of the oversold or overbought areas.  The algorithm allows you to stay longer in a trend where the bulls or bears are in control. The indicator changes color immediately the price exits oversold/overbought state. In short, the downtrend [red] bars start to paint when the buying pressure decreases while the uptrend [green] bars form as the buy pressure kicks in.    For MT4 version, follow :: https://www
FREE
Necessary for traders: tools and indicators Waves automatically calculate indicators, channel trend trading Perfect trend-wave automatic calculation channel calculation , MT4 Perfect trend-wave automatic calculation channel calculation , MT5 Local Trading copying Easy And Fast Copy , MT4 Easy And Fast Copy , MT5 Local Trading copying For DEMO Easy And Fast Copy , MT4 DEMO Easy And Fast Copy , MT5 DEMO The homeopathic indicator is also called the CCI indicator. The CCI indicator was propos
FREE
Tomamos 5 medios móviles las unimos en una la cual suavizamos y volvemos a suavizar, resultando un mega suavizador de medios móviles suavizadas. Indicador de mql5 funciona en cualquier broker y para todos los tiempos, siendo el mas optimo el de 5, 15 a mas. Funciona mejor en grupo consigo misma osea poner uno de 14 y otro de 50 y 400,, así se observa mejor su desempeño.
Midpoint Bands
Emanuel Cavalcante Amorim Filho
Midpoint Bands   is a   channel-like   indicator that draws two lines on the chart - an upper band and a lower band, pointing out possible reversal levels. This is one of the indicators used in the Sapphire Strat Maker - EA Builder. Sapphire Strat Maker - EA Builder:  https://www.mql5.com/en/market/product/113907 The bands are simply calculated like this: Upper Band   = (HighestHigh[N-Periods] + LowestHigh[N-Periods])/2  Lower Band   = (LowestLow[N-Periods] + HighestLow[N-Periods])/2
FREE
Rejection Zones
Paulo Henrique Faquineli Garcia
Este poderoso indicador analisa o gráfico e mostra zonas de Rejeição de Preços! Isto é, locais onde o preço foi, mas não foi aceito pelo mercado! A visualização desta zona de Rejeição, facilita o entendimento do trader na tomada de decisões de onde operar e como operar! O indicador é composto por 4 linhas, sendo classificadas em 2 grupos: Linhas Vermelha e Amarela: Denotam os extremos onde o preço conseguiu chegar, mas não foi aceito! Linhas Laranja e Azul: A partir delas, denotam o Início da
FREE
Introduction to Fractal Pattern Scanner Fractal Indicator refers to the technical indicator that makes use of the fractal geometry found in the financial market. Fractal Pattern Scanner is the advanced Fractal Indicator that brings the latest trading technology after the extensive research and development work in the fractal geometry in the financial market. The most important feature in Fractal Pattern Scanner is the ability to measure the turning point probability as well as the trend probabil
Cybertrade Keltner Channels - MT5 Created by Chester Keltner, this is a volatility indicator used by technical analysis. It is possible to follow the trend of financial asset prices and generate support and resistance patterns. In addition, envelopes are a way of tracking volatility in order to identify opportunities to buy and sell these assets. It works on periods longer than the period visible on the chart. All values ​​are available in the form of buffers to simplify possible automations.
FREE
Institutional Pivot is a result of 5 years of research on order flow analysis in the Forex market and Nasdaq, seeking mounting and defense positions. The one of the best support and resistance points you can have right now available to everyone. You can opt for the Forex, CME and Brazilian markets in the settings Choosing the market just plot on the chart to make your trades
Velas MTF
Juan Manuel Rojas Perez
5 (1)
Velas Multi Time Frame Las velas multi time frame, también conocidas como "MTF candles" en inglés, son un indicador técnico que permite visualizar velas japonesas de un marco temporal diferente al marco temporal principal en el que estás operando. Este enfoque ofrece una perspectiva más amplia del comportamiento del precio, lo que resulta especialmente útil para los traders que emplean estrategias de acción del precio. A continuación, se detallan los conceptos clave relacionados con este indi
FREE
Bollinger Bands B
Flavio Javier Jarabeck
5 (3)
John Bollinger created this indicator in 2010 as a way to read the original indicator (Bollinger Bands) in a more "technical" way, shown as an oscillator. The typical range of the Bollinger Bands %B is 0 - 0.5 - 1.0, where "0" represents the lower band, the "0.5" the middle band, and "1" the upper band. The line on the indicator represents the Closing prices. As simple as that. SETTINGS Bollinger Bands period of analysis Standard Deviation multiplier Shift Price type to be analyzed If you
FREE
Strategy Builder offers an incredible amount of functionality. It combines a trade panel with configurable automation (covert indicators into an EA), real-time statistics (profit & draw down) plus automatic optimization of SL, TP/exit, trading hours, indicator inputs. Multiple indicators can be combined into an single alert/trade signal and can include custom indicators, even if just have ex4 file or purchased from Market. The system is easily configured via a CONFIG button and associated pop-u
このプロダクトを購入した人は以下も購入しています
Trade Assistant MT5
Evgeniy Kravchenko
4.4 (172)
取引 ごとのリスクの 計算、新規注文 の 簡単 な 設置、部分的 な 決済機能 を 持 つ 注文管理、 7 種類 のトレーリングストップなど 、便利 な 機能 を 備 えています 。 注意、アプリケーションはストラテジーテスターでは機能しません。 説明ページからデモ版をダウンロードできます  Manual, Description, Download demo ライン機能 チャート上にオープニングライン、ストップロス、テイクプロフィットを表示します。この機能により、新規注文を簡単に設定することができ、注文を出す前にその特徴を確認することができます。   リスク計算 リスク計算機能は、設定されたリスクとストップロス注文のサイズを考慮して、新規注文のボリュームを計算します。ストップロスの大きさを自由に設定できると同時に、設定したリスクを守ることができます。 Lot calc ボタン - リスク 計算 を 有効 / 無効 にします 。 Risk フィールドでは 、必要 なリスクの 値 を 0 から 100 までのパーセンテージまたは 預金通貨 で 設定 します 。 設定」 タブで 、
価格が一瞬で変わる可能性のある市場では、注文はできるだけ簡単にすべきだと思いますか? Metatraderでは、注文を開くたびに、開始価格を入力し、損失を止めて利益を得るウィンドウと、取引サイズを開く必要があります。金融市場の取引では、初期預金を維持し、それを増やすために資本管理が不可欠です。それで、あなたが注文をしたいとき、あなたはおそらくあなたがどれくらいの大きさの取引を開くべきか疑問に思いますか?この単一の取引であなたの預金の何パーセントを危険にさらすべきですか?この取引からどれだけの利益を得ることができますか?また、リスクに対する利益の比率はどのくらいですか?トレードサイズを設定する前に、トレードサイズがどうあるべきかという質問に対する答えを得るために必要な計算を行います。 これらすべてを自動的に行うツールがあると想像してみてください。チャートを開き、市場分析を行い、エントリーポイント、ディフェンスポイント(ストップロス)、ターゲット(テイクプロフィット)を水平線でマークし、最後にリスクのレベルを定義します。利用可能な資本の%として、このトランザクションで負担することができ、こ
Local Trade Copier EA MT5
Juvenille Emperor Limited
5 (64)
Local Trade Copier EA MT5 による、驚くほど高速な取引コピーを体験してください。1分で簡単にセットアップできるこの取引コピー機は、同じWindowsコンピュータまたはWindows VPS上の複数のMetaTrader端末間で取引をコピーすることができ、0.5秒未満の高速コピースピードを実現します。 初心者であろうとプロのトレーダーであろうと、 Local Trade Copier EA MT5 には、あなたの特定のニーズに合わせてカスタマイズするための幅広いオプションが用意されています。これは、利益の可能性を高めたい人にとって究極のソリューションです。 今すぐ試してみて、これが市場で最も速くて簡単なトレードコピー機である理由を理解してください。 ヒント: デモアカウントで Local Trade Copier EA MT5 デモバージョンをダウンロードして試すことができます: ここ ダウンロードした無料のデモ ファイルを MT5 >> ファイル >> データ フォルダを開く >> MQL5 >> Experts フォルダに貼り付けて、ターミナルを再起動し
TradePanel MT5
Alfiya Fazylova
4.86 (114)
Trade Panel は、多機能の取引アシスタントです。 このアプリケーションには手動取引用の 50 以上の機能が含まれており、ほとんどの取引アクションを自動化できます。 購入する前に、デモ アカウントでデモ バージョンをテストできます。 デモは こちら から。 詳しい手順は こちら をご覧ください。 取引。 ワンクリックで基本的な取引操作を実行できます。 未決の注文とポジションをオープンする 未決の注文とポジションを決済する ポジションの反転(買いを閉じて売りをオープンする、または売りを閉じて買いをオープンする) ポジションをロックする(反対のポジションをオープンすることで、売りポジションと買いポジションの量を等しくします) すべてのポジションを部分的に決済します。 すべてのポジションのテイクプロフィットやストップロスを共通のレベルに設定します。 すべてのポジションのストップロスを損益分岐点レベルに設定します。 注文とポジションをオープンする際に、次のことが可能になります。 確立されたリスクに応じて取引量の自動計算を使用します。 ワンクリックで複数の注文を開きます。 計算された数量
The product will copy all telegram signal to MT5 ( which you are member) , also it can work as remote copier.  Easy to set up, copy order instant, can work with almost signal formats, image signal,  s upport to translate other language to English Work with all type of channel or group, even channel have "Restrict Saving Content", work with  multi channel, multi MT5 Work as remote copier: with signal have ticket number, it will copy exactly via ticket number. Support to backtest signal. How to s
Для оплаты рублями/криптой используйте Webmoney. Задай цели для цены, а для всего остального есть HINN Lazy Trader!   Инструмент предназначен для автоматического набора позиций от заданных уровней к заданным целям. Рекомендуется использовать VPS (*) Разработан для минимизации времени, проводимым за чартом, максимизации охвата торговых идей без необходимости контролировать что-либо. Призван стать идеальным инструментом для делегирования рутины, переложить бремя принятия решения и эмоциональный
Trade Manager は、リスクを自動的に計算しながら、取引を迅速に開始および終了するのに役立ちます。 過剰取引、復讐取引、感情的な取引を防止する機能が含まれています。 取引は自動的に管理され、アカウントのパフォーマンス指標はグラフで視覚化できます。 これらの機能により、このパネルはすべてのマニュアル トレーダーにとって理想的なものとなり、MetaTrader 5 プラットフォームの強化に役立ちます。多言語サポート。 MT4バージョン  |  ユーザーガイド + デモ Trade Manager はストラテジー テスターでは機能しません。 デモについてはユーザーガイドをご覧ください。 危機管理 % または $ に基づくリスクの自動調整 固定ロットサイズを使用するか、ボリュームとピップに基づいた自動ロットサイズ計算を使用するオプション RR、Pips、または価格を使用した損益分岐点ストップロス設定トレーリングストップロス設定 目標に達したときにすべての取引を自動的に終了するための 1 日あたりの最大損失 (%)。 過度のドローダウンからアカウントを保護し、オーバートレードを防ぎます
YuClusters
Yury Kulikov
4.93 (43)
Attention: You can view the program operation in the free version  YuClusters DEMO .  YuClusters is a professional market analysis system. The trader has unique opportunities to analyze the flow of orders, trade volumes, price movements using various charts, profiles, indicators, and graphical objects. YuClusters operates on data based on Time&Sales or ticks information, depending on what is available in the quotes of a financial instrument. YuClusters allows you to build graphs by combining da
Tired of complex order placement and manual calculations? Trade Dashboard is your solution. With its user-friendly interface, placing orders becomes effortless, by a single click, you can open trades, set stop loss and take profit levels, manage trade lot size, and calculate risk to reward ratios, allowing you to only focus on your strategy. Say goodbye to manual calculations and streamline your trading experience with Trade Dashboard. Download   demo version   right now. You can find   deta
Trade copier MT5
Alfiya Fazylova
4.37 (27)
Trade Copierは、取引口座間の取引をコピーして同期するように設計された専門的なユーティリティです。 コピーは、同じコンピューターまたはvps にインストールされている、サプライヤーのアカウント/端末から受信者のアカウント/端末に行われます。 購入する前に、デモ アカウントでデモ バージョンをテストできます。 デモ版 こちら 。 詳細な説明は こちら 。 主な機能と利点: MT5ネッティングアカウントを含む、MT5> MT5、MT4> MT5、MT5> MT4のコピーをサポートします。 高いコピー速度(0.5秒未満)。 ベンダーモードと受信者モードは同じ製品内に実装されています。 チャートから直接リアルタイムでコピーを制御できる、簡単で直感的なインターフェイス。 接続が切断されたり、端末が再起動されたりしても、設定と位置が失われることはありません。 コピーするシンボルを選択できます。また、受信者のシンボルを置き換えることもできます(例:EURUSD> USDJPY)。 バックコピーをサポートします。 特定の注文のみのコピーを有効にする機能。 取引開始価格の最大差と最大遅延時間を
Mentfx Mmanage mt5
Anton Jere Calmes
4.43 (7)
The added video will showcase all functionality, effectiveness, and uses of the trade manager. Drag and Drop Trade Manager. Draw your entry and have the tool calculate the rest. Advanced targeting and close portions of a trade directly available in tool (manage trades while you sleep). Market order or limit order on either side with factored spread. Just draw the entry, the tool does the rest. Hotkey setup to make it simple. Draw where you want to enter, and the stop loss, the tool calculates al
OrderManager をご紹介:MT5用の革新的なユーティリティ 新しく設計されたOrder Managerユーティリティを使用して、MetaTrader 5での取引をプロフェッショナルなものにしましょう。シンプルさと使いやすさに焦点を当てたこのユーティリティは、各取引に関連するリスクを簡単に定義し、視覚化できます。これにより、情報に基づいた意思決定が可能になり、取引戦略を最適化できます。OrderManagerに関する詳細は、マニュアルをご参照ください。 [ マニュアル ] [ MT4 バージョン ] [ Telegram チャンネル ] 主な特長: リスク管理:取引のリスクを素早く簡単に定義し、より良い意思決定を行い、取引パフォーマンスを向上させます。 視覚表現:オープンなポジションとそれに関連するリスクをグラフィカルに表示し、明瞭かつ簡潔な理解が可能です。 注文変更:数回のクリックで注文を簡単に変更またはクローズし、取引プロセスを効率化し、貴重な時間を節約します。 手のひらの上の最新ニュース:ボタン一つで最新の市場ニュースに常にアクセスできます。 MT5トレーダーにと
Pro Arbitrage EA   trades based on Arbitrage Strategy. The strategy is like a scalping technology but on three cross currency pairs at the same time. Each trade basket involves three pairs (all open at the same time) and they will close at once when any desired profit reaches. The strategy has no SL technically because all opened currencies are hedged. SL can happen if high slippages on order execution on the broker side. So the strategy is one of the safest ones in the world. Using the EA : U
MT5 to Telegram Signal Provider は、Telegramのチャット、チャンネル、またはグループに 指定された シグナルを送信することができる、完全にカスタマイズ可能な簡単なユーティリティです。これにより、あなたのアカウントは シグナルプロバイダー になります。 競合する製品とは異なり、DLLのインポートは使用していません。 [ デモ ] [ マニュアル ] [ MT4版 ] [ Discord版 ] [ Telegramチャンネル ] セットアップ ステップバイステップの ユーザーガイド が利用可能です。 Telegram APIの知識は必要ありません。必要な全ては開発者から提供されます。 主な特長 購読者に送信する注文の詳細をカスタマイズする機能 例えば、Bronze、Silver、Goldといった階層型のサブスクリプションモデルを作成できます。Goldサブスクリプションでは、すべてのシグナルが提供されます。 id、シンボル、またはコメントによって注文をフィルターできます 注文が実行されたチャートのスクリーンショットが含まれます 追加の
あなたがメンバーである任意のチャネルから(プライベートおよび制限されたものを含む)シグナルを直接あなたのMT5にコピーします。  このツールは、トレードを管理し監視するために必要な多くの機能を提供しながら、ユーザーを考慮して設計されています。 この製品は使いやすく、視覚的に魅力的なグラフィカルインターフェースで提供されています。設定をカスタマイズして、数分で製品を使用を開始できます! ユーザーガイド + デモ  | MT4版 | Discord版 デモを試してみたい場合は、ユーザーガイドにアクセスしてください。 Telegram To MT5 受信機は、ストラテジーテスターで動作しません! Telegram To MT5の特徴 複数のチャネルから一度にシグナルをコピー プライベートおよび制限されたチャネルからシグナルをコピー BotトークンまたはChat IDは必要ありません   (必要に応じて使用することができます) リスク%または固定ロットを使用して取引 特定のシンボルを除外 すべてのシグナルをコピーするか、コピーするシグナルをカスタマイズするかを選択 すべてのシグナ
-25% discount ($199 -> $149) Advanced trading tool: One click smart orders that execute under your conditions Developed by trader for trading community:  position size calculator (lot size), open position after price action, strategy builder, set and forget trading, mobile notifications... Risk Management -  Risk percentage position size calculator, gain percentage, target risk reward ratio, spread and commissions are included in calculations 7 Advanced order types  - Set and forget trading w
UTM Manager は、迅速かつ効率的な取引執行を提供する直感的で使いやすいツールです。際立った機能の 1 つは、「スプレッドを無視」モードです。これにより、スプレッドを完全に無視して、ローソク足の価格で取引できるようになります (たとえば、LTF でより高いスプレッドのペアを取引でき、スプレッドによって取引から除外されるのを回避できます)。 UTM Manager のもう 1 つの重要な側面は、独自のローカル取引コピー機であり、各ブローカーで異なる取引戦略と設定 (たとえば、さまざまな TP、BE、およびリスク ルール) を柔軟に実行できます。 取引執行: 迅速かつ効率的な取引執行: チャート上のエントリー価格とストップロス価格をクリックして簡単に取引を入力するか、ワンクリックの固定ストップロスサイズ機能を使用します。 自動ロットサイズ計算: ロットは事前定義されたリスク設定に基づいて計算され、ドラッグによってポジションが変更されると再計算されます。 1 つまたは複数のポジションを同時に処理できる能力。 利益確定と損益分岐点: 柔軟なテイクプロフィット設定: 特定のリスク対報
-25% discount ($149 -> $111) Everything for chart Technical Analysis indicator mt5 in one tool Draw your supply demand zone with rectangle and support resistance with trendline and get alerts to mobile phone or email alert -  Risk reward indicator mt5 Video tutorials, manuals, DEMO download   here .   Find contacts on my   profile . 1.   Extended rectangles and trendlines Object will be extended to the right edge of the chart when price will draw new candles on chart. This is rectangle extend
The top-selling EAs on the market cost a lot and one day they are suddenly gone. This is because one strategy will not work in the forex market all the time. Our product is unique from all others in the MQL Marketplace because our EA comes with 34+ built-in indicators that allow develop strategies every time.  You build your strategy and keep updating it. If one strategy does not work, simply build another all using only one EA. This is All-In-One EA   in this market place. You can use as trade
This is exactly what the name says. Visual strategy builder . One of a kind. Turn your trading strategies and ideas into Expert Advisors without writing single line of code. Generate mql source code files with a few clicks and get your fully functional Expert Advisors, which are ready for live execution, strategy tester and cloud optimization. There are very few options for those who have no programming skills and can not create their trading solutions in the MQL language. Now, with Bots Build
ワンクリックで取引できるトレーディングパネル。ポジションと注文の操作!チャートまたはキーボードから取引。 当社の取引パネルを使用すると、チャートから直接シングルクリックで取引を実行でき、標準の MetaTrader コントロールよりも 30 倍高速に取引操作を実行できます。 パラメータと関数の自動計算により、トレーダーにとって取引がより速く、より便利になります。 グラフィックのヒント、情報ラベル、取引取引に関する完全な情報はチャート MetaTrader にあります。 MT4のバージョン 完全な説明   +DEMO +PDF 購入する方法 インストールする方法     ログファイルの取得方法     テストと最適化の方法     Expforex のすべての製品 手動取引用の取引パネル。チャート(チャートウィンドウ)またはキーボードから取引できます。  開閉、リバース、ロックポジションと注文を処理する МetaТrader5 のメインオーダーのトレーディングコントロールパネル:売買、売却、売却、売却、売却、閉じる、削除、修正、トレーリングストップ、ストップロス、takep
このプログラムを使用すると、非常に使いやすいユーザーインターフェースを使用して、MetaTraderアカウントからすべての取引を直接Notionにエクスポートできます。 MT4バージョン  |  ユーザーガイド + デモ 開始するには、ユーザーガイドを使用してNotionテンプレートをダウンロードしてください。 デモをご希望の場合は、ユーザーガイドにアクセスしてください。ストラテジーテスターでは機能しません! 主な機能 取引アカウントからすべての取引をNotionにエクスポート 実行中の取引および保留中の注文をNotionにエクスポートし、更新 テンプレートを作成する 前日からの取引をエクスポート 前週からの取引をエクスポート 前月からの取引をエクスポート カスタム時間範囲からの取引をエクスポート 新しいクローズされた取引をすべて自動的にNotionに送信 エクスポートに含めるフィールドを選択します。注文タイプ、ボリューム、オープン時間、クローズ時間など 開始方法 上記のユーザーガイドに移動するか、EAを起動して「接続ヘルプを取得」をクリックします 接続後、「開始:すべての取引
Exp COPYLOT CLIENT for MT5
Vladislav Andruschenko
3.78 (18)
MT5のトレードコピー機は、МetaТrader5プラットフォームのトレードコピー機です 。 それは間の 外国為替取引をコピーします   任意のは 、MT5 - MT5、MT4 - MT5   COPYLOT MT5版の アカウント (またはを MT4 - MT4   MT5 - MT4   COPYLOT MT4版用) 信頼できるコピー機! MT4のバージョン 完全な説明   +DEMO +PDF 購入する方法 インストールする方法     ログファイルの取得方法     テストと最適化の方法     Expforex のすべての製品 МТ4ターミナルでトレードをコピーすることもできます(   МТ4   -   МТ4、МТ5   -   МТ4   ):   MT4のCOPYLOT CLIENT このバージョンには、端末間 МТ5   -   МТ5、МТ4   -   МТ5が含まれ ます。 ディールコピー機は、2/3/10端末間でディール/ポジションをコピーするために作成されます。 デモ口座と投資口座からのコピーがサポートされています。 プログラムは、複数の端末
Grid Manual MT5
Alfiya Fazylova
4.83 (12)
「Grid Manual」は、注文のグリッドを操作するための取引パネルです。 ユーティリティはユニバーサルで、柔軟な設定と直感的なインターフェイスを備えています。 それは、損失を平均化する方向だけでなく、利益を増やす方向でも注文のグリッドで機能します。 トレーダーは注文のグリッドを作成して維持する必要はありません。 すべてが「Grid Manual」によって行われます。 注文を開くだけで十分であり、「Grid Manual」は注文のグリッドを自動的に作成し、非常に閉じるまでそれに付随します。 完全な説明とデモバージョン ここ。 ユーティリティの主な機能と機能 ユーティリティは、モバイル端末から開かれた注文を含め、あらゆる方法で開かれた注文を処理します。 「制限」と「停止」の2種類のグリッドで機能します。 グリッド間隔の計算には、固定と動的(ATRインジケーターに基づく)の2つの方法で機能します。 オープンオーダーグリッドの設定を変更できます。 チャート上の各注文グリッドの損益分岐点を表示します。 各注文グリッドの利益率を表示します。 ワンクリックでグリッドから収益性の高い注文を閉じるこ
DrawDown Limiter
Haidar, Lionel Haj Ali
5 (17)
Drawdown Limiter EA You are in the right place if you were searching for Drawdown control, Drawdown limiter, Balance protection, Equity Protection or Daily Drawdown Limit related to Prop Firm, FTMO, or Funded account trading, or if you want to protect your trading account. Have you suffered from controlling your drawdown when trading funded accounts? This EA is meant for you. Prop firms usually set a rule called “Trader Daily Drawdown”, and if it is not respected, you are disqualified.  I am an
あなたの外国為替ポートフォリオを管理してください。あなたが立っている場所、何が働いているのか、そして何があなたに痛みを引き起こしているのかを即座に見てください! ここで利用可能なMT4バージョン:https:// www.mql5.com/en/market/product/58375 Trade Managerダッシュボードは、外国為替市場での現在の各ポジションが一目でわかるように設計されており、リスク管理と通貨へのエクスポージャーを理解しやすくします。 複数のポジションで徐々に市場に参入するトレーダー、またはそれらのトレーディンググリッドとバスケット戦略にとって、これは重要な情報です。ターミナル内の複数の位置を監視することは、管理が難しいことがよくあります。 不十分なリスクの活用と使用:報酬は、新しいトレーダーや一部の経験豊富なトレーダーが直面する主要な問題です。トレードマネージャーは、各通貨へのエクスポージャーを個別に示し、一度に両方向に取引しないようにします。 特徴: オープントレード-通貨ペアでソートされた現在のオープントレードをすべて表示します。ペアだけでなく
この製品は、ニュースタイム中にすべてのエキスパートアドバイザーと手動チャートをフィルタリングするため、急激な価格変動によるマニュアルトレードのセットアップの破壊や他のエキスパートアドバイザーによって入力された取引について心配する必要はありません。この製品には、ニュースのリリース前にオープンポジションとペンディングオーダーを処理できる完全な注文管理システムも付属しています。 The News Filter  を購入すると、将来のエキスパートアドバイザーのためにビルトインのニュースフィルターに頼る必要はなく、今後はすべてのエキスパートアドバイザーをここからフィルタリングできます。 ニュース選択 ニュースソースは、Forex Factoryの経済カレンダーから取得されます。 USD、EUR、GBP、JPY、AUD、CAD、CHF、NZD、CNYなど、任意の通貨数に基づいて選択できます。 Non-Farm(NFP)、FOMC、CPIなどのキーワード識別に基づいて選択することもできます。 影響レベルによってフィルタリングするニュースを選択することができ、低、中、高の影響範囲から選択できます
プライスアクションツールキットEAは主にスカルパー向けに設計されていますが、すべての時間枠で使用して、ストップレベルに基づいて正しく計算されたロットサイズで市場に迅速に参入できます。注文)そして市場が動くにつれてストップを調整して利益を上げます。 使用するすべての機能、設定、およびベストプラクティス戦略の完全なリストについては、ここをクリックしてください:https:// www.mql5.com/en/blogs/post/748072 リスクベースのエントリ クイックオーダーボタンを使用すると、アカウントのリスクの割合に基づいてポジションに移動できます。選択したリスクとストップロスまでの距離に基づいて、ロットサイズが自動的に計算されます。そのため、ブローカーが0.01ロットのサイズ設定を使用できることを確認する必要があります。0.10または1.00のロット増分を使用するように強制された場合、ブローカーは機能しません。 高速取引実行ボタン チャート上にクイックトレード実行ボタンを配置し、トレードを即座に自動的に開いたり、閉じたり、調整したりします。通常のエントリーボタン
The product combines a manual trade panel with the ability to perform actions automatically in a highly configurable way. Actions include capturing indicator values and then based on those values raising alerts, open/close or partially close trades, scale-in, setting up pending orders, adjusting stop loss, take profit and more. On-chart controls can be configured, such as tick boxes and buttons, so can be fully interactive. The EA also handles money management, news events, hidden stop loss, tak
Comprehensive on chart trade panel with the unique ability to be controllable from mobile as well. Plus has a library of downloadable configuration, e.g. exit rules, extra panel buttons, pending order setup and more. Please see our product video. Works with all symbols not just currency pairs. Features On chart panel plus controllable from free app for Windows, iPhone and Android Built-in script engine with library of downloadable configuration, e.g. add 'Close All Trades in Profit' button, exit
フィルタ:
レビューなし
レビューに返信