Pivot Points MT4

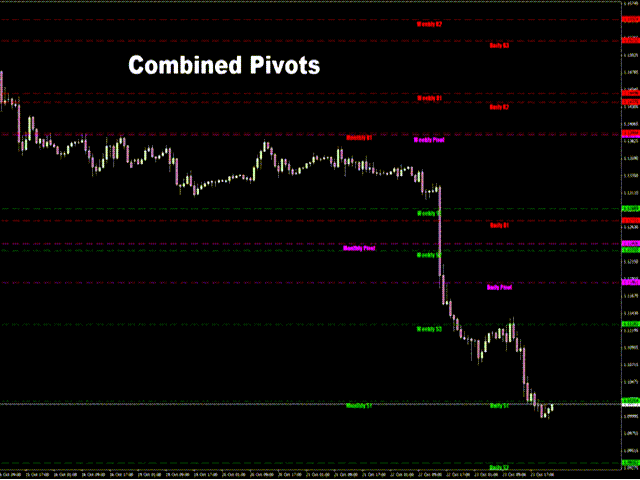
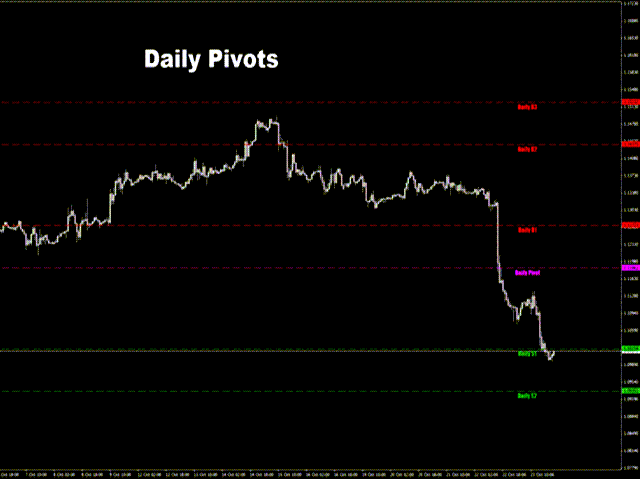
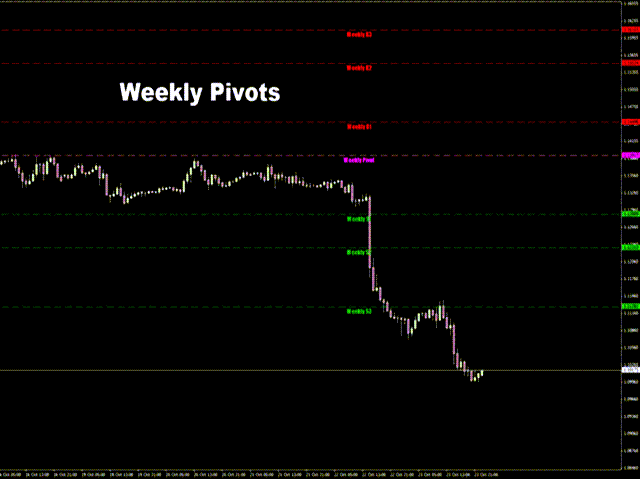
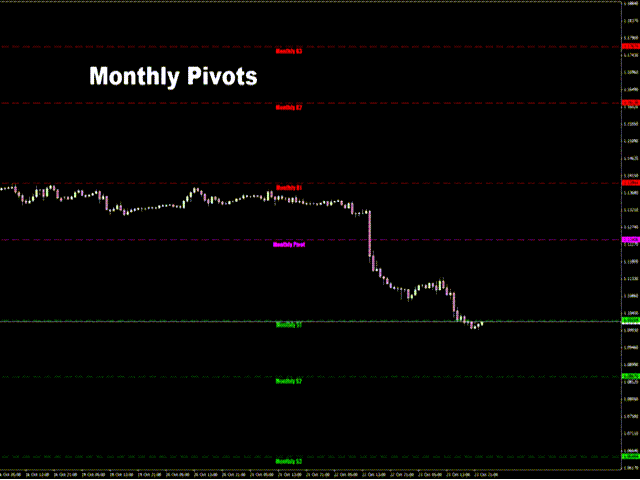
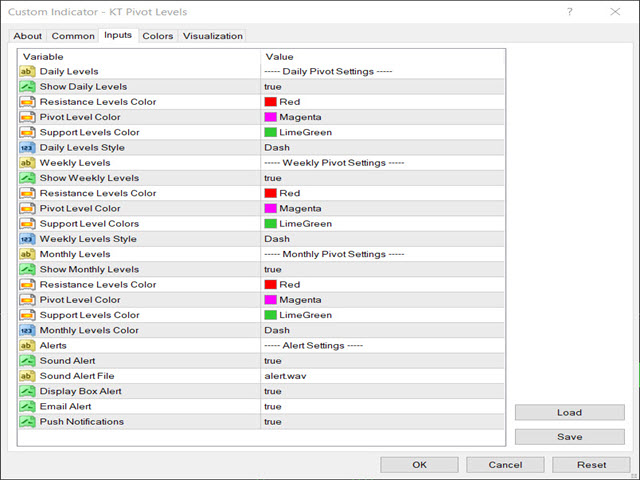
KT Pivot Points는 최신 데이터를 기반으로 일간, 주간, 월간 피벗 레벨을 차트에 자동으로 표시합니다. 피벗 포인트는 외환 시장을 포함한 기술적 분석에서 널리 사용되는 지표입니다.

주요 기능

  • 가격이 피벗 레벨에 도달하면 알림을 전송합니다. 
  • 각 피벗 레벨 종류별로 완전한 사용자 지정이 가능합니다.  
  • 일간, 주간, 월간 피벗 레벨을 깔끔하게 표시합니다.
  • CPU 자원을 적게 사용하여 빠르게 계산됩니다.
  • 차트상의 다른 지표들과 호환됩니다.

피벗 포인트란?

피벗 포인트는 전일의 고가, 저가, 종가의 평균을 이용하여 계산됩니다. 

이 계산된 피벗 포인트를 기반으로 향후의 지지 및 저항 수준을 예측할 수 있으며, 이는 해당 수준 근처에서의 가격 움직임을 판단하는 데 도움이 됩니다.

일반적으로 가격이 피벗 포인트 위에서 거래되면 강세 심리를, 아래에서 거래되면 약세 심리를 나타냅니다.

피벗 계산식

피벗 레벨을 계산하기 위해 전일, 주간 또는 월간의 고가, 저가, 종가 데이터를 사용합니다.

  • P = (H + L + C) / 3
  • R1 = P + (P − L) = 2×P − L
  • S1 = P − (H − P) = 2×P − H
  • R2 = P + (H − L)
  • S2 = P − (H − L)
  • R3 = H + 2×(P − L) = R1 + (H − L)
  • S3 = L − 2×(H − P) = S1 − (H − L)

여기서,

P = 피벗, H = 고가, L = 저가, C = 종가
R = 저항선
S = 지지선

피벗 포인트 활용법

피벗 레벨은 지지 및 저항으로 작용할 수 있어 반전, 지속, 손절, 수익 목표를 파악하는 데 유용합니다. 단기 트레이더는 일일 피벗, 스윙 트레이더는 주간 피벗, 장기 투자자는 월간 피벗을 참고할 수 있습니다.

포지션 트레이더와 투자자는 연간 데이터를 활용하여 다음 해의 주요 레벨을 예측할 수도 있습니다.

피벗 전략

일반적으로 가격이 지지선에 도달하면 매수, 저항선에 도달하면 매도하는 전략이 사용됩니다. 하지만 강한 추세가 형성된 시장에서는 위험할 수 있습니다.

피벗 레벨은 보다 전략적으로 활용해야 합니다. 중심 피벗 아래에 있으면 하락세, 위에 있으면 상승세로 판단할 수 있습니다.

어떤 지표든 완벽하진 않지만, 피벗 포인트는 트레이딩 전략 내에서 나침반 역할을 해주는 유용한 도구입니다.

추천 제품
BeST_ Classic Pivot Points is an MT4 Indicator that is based on the widely known and definitely classic Pivot Point of a market prices activity. A pivot point is calculated as an average of significant prices (high,low,close) from the performance of a market in the prior trading period. If the market in the following period trades above the pivot point it is usually evaluated as a bullish sentiment, whereas trading below the pivot point is seen as bearish. A pivot point and the associated suppo
FREE
Renko bars builder
Navdeep Singh
4.2 (5)
The indicator builds a Renko chart in the sub window for the current symbol. The bars are formed from live data and the desired bar size can be set in the inputs tab. Most importantly, because the Renko chart only uses price to construct bars and ignores time, the indicator can be applied to any time frame and same results can be achieved. Recommended usage As Renko charts are famous for eliminating noise so traders can use this tool to see clear picture of the trend to help their analysis, entr
FREE
pivot points using by many traders and pivot levels most of the times are very helpfull . this indicator is a custom with internal parameters. it can show two times pivot (weekly and daily). you can choose periods total for each time showing pivots.( 1 week , 2 week ,...1day , 2day ,...) when use weekly and daily pivots , it can show you many support and resistance zones. if have proposal comment too me for upgrading indicator.
FREE
Renko Chart with Moving Average. Classic Renko charts idea. It is protted on main chart and Moving Average can be applied. Prices for bars are used from a lower timeframe. Parameters: BarsBack - how many bars of lower timeframe to use. If value is zero than it will use all available bars. LTF - lower timeframe. BrickSize - Renko bar in points. BullishColor - color for bull candle. BearishColor - color for bear candle. HideLineChart - if this value is true the line chart when be hidden when sele
FREE
Grapic ByArrowTrend Pro
Truong Cong Truc
1 (1)
Indicator support for only: Entry Point to Trend Pro Link indicator  support   :   https://www.mql5.com/en/market/product/70867 Supports all currency pairs declared in the definition. Help investors do not need to open many charts. Notice the DEAL:  multiple time frames confluence   M15, H1, H4. Entry Point to Trend Pro The indicator helps investors to identify the earliest and perfect reversal point. Easy to make decision to trade with the trend   Price action trading. support resistance an
FREE
SR indicator
Alexander Chertnik
5 (3)
SR is a support and resistance indicator, it shows major highs and lows by different colors. The color of a level is changing if the last high or low are touching it. After the closing of a bar above or below level, it will delete it. extern inputs: loop for candles / colors / drawing time *This indicator signal is not perfect and have to be used with other market analysis and confirmations.
FREE
This indicator is stand alone version from  MP Pivot Levels  (All in one) containing Woodie Pivots. Woodie’s pivot points are made up of multiple key levels, calculated from past price points, in order to frame trades in a simplistic manner. The key levels include the ‘pivot’ itself, and multiple support and resistance levels (usually up to three each). Traders use these levels as a guide for future price movements when setting up trades. The pivot : (Previous high + previous low + 2 x previous
FREE
An extended version of the indicator for visualizing the time ranges of key trading sessions: Asian, European and American. The main advantage of this indicator is the automatic construction of a price profile for a trading session. The indicator has the functionality to set the start and end time of each trading session, as well as automatically determine the time zone of the trading server. The indicators include the ability to work with minimal CPU usage and save RAM. In addition, the option
FREE
Trendline indicator
David Muriithi
2 (1)
Are you tired of drawing trendlines every time you're analyzing charts? Or perhaps you would like more consistency in your technical analysis. Then this is for you. This indicator will draw trend lines automatically when dropped on a chart. How it works Works similar to standard deviation channel found on mt4 and mt5. It has 2 parameters: 1. Starting Bar 2. Number of bars for calculation The   starting bar   is the bar which drawing of the trend lines will begin, while the   number of bars for c
FREE
Support resistanses show
Meysam Ghasemi
1 (1)
.....................................hi....................... ................for showing high s and low s and support and resistanses .....................we have a lot of ways............................... it can be helpful for finding trends , higher highs , higher lows , lower highs , lower lows .......................today i write on of thems.......................... ........................you can enter the number of last support and resistanses .........................and it will dra
FREE
The   Pivot Point indicator   automatically calculates and displays the pivot point line and support and resistance levels. Pivot can be calculated according to the Classic, Floor, Fibonacci, Woodie, Camarilla or DeMark formula. It is also possible to select the period for calculating the indicator. A trader can choose from daily, weekly, monthly, or user-defined periods. Types of pivots Classic Floor Fibonacci Woodie Camarilla DeMark Main features The indicator shows the current and historic
FREE
CyberZingFx Volume
Afsal Meerankutty
4.74 (38)
CyberZingFx Volume Indicator is designed to help traders find market reversals with ease. This powerful tool uses a unique strategy that combines both volume and historical price to provide accurate signals for potential market reversals. The indicator displays volume BUY and SELL power values on the right side of the chart for both BUY and SELL. With customizable settings, you can set alerts at different levels to suit your trading style. The most recent alert value is displayed as Alert High,
FREE
MP Demark Pivot Levels
Pierre Ksachikian
4 (1)
This indicator is stand alone version from  MP Pivot Levels  (All in one) containing Demark's Pivots. Calculations:     PP = X / 4     R1 = X / 2 - LOWprev     S1 = X / 2 - HIGHprev Uses: When the pair currency price may change the direction of movement. Possible constraints of support and resistance that creates plateaus for the currency pair prices. Tendency identification by comparing the present prices according to current day's pivot point and also the prior day's pivot points. ____________
FREE
This is a Multi-Time-Frame Zigzag indicator You can change parameters of Zigzag, include Zigzag Depth, Zigzag Deviation, Zigzag Backstep. You can choose which Time Frame to display Zigzag by turn ShowXXX to true or false (ShowXXX = ShowM1, ShowM5, ShowM15...). Noted: Lower Time Frame Zigzag will not display on Higher Time Frame. Example: Your current Time Frame is H1, you can not see Zigzag of M1 to M30 even you turn them on.
DR IDR for all sessions
Chi Chun Ho
4.93 (15)
Updates 9/12/2023 - If you are looking for the Spock EA, I don't sell it anymore. DM me for more info. 24/10/2023  -  Check out my other products. Starting to roll out some EAs & indicators based on this range. Currently there is no MT5 version. I am using MT4 myself. So I will spend my time mostly to develop more extensive stats for the Stats version and maybe even an EA. But I might  develop a MT5 version. All depends on the demand. Meaning, the more people request it, the bigger the chan
FREE
Auto Fibo Retracement MT4
Nguyen Tuan Son
3.75 (4)
Auto Fibonacci Retracement Indicator — Flexible and Reliable This is not just another Auto Fibonacci Retracement indicator — it’s one of the most flexible and dependable tools available . If you find it useful, please leave a review or comment to support the project. Check out my other helpful tools below: Timeframes Trend Scanner    - Scan the trend of assets in difference timeframes with multiple indicators Market Trend Scanner   - Scan the trend of multiple-assets in with multiple indicators
FREE
Shadow Flare MT4
Kestutis Balciunas
Shadow Flare 인디케이터는 MetaTrader 4용 비리페인트형 추세 & 유동성 도구 입니다. 설정 가능한 이동평균 베이스라인(HMA, EMA, SMA 또는 RMA)을 계산하고, 그 주변에 평균진폭범위(ATR) 기반 밴드를 씌워 가격이 상단 또는 하단 밴드를 종가 기준으로 돌파할 때에만 방향이 전환되는 “점착형(Sticky)” 추세 상태를 생성합니다. 동일한 추세 엔진은 피벗 고점·저점을 감지하여 그 주위에 색상 박스를 그린 뒤, 가격이 종가 기준으로 해당 박스를 돌파하는 순간 자동으로 존을 소거(미티게이션)하는 공급/수요 존 모듈도 구동합니다. 매수·매도 신호는 추세 상태가 전환되는 시점에 발생하며, 선택적인 거래량 및 RSI 필터를 통해 약한 신호나 모멘텀에 역행하는 진입을 차단할 수 있습니다. 내장 대시보드는 실시간으로 Trend Bias(추세 바이어스), Momentum(RSI 기반), Volume(거래량)을 보여 줍니다. 팝업, 사운드, 모바일 푸시, 이메일로 구성
FREE
Free automatic fibonacci
Tonny Obare
4.68 (50)
Free automatic Fibonacci is an indicator that automatically plots a Fibonacci retracement based on the number of bars you select on the BarsToScan setting in the indicator. The Fibonacci is automatically updated in real time as new highest and lowest values appears amongst the selected bars. You can select which level values to be displayed in the indicator settings. You can also select the color of the levels thus enabling the trader to be able to attach the indicator several times with differe
FREE
.................................if you need pivot point s levels............................... ............................this is a daily pivot point level creator........................... ...it is for daily pivots and show levels at times period H4 , H1 , M30 , M15 ,M 5... .................................also shows levels for 3 last days.............................. ................can use it with other indicators and see important levels...............
FREE
MASi Three Screens
Aleksey Terentev
5 (2)
MASi Three Screens is based on the trading strategy by Dr. Alexander Elder. This indicator is a collection of algorithms. Algorithms are based on the analysis of charts of several timeframes. You can apply any of the provided algorithms. List of versions of algorithms:     ThreeScreens v1.0 - A simple implementation, with analysis of the MACD line;     ThreeScreens v1.1 - A simple implementation, with analysis of the MACD histogram;     ThreeScreens v1.2 - Combines the first two algorithms in
FREE
Double Price Channel   설정에 지정된 특정 수의 바에 대한 가격 채널 표시기. 표시선은 동적 지원 또는 저항 수준을 나타냅니다. 상한선은 특정 기간 동안의 최대 가격이고 하한선은 최소값입니다. 종가를 기반으로 하는 이동 평균과 달리 지표는 작은 변동으로 인해 "산만"하지 않습니다. 경계가 변경되는 경우에만 다시 계산됩니다. 후자가 발생하면 새로운 추세의 접근 방식에 대해 진지하게 생각할 가치가 있습니다. 기간이 다른 두 개의 지표를 한 차트에 한 번에 사용하는 전략이 있습니다. 이러한 경우 기간이 더 짧은 표시기는 두 번째 표시기 내부에 위치합니다. 표시기 설정 설명: Width_Bars - 표시 기간 높이 - 높이(포인트) Double Price Channel   설정에 지정된 특정 수의 바에 대한 가격 채널 표시기. 표시선은 동적 지원 또는 저항 수준을 나타냅니다. 상한선은 특정 기간 동안의 최대 가격이고 하한선은 최소값입니다. 종가를 기반으로 하는 이동 평균과
FREE
피봇 포인트 Fibo RSJ는 피보나치 비율을 사용하여 당일의 지지선과 저항선을 추적하는 지표입니다. 이 멋진 지표는 피보나치 비율을 사용하여 피벗 포인트를 통해 최대 7단계의 지지와 저항을 생성합니다. 가격이 작업의 가능한 진입/종료 지점을 인식할 수 있는 이 지원 및 저항의 각 수준을 어떻게 존중하는지 환상적입니다. 특징 최대 7단계 지원 및 7단계 저항 레벨의 색상을 개별적으로 설정 입력 피벗 유형 피벗 피보 RSJ1 = 피보 비율 1 계산 피벗 피보 RSJ2 = 피보 비율 2 계산 피벗 Fibo RSJ3 = Fibo 비율 3 계산 피벗 피보 클래식 = 클래식 피벗 계산 최소 피벗 수준 피벗 3 레벨 피벗 4 레벨 피벗 5 레벨 6단계 피벗 피벗 7 레벨 여전히 질문이 있는 경우 다이렉트 메시지로 저에게 연락하십시오: https://www.mql5.com/ko/users/robsjunqueira/
FREE
Features: 1- Get OB/OS Levels from Golden MA Levels 2- Wait for Buy/Sell Start Level Cross 3- Optional: Should price cross Mid Level in earlier bars 4- Optional: Crossing bar High/Medium Volume 5- Optional: MA Stacked to check up/down trend for current TF 6- Optional: NRTR higher timeframes aligned Check Detailed blog post explained: https://www.mql5.com/en/blogs/post/758457 Levels with Buffers available here: Golden MA Levels Indicator: https://www.mql5.com/en/market/product/119515 Note: Arr
FREE
Scalping Edge Pro
Saqr Mohammad Yousef Almasarweh
Scalping Edge Pro Indicator Unleash the Power of Precision Trading: Introducing Scalping Edge Pro Tired of market noise and conflicting signals that cloud your judgment? Are you searching for a tool that delivers the clarity and confidence needed to seize rapid opportunities in volatile markets? Scalping Edge Pro is the engineered solution designed for traders who demand precision and professionalism in every trade. It is meticulously calibrated for peak performance on the 15-minute (M15) timef
FREE
Our offer also includes a free panel — Indicator Panel — which allows you to show or hide indicators created by BOToBRACIA. High and Low Points is a practical technical analysis indicator that plots levels corresponding to the highs and lows from previous periods (day / week / month) — levels that, in the Smart Money Concepts (SMC) and ICT approach, are treated as liquidity zones, while in classical technical analysis they serve as potential support and resistance levels. Indicator settings: •
FREE
TCL Boll Bands Trader MT4
Stratos Digital (PVT) Ltd
TCL Boll Bands Trader is a Bollinger Bands indicator for MetaTrader 4 with a multi-mode trend filter, dual-deviation entry levels, volatility subfilters, and an interactive on-chart dashboard. How It Works Standard Bollinger Bands signals can produce signals against the dominant move when the underlying market is in a strong trend. This indicator addresses that by checking each potential signal against a configurable trend filter before plotting it, and by adding squeeze, Average Directional Ind
FREE
Candle GAP
Thushara Dissanayake
3 (1)
캔들 갭   표시기는 각 요일의 캔들 갭을 자동으로 식별하기 때문에   갭 거래 전략을   활용하는 트레이더에게 필수적인 도구입니다. 갭은 이틀 연속 종가와 시가 사이의 가격 수준 차이를 말합니다. 이 지표는 Common, Breakaway, Continuation 및 Exhaustion의 네 가지 유형의 갭 패턴을 인식합니다. 이 지표를 차트에 통합함으로써 거래자는 신호를 검증하고 거래 결정을 향상시킬 수 있습니다. 캔들 GAP 표시기의 주요 기능 중 하나는 D1(일일) 아래의 모든 기간과 모든 기호 또는 도구에 사용할 수 있는 다용성입니다. 사용하기 쉬운 매개 변수를 제공하여 모든 경험 수준의 트레이더가 액세스할 수 있습니다. 이 지표는 차트에 갭 패턴을 신속하게 그려서 빠른 분석과 의사 결정을 가능하게 합니다. 단순함은 유용성을 더하여 간단하고 효율적인 거래 경험을 보장합니다. 표시기의 데이터 표시 매개변수를 통해 트레이더는 갭 정보의 모양을 사용자 정의할 수 있습니다. 사용자
FREE
GTAS STrend
Riviera Systems
4.5 (2)
GTAS S-Trend is a momentum indicator that helps to determine trends using combination of MACD, RSI and moving averages. This indicator was created by Bernard Prats Desclaux, proprietary trader and ex-hedge fund manager, founder of E-Winvest. Description The indicator oscillates between -65 and +65 with a neutral zone between -25 and +25 around a 0 equilibrium line. S-Trend between -25 and +25 indicates congestion zones with a bullish bias between 0 and +25, and a bearish bias between 0 and -25.
FREE
Super Auto Fibonacci
Muhammed Emin Ugur
Discover the power of precision and efficiency in your trading with the " Super Auto Fibonacci " MT4 indicator. This cutting-edge tool is meticulously designed to enhance your technical analysis, providing you with invaluable insights to make informed trading decisions. Key Features: Automated Fibonacci Analysis: Say goodbye to the hassle of manual Fibonacci retracement and extension drawing. "Super Auto Fibonacci" instantly identifies and plots Fibonacci levels on your MT4 chart, saving you tim
FREE
RaysFX Supertrend Line
Davide Rappa
5 (2)
RaysFX Supertrend + Alert RaysFX Supertrend è un indicatore di tendenza superiore progettato per i trader che desiderano avere un vantaggio nel mercato. Questo indicatore utilizza una combinazione di CCI (Commodity Channel Index) e ATR (Average True Range) per identificare le tendenze del mercato e fornire segnali di trading accurati. Caratteristiche principali Indicatori CCI e ATR: Utilizza due degli indicatori più popolari e affidabili per identificare le tendenze del mercato e generare segnal
FREE
이 제품의 구매자들이 또한 구매함
Neuro Poseidon MT4
Daria Rezueva
4.84 (43)
Neuro Poseidon is a new indicator by Daria Rezueva. It combines precise trading signals with adaptive TP/SL levels - creating best possible trades as a result! Message me and get  Neuro Poseidon Assistant  as a gift to automize your trading process! What makes it stand out? 1. Proven profitability on all assets and timeframes 2. Only confirmed BUY and SELL signals present on the chart 3. Adaptive TP & SL levels generated by the software for each trade 4. Easy to understand - suitable for all
Gann Made Easy
Oleg Rodin
4.84 (167)
Gann Made Easy 는 mr.의 이론을 사용하여 최고의 거래 원칙을 기반으로 하는 전문적이고 사용하기 쉬운 Forex 거래 시스템입니다. W.D. 간. 이 표시기는 Stop Loss 및 Take Profit Levels를 포함하여 정확한 BUY 및 SELL 신호를 제공합니다. PUSH 알림을 사용하여 이동 중에도 거래할 수 있습니다. 구매 후 거래 방법 안내 및 유용한 추가 지표를 무료로 받으시려면 저에게 연락주세요! 아마도 Gann 거래 방법에 대해 이미 여러 번 들었을 것입니다. 일반적으로 Gann의 이론은 초보자 거래자뿐만 아니라 이미 거래 경험이 있는 사람들에게도 매우 복잡한 것입니다. Gann의 거래 방식은 이론적으로 적용하기 쉽지 않기 때문입니다. 나는 그 지식을 연마하고 Forex 지표에 최고의 원칙을 적용하기 위해 몇 년을 보냈습니다. 표시기는 적용하기가 매우 쉽습니다. 차트에 첨부하고 간단한 거래 권장 사항을 따르기만 하면 됩니다. 지표는 지속적으로 시장 분석
Prop Firm Sniper
Mohamed Hassan
5 (1)
Prop Firm Sniper MT4  is a professional market structure indicator that automatically identifies high-probability BUY and SELL opportunities using BOS and CHoCH analysis. Recommended Timeframes: For backtesting, use the indicator on   M5 or M15   for Gold (XAUUSD), and   M15 or H1   for more volatile Forex pairs such as   GBPUSD, USDJPY, EURGBP , and similar markets. CONTACT ME AFTER PURCHASE TO CLAIM YOUR FREE BONUSES! Prop Firm Sniper  is a professional market structure indicator designed t
Neo Wave PRO
Nikolay Raykov
5 (1)
Price & Time Market Structure Indicator A professional market structure tool that analyzes waves through both price and time — not price alone. Main Description NeoWave PRO is a professional market structure indicator for MetaTrader 4 designed for traders who want to move beyond traditional one-dimensional wave tools such as ZigZag, swing indicators, and basic high/low systems. Most wave indicators analyze only one thing: Price. But a real market wave is not only a price movement. A true wave de
Trend Catcher ind
Ramil Minniakhmetov
5 (10)
트렌드 캐처 인디케이터 트렌드 캐처 인디케이터는 개발자가 자체 개발한 맞춤형 적응형 트렌드 분석 지표들을 조합하여 시장 가격 움직임을 분석합니다. 단기적인 노이즈를 제거하고 근본적인 모멘텀 강도, 변동성 확대, 가격 구조 움직임에 집중하여 진정한 시장 방향을 파악합니다. 또한 이동 평균, RSI, 변동성 필터와 같은 맞춤형 지표들을 활용하여 가격을 평활화하고 트렌드를 필터링합니다. 실제 운영 모니터링 및 기타 제품은 다음 링크에서 확인하실 수 있습니다: https://www.mql5.com/en/users/mechanic/seller 텔레그램에서는 EA나 설정 파일을 판매하지 않습니다. 사기이니 주의하세요. 모든 설정 파일은 블로그에서 무료로 제공됩니다. 중요! 구매 후 즉시 연락 주시면 사용 방법 및 보너스를 드립니다!
Smart Price Action Concepts
Issam Kassas
4.79 (14)
이 제품은 2026년 시장에 맞게 업데이트되었으며 최신 MT5 빌드에 최적화되었습니다. 가격 업데이트 안내: Smart Price Action Concepts는 현재 $200 에 제공됩니다. 다음 30회 구매 후 가격은 $299 로 인상됩니다. 특별 혜택: 구매 후 저에게 개인 메시지를 보내시면 무료 보너스 + 선물 을 받을 수 있습니다. 먼저, 이 트레이딩 도구는 리페인트 없음, 재그리기 없음, 지연 없음의 인디케이터이므로 전문적인 트레이딩에 적합하다는 점을 강조하고 싶습니다. Online course , and manual Smart Price Action Concepts Indicator는 초보자와 경험 많은 트레이더 모두에게 매우 강력한 도구입니다. 20개 이상의 유용한 인디케이터를 하나로 결합하고, Inner Circle Trader Analysis와 Smart Money Concepts Trading Strategies 같은 고급 트레이딩 아이디어를 통합합니다. 이 인디
Atomic Analyst
Issam Kassas
5 (8)
이 제품은 2026년 시장에 맞게 업데이트되었으며 최신 MT5 빌드에 최적화되었습니다. 가격 업데이트 안내: Atomic Analyst는 현재 $99 에 제공됩니다. 다음 30회 구매 후 가격은 $199 로 인상됩니다. 특별 혜택: Atomic Analyst 구매 후 저에게 개인 메시지를 보내시면 Smart Universal EA를 무료 로 받을 수 있으며, Atomic Analyst 신호를 자동 거래로 전환할 수 있습니다. Atomic Analyst는 리페인트 없음, 재그리기 없음, 지연 없음의 Price Action 거래 인디케이터로, 수동 거래, 신호 명확성, EA 자동화를 위해 설계되었습니다. User manual: settings, inputs and strategy.     &   User Manual PDF . 가격 움직임, 강도, 모멘텀, 다중 시간대 방향 및 고급 필터를 분석하여 트레이더가 노이즈를 줄이고 약한 세팅을 피하며 더 체계적인 거래 결정을 내릴 수 있도
Miraculous Indicator – Gann Square of Nine 기반 100% 비리페인트 Forex 및 바이너리 도구 이 영상은 Miraculous Indicator 를 소개합니다. 이 지표는 Forex 및 바이너리 옵션 트레이더를 위해 특별히 개발된 매우 정확하고 강력한 트레이딩 도구입니다. 이 지표가 독특한 이유는 전설적인 **Gann Square of Nine(Gann 9의 사각형)**과 **Gann's Law of Vibration(Gann 진동의 법칙)**에 기반을 두고 있기 때문입니다. 이는 현대 트레이딩에서 가장 정밀한 예측 도구 중 하나로 손꼽힙니다. Miraculous Indicator는 완전히 비리페인트(non-repaint) 됩니다. 즉, 캔들이 마감된 후에도 신호가 변경되거나 사라지지 않습니다. 보이는 것이 곧 결과입니다. 이는 트레이더가 자신감을 가지고 거래에 진입하고 청산할 수 있는 신뢰할 수 있고 일관된 기반을 제공합니다. 주요 특징: Gann
Advanced Supply Demand
Bernhard Schweigert
4.91 (301)
현재 30% 할인! 초보자나 전문 트레이더를 위한 최고의 솔루션! 이 보조지표는 우리가 다수의 독창적 기능과 새로운 공식을 통합한 독특하고 고품질이며 저렴한 거래 도구입니다. 이 업데이트를 통해 이중 시간대를 표시할 수 있습니다. 더 높은 TF를 표시할 수 있을 뿐만 아니라 차트 TF와 더 높은 TF 모두를 표시할 수 있습니다: 중첩 영역 표시. 모든 Supply Demand 트레이더들이 좋아할 것입니다. :) 중요한 정보 공개 Advanced Supply Demand의 잠재력을 극대화하려면 다음을 방문하십시오. https://www.mql5.com/ko/blogs/post/720245   진입 또는 목표의 명확한 트리거 포인트를 정확히 찾아냄으로 해서 거래가 어떻게 개선될지 상상해 보십시오. 새로운 알고리즘을 기반으로 매수자와 매도자 간의 잠재적인 불균형을 훨씬 더 쉽게 분간할 수 있습니다. 왜냐하면 가장 강한 공급영역과 가장 강한 수요 영역과 과거에 어떻게 진행 되었는지를(이전
M1 Sniper
Oleg Rodin
5 (24)
M1 SNIPER 는 사용하기 쉬운 거래 지표 시스템입니다. M1 시간대에 맞춰 설계된 화살표 지표입니다. 이 지표는 M1 시간대 스캘핑을 위한 단독 시스템으로 사용할 수 있으며, 기존 거래 시스템의 일부로도 사용할 수 있습니다. 이 거래 시스템은 M1 시간대 거래용으로 특별히 설계되었지만, 다른 시간대에도 사용할 수 있습니다. 원래는 XAUUSD와 BTCUSD 거래를 위해 이 방법을 설계했지만, 다른 시장 거래에도 유용하다는 것을 알게 되었습니다. 이 지표의 신호는 추세 방향과 반대로 거래될 수 있습니다. 저는 지표의 신호를 활용하여 양방향으로 거래할 수 있도록 돕는 특별한 거래 기법을 알려드립니다. 이 방법은 특별한 동적 지지선과 저항선 가격 영역을 활용하는 것을 기반으로 합니다. 구매하시면 M1 SNIPER 화살표 지표를 바로 다운로드하실 수 있습니다. 또한, 아래 스크린샷에 표시된 Apollo Dynamic SR 지표는 M1 SNIPER 도구를 사용하는 모든 사용자에게 무료로
Owl smart levels
Sergey Ermolov
4.26 (38)
추세를 따라 거래할 때 가장 어려운 점은 레벨을 찾는 것이 아니라, 어디에서 진입이 실제로 유효한지를 이해하는 것입니다. 가격은 종종 레벨에 반응하지만 움직임이 이어지지 않는 경우가 많으며, 이는 잘못된 진입이나 기회 상실로 이어집니다. Owl Smart Levels는 단순히 레벨만 표시하는 것이 아니라 , 시장 구조와 되돌림을 기반으로 형성된 구간을 보여줍니다. 이를 통해 진입 포인트를 다르게 평가할 수 있으며 일부 잘못된 신호를 피할 수 있습니다. Owl Smart Levels 시스템 구성 Owl Smart Levels 는 단순한 레벨 표시가 아니라, 각 요소가 서로 보완하는 완전한 트레이딩 모델 입니다. 구성 요소: Owl Smart Levels (지표) 추세 방향, 되돌림 구간, 그리고 사전에 정의된 진입, StopLoss, TakeProfit 레벨을 표시 시스템 가이드 실제 거래에서 신호를 어떻게 활용할지 설명: 어떤 상황을 고려하고 어떤 상황을 건너뛸지, 그리고 거래
PZ Trend Trading
PZ TRADING SLU
4.8 (5)
Capture every opportunity: your go-to indicator for profitable trend trading Trend Trading is an indicator designed to profit as much as possible from trends taking place in the market, by timing pullbacks and breakouts. It finds trading opportunities by analyzing what the price is doing during established trends. [ Installation Guide | Update Guide | Troubleshooting | FAQ | All Products ] Trade financial markets with confidence and efficiency Profit from established trends without getting whips
ORB Seeker
Marcela Goncalves De Oliveira
특별 출시 가격! 단돈 79달러! 10개 판매 후 가격이 인상되어 최종 가격은 199달러가 됩니다. 구매 후 연락 주시면 완전 자동화되고 최적화된 설정 파일을 사용하여 돌파 신호를 거래할 수 있는 무료 보너스 EA를 드립니다. 깔끔한 세션 브레이크아웃을 자신감 있게 활용하세요! ORB Seeker는 정확성, 단순성, 유연성 및 명확한 차트 구조를 원하는 트레이더를 위해 개발된 전문적인 시가 범위 돌파(ORB) 지표입니다. 이 프로그램은 모든 금융 상품에 대해 장전 거래 또는 사용자 지정 세션 범위를 자동으로 표시하고, 진입, 손절매, 목표 수익 및 선택적으로 50% 부분 목표 수익 수준을 포함한 명확한 돌파 신호를 제공합니다. 모든 계산은 실시간으로 차트에 직접 표시됩니다. 런던 개장, 뉴욕 세션, 아시아 세션 또는 사용자 지정 시장 시간대를 선택하여 거래하세요. ORB Seeker는 사용자가 선택한 세션 시간에 맞춰 작동하므로 시장 범위, 돌파 수준 및 거래 레벨을 정확하게 확
PRO Renko System
Oleg Rodin
5 (31)
PRO Renko System 은 RENKO 차트 거래를 위해 특별히 고안된 매우 정확한 거래 시스템입니다. 이것은 다양한 거래 상품에 적용될 수있는 보편적 인 시스템입니다. 체계는 효과적으로 당신에게 정확한 반전 신호에 접근을 주는 소위 시장 소음을 중화합니다. 이 표시기는 사용하기가 매우 쉽고 신호 생성을 담당하는 매개 변수가 하나만 있습니다. 당신은 쉽게 당신의 선택의 어떤 무역 계기에 공구를 적응시킬 수 있고 renko 막대기의 크기. 나는 항상 당신이 내 소프트웨어로 수익성있게 거래 할 수 있도록 추가 지원을 제공 할 준비가되어 있습니다! 나는 당신에게 행복하고 수익성있는 거래를 기원합니다! 구매 후 저에게 연락하십시오! 내 렌코 차트 생성기를 보내드립니다. 또한 내 개인 권장 사항 및 시스템의 다른 모듈을 무료로 공유 할 것입니다!
M1 Quantum
Hamed Dehgani
M1 Quantum을 이용한 실시간 트레이딩 신호 : 신호   ( Quantum Trade Assistant 에 의해 거래가   자동으로   실행되며, 이 제품에   무료 로 포함되어 있습니다.) 개발자 안내:   구매 후 저에게 연락하시면 최신   추천 설정 파일(Set File) , 거래 팁, 그리고   VIP 지원 그룹 초대를 받으실 수 있습니다. 여기에서 다른 M1 Quantum 사용자들과 소통할 수 있습니다. MT5 버전 사용 가능 : MT5 방문 M1 Quantum 은 M1 전용 전문 트레이딩 시스템으로, 손절(Stop Loss), 익절(Take Profit), 그리고 스마트 자금 관리 기능이 내장된 빠르고 정확한 거래 신호를 제공합니다. M1 Quantum 은 연속 수익 거래 에 집중하여 계좌를 빠르게 성장시키도록 설계된 전문 자금 관리 시스템을 포함하고 있습니다. M1 Quantum 인디케이터 의 주요 기능 M1 타임프레임 및 모든 주요 통화쌍 용으로 설계됨 모든 거
Smart Trend Trading System
Issam Kassas
4.67 (6)
이 제품은 2026년 시장에 맞게 업데이트되었으며 최신 MT5 빌드에 최적화되었습니다. 가격 업데이트 안내: Smart Trend Trading System은 현재 $99 에 제공됩니다. 다음 30회 구매 후 가격은 $199 로 인상됩니다. 특별 혜택: Smart Trend Trading System 구매 후 저에게 개인 메시지를 보내시면 Smart Universal EA를 무료 로 받을 수 있으며, Smart Trend 신호를 자동 거래로 전환할 수 있습니다. Smart Trend Trading System은 리페인트 없음, 재그리기 없음, 지연 없음의 완전한 트레이딩 시스템으로, 더 깨끗한 신호, 더 나은 추세 방향, 그리고 더 체계적인 시장 거래 방식을 원하는 트레이더를 위해 제작되었습니다. Online course , manual and [download presets] . 이 시스템은 추세 감지, 반전 구간, Smart Cloud, 트레일링 스톱 로직, 지지와 저항, 캔들
System Trend Pro
Aleksandr Makarov
5 (3)
System Trend Pro - This is the best trend trading indicator!!! The indicator no repaint!!!  The indicator has   MTF   mode, which adds confidence to trading on the trend (   no repaint   ). How to trade? Everything is very simple, we wait for the first signal (big arrow), then wait for the second signal (small arrow) and enter the market in the direction of the arrow. (See screens 1 and 2.) Exit on the opposite signal or take 20-30 pips, close half of it, and keep the rest until the opposite
Scalping Lines System - 은 M1-H1 시간 프레임에서 금(XAUUSD) 자산을 거래하기 위해 특별히 설계된 스캘핑 트레이딩 시스템입니다. 추세, 변동성, 과매수/과매도 시장 분석 지표를 하나의 오실레이터로 통합하여 단기 신호를 식별합니다. 신호선의 주요 내부 매개변수는 사전 설정되어 있습니다. "Trend Wave Duration"은 이동평균선 추세를 사용하여 추세 방향으로 일련의 신호 지속 시간을 조절하고, "Apply Smoothing to Signal Line"은 신호선 생성 방식을 조정하는 매개변수로, 수동으로 조정할 수 있습니다. 시가에서 신호선을 계산할 때는 차트가 다시 그려지지 않습니다. 다른 가격대에서는 신호 화살표가 깜빡일 수 있습니다. 신호는 캔들 마감 후에 나타나며, 다양한 알림 유형을 사용할 수 있습니다. 권장 시간 프레임: M1, M5, M15, M30, H1. 이 지표는 원래 금 거래를 위해 설계되었지만, 스프레드가 낮은 변동성이
현재 30% 할인 ! 초보자 또는 전문가 트레이더를 위한 최고의 솔루션! 이 대시보드 소프트웨어는 28개의 통화 쌍에서 작동합니다. 2가지 주요 지표(Advanced Currency Strength 28 및 Advanced Currency Impulse)를 기반으로 합니다. 전체 Forex 시장에 대한 훌륭한 개요를 제공합니다. 고급 통화 강도 값, 통화 이동 속도 및 모든(9) 시간대의 28 Forex 쌍에 대한 신호를 보여줍니다. 추세 및/또는 스캘핑 기회를 정확히 파악하기 위해 차트의 단일 지표를 사용하여 전체 시장을 볼 수 있을 때 거래가 어떻게 개선될지 상상해 보십시오! 잠재적인 거래를 식별하고 확인하면서 강력한 통화와 약한 통화를 더욱 쉽게 식별할 수 있도록 이 지표에 기능을 내장했습니다. 이 표시기는 통화의 강세 또는 약세가 증가 또는 감소하는지 여부와 모든 시간대에서 수행되는 방식을 그래픽으로 보여줍니다. 추가된 새로운 기능은 현재 시장 조건 변화에 적응하는
Market Structure Patterns MT4
Samuel Manoel De Souza
5 (18)
Market Structure Patterns   is an indicator based on   smart money concepts   that displays   SMC/ICT   elements that can take your trading decisions to the next level. Take advantage of the   alerts ,   push notifications   and   email messages   to keep informed from when an element is formed on the chart, the price crosses a level and/or enters in a box/zone. Developers can access the values of the elements of the indicator using the   global variables  what allows the automation of trading d
Cycle Sniper
Elmira Memish
4.39 (36)
Please contact us after your purchase and we will send you the complimentary indicators to complete the system Cycle Sniper is not a holy grail but when you use it in a system which is explained in the videos, you will feel the difference. If you are not willing to focus on the charts designed with Cycle Sniper and other free tools we provide, we recommend not buying this indicator. We recommend watching the videos about the indiactor and system before purchasing. Videos, settings  and descri
Scalper Inside PRO
Alexey Minkov
4.68 (69)
Scalper Inside PRO Scalper Inside PRO is an intraday trend and scalping indicator that uses exclusive built-in algorithms to evaluate market direction and key target levels. The indicator automatically calculates entry and exit points and several profit target levels, and it shows detailed performance statistics, so you can see how different instruments and strategies behaved on historical data. This helps you select instruments that fit current market conditions. You can also connect your own a
CRT Candle Range Theory HTF MT4.   Ultimate CRT Indicator: Advanced ICT Concepts and Malaysian SnR Trading System Master the Market Maker's Footprints with the Most Advanced Candle Range Theory Indicator Discounted   Price   $50  !!     Secure your lifetime access   now   before it switches to   subscription-only ! Unlock the true power of  Smart Money Concepts (SMC)  and trade precisely like the institutions with the  Ultimate CRT Indicator . Built exclusively for serious traders, this indicat
BTMM State Engine Pro MT4
Garry James Goodchild
BTMM State Engine Pro is a MetaTrader 4 indicator for traders who use the Beat The Market Maker approach: Asian session context, kill zone timing, level progression, peak formation detection, and a multi-pair scanner from a single chart. It combines cycle state logic with a built-in scanner dashboard so you do not need the same tool on many charts at once. What it does Draws the Asian session range; session times can follow broker server offset or be set in inputs. Tracks level progression (L
Dynamic Forex28 Navigator
Bernhard Schweigert
4.43 (7)
Dynamic Forex28 Navigator - 차세대 외환 거래 도구. 현재 49% 할인. Dynamic Forex28 Navigator는 오랫동안 인기 있는 지표의 진화형으로, 세 가지의 힘을 하나로 결합했습니다. 고급 통화 Strength28 지표(695개 리뷰) + 고급 통화 IMPULSE with ALERT(520개 리뷰) + CS28 콤보 신호(보너스). 지표에 대한 자세한 정보 https://www.mql5.com/en/blogs/post/758844 차세대 Strength 지표는 무엇을 제공합니까?  원래 지표에서 좋아했던 모든 것이 새로운 기능과 더 높은 정확도로 강화되었습니다. 주요 기능: 독점적인 통화 Strength 공식.  모든 시간대에 걸쳐 부드럽고 정확한 강도선. 추세와 정확한 진입을 식별하는 데 이상적입니다. 역동적인 시장 피보나치 수준(시장 피보나치).  이 지표에만 있는 고유한 기능. 가격 차트가 아닌 통화 강도에 피보나치가 적용됩니다.
Non Repaint Trend Bands
Ravshan Chuliev
5 (1)
Channel Trend Bands – A Comprehensive Indicator for Market Analysis MetaTrader 5 Version Simple to Use, Effective in Application User-Friendly and Suitable for All Traders This indicator stands out due to its straightforward functionality. Whether you're a beginner exploring the market or an experienced trader refining your strategy, this tool offers valuable insights. Using a Triangular Moving Average (TMA) with additional ATR-based bands , it provides structured market data to support well-i
Super Signal – Skyblade Edition 전문가용 노리페인트 / 노래그 트렌드 신호 시스템, 뛰어난 승률 제공 | MT4 / MT5용 1분, 5분, 15분과 같은 낮은 타임프레임에서 가장 좋은 성능을 보입니다. 핵심 기능: Super Signal – Skyblade Edition은 추세 매매를 위해 설계된 스마트 신호 시스템입니다. 이 시스템은 다중 필터 로직을 활용하여, 명확한 방향성과 실질적인 모멘텀이 수반된 고품질 추세만을 감지합니다. 이 시스템은 고점 또는 저점을 예측하지 않으며 , 다음 세 가지 조건이 모두 충족될 때만 신호를 발생시킵니다: 명확한 추세 방향 강화되는 모멘텀 건전한 변동성 구조 또한, 시장 세션 기반의 유동성 분석을 통해 신호의 신뢰성과 타이밍을 더욱 향상시킵니다. 신호 특성: 모든 화살표 신호는 100% 리페인트 없음 / 지연 없음 신호가 한 번 발생하면 고정되며, 깜빡이거나 사라지지 않음 차트 상의 시각적 화살표, 정보 패널, 팝업 알
Apollo BuySell Predictor 는 여러 거래 모듈을 포함하는 전문 거래 시스템입니다. 트레이더에게 고유한 브레이크아웃 영역, 피보나치 기반 지원 및 저항 수준, 피벗 추세선, 풀백 볼륨 신호 및 모든 트레이더가 매일 필요로 하는 기타 유용한 기능을 제공합니다. 시스템은 모든 쌍과 함께 작동합니다. 권장 시간 프레임은 M30, H1, H4입니다. 지표는 H4보다 높은 시간 프레임을 제외하고 다른 시간 프레임에서도 작동할 수 있습니다. 이 시스템은 모든 트레이더가 성공적인 거래에 필요한 모든 것을 제공하므로 보편적입니다. 이 시스템은 여러 가지 방법으로 사용할 수 있습니다. 데이 트레이딩, 스윙 트레이딩, 심지어 스캘핑까지 사용할 수 있습니다. 귀하가 선호하는 거래 스타일에 관계없이 시스템은 귀하가 시장을 실제 모습으로 볼 수 있도록 도와줄 것입니다. 모든 신호는 다시 칠하지 않고 지체하지 마십시오! 거래 기본 설정 및 작업에 따라 시스템의 다른 모듈을 켜거나 끌 수 있습
Advanced Currency Strength28 Indicator
Bernhard Schweigert
4.91 (657)
현재 40% 할인 초보자 또는 전문가 트레이더를 위한 최고의 솔루션! 이 지표는 우리가 독점 기능과 새로운 공식을 통합했기 때문에 독특하고 고품질이며 저렴한 거래 도구입니다. 단 하나의 차트로 28 Forex 쌍의 통화 강도를 읽을 수 있습니다! 새로운 추세 또는 스캘핑 기회의 정확한 트리거 포인트를 정확히 찾아낼 수 있기 때문에 거래가 어떻게 개선될지 상상해 보십시오. 사용 설명서: 여기를 클릭  https://www.mql5.com/en/blogs/post/697384 그것이 첫 번째, 원본입니다! 쓸모없는 지망생 클론을 사지 마십시오. 더 스페셜  강력한 통화 모멘텀을 보여주는 하위 창의 화살표 GAP가 거래를 안내합니다! 기본 또는 호가 통화가 과매도/과매도 영역(외부 시장 피보나치 수준)에 있을 때 개별 차트의 기본 창에 경고 표시가 나타납니다. 통화 강도가 외부 범위에서 떨어질 때 풀백/반전 경고. 교차 패턴의 특별 경고 추세를 빠르게 볼 수 있는 다중 시간
MetaBands M4
Vahidreza Heidar Gholami
3.5 (6)
MetaBands uses powerful and unique algorithms to draw channels and detect trends so that it can provide traders with potential points for entering and exiting trades. It’s a channel indicator plus a powerful trend indicator. It includes different types of channels which can be merged to create new channels simply by using the input parameters. MetaBands uses all types of alerts to notify users about market events. Features Supports most of the channel algorithms Powerful trend detection algorith
제작자의 제품 더 보기
ACB Breakout Arrows MT5
KEENBASE SOFTWARE SOLUTIONS
3.5 (2)
ACB Breakout Arrows 지표는 특별한 돌파 패턴을 감지하여 시장에서 중요한 진입 신호를 제공합니다. 이 지표는 차트를 지속적으로 스캔하면서 한 방향으로 움직임이 자리 잡을 때를 포착하여 큰 움직임 직전에 정확한 진입 신호를 제공합니다. 다중 종목 및 다중 시간대 스캐너는 여기에서 확인하세요 - ACB Breakout Arrows MT5용 스캐너 핵심 기능 지표가 자동으로 손절(Stop Loss) 및 익절(Take Profit) 수준을 제공합니다. 모든 시간대의 돌파 신호를 추적하는 MTF 스캐너 대시보드 포함. 데이 트레이더, 스윙 트레이더 및 스캘퍼에게 적합합니다. 신호 정확도를 높이기 위해 최적화된 알고리즘 사용. 손익분기점 또는 빠른 수익 목표를 위한 특별한 라인 (Quick Profit Line) 제공. 승률, 성공 비율, 평균 수익 등의 성과 분석 지표 제공. 재도색 없음. 신호는 고정되어 신뢰할 수 있습니다. 거래 확인 - ACB Trade Filter 지
KT Auto Support Resistance Levels: MetaTrader 4/5용 멀티 타임프레임 S&R, Smart Zones 및 레벨 대시보드 스윙 고점. 피벗. 오더블록. 이전 고점과 저점. 트레이더마다 시장을 표시하는 방식은 조금씩 다르고, 그 대가는 결국 차트가 치르게 됩니다. 한 화면에 너무 많은 방법을 쌓아 올리면 차트는 더 이상 지도가 아닙니다. 그냥 소음이 됩니다. KT Auto Support Resistance Levels 는 이 문제를 해결합니다. 월간, 주간, 일간, 그리고 현재 타임프레임을 동시에 스캔한 뒤, 실제로 중요한 레벨을 MetaTrader 차트 위에 자동으로 그려 줍니다. 차트가 복잡해지면 한 번의 클릭으로 모든 레벨을 깔끔한 Smart Zones로 병합할 수 있습니다. 또한 실시간 패널이 항상 현재 가격 위와 아래의 가장 가까운 레벨을 보여 주기 때문에, 차트에서 계속 찾아다닐 필요가 없습니다. 지치지 않고 계속해서 중요 레벨을 표시해 주
ACB Trade Filter MT5
KEENBASE SOFTWARE SOLUTIONS
ACB Trade Filter indicator provides a way to filtering out the low probability trading entries in a trading strategy. The indicator uses a sophisticated filtration algorithm based on the market sentiment and trend. The MT4 version of the same indicator is available here ACB Trade Filter MT4 Applications Works great with our indicator ACB Breakout Arrows MT5 Filter out low probability signals from any indicator. Avoid over-trading and minimize the losses. Trade in the direction of market sentime
KT Support and Resistance Levels
KEENBASE SOFTWARE SOLUTIONS
KT Auto Support Resistance Levels: MetaTrader 4/5용 멀티 타임프레임 S&R, Smart Zones 및 레벨 대시보드 스윙 고점. 피벗. 오더블록. 이전 고점과 저점. 트레이더마다 시장을 표시하는 방식은 조금씩 다르고, 그 대가는 결국 차트가 치르게 됩니다. 한 화면에 너무 많은 방법을 쌓아 올리면 차트는 더 이상 지도가 아닙니다. 그냥 소음이 됩니다. KT Auto Support Resistance Levels 는 이 문제를 해결합니다. 월간, 주간, 일간, 그리고 현재 타임프레임을 동시에 스캔한 뒤, 실제로 중요한 레벨을 MetaTrader 차트 위에 자동으로 그려 줍니다. 차트가 복잡해지면 한 번의 클릭으로 모든 레벨을 깔끔한 Smart Zones로 병합할 수 있습니다. 또한 실시간 패널이 항상 현재 가격 위와 아래의 가장 가까운 레벨을 보여 주기 때문에, 차트에서 계속 찾아다닐 필요가 없습니다. 지치지 않고 계속해서 중요 레벨을 표시해 주
ACB Trade Filter MT4
KEENBASE SOFTWARE SOLUTIONS
5 (1)
The ACB Trade Filter indicator provides a solution for filtering out the low probability trading setups in a trading strategy. The indicator uses a sophisticated filtration algorithm based on the market sentiment and trend. Applications Works great with our indicator " ACB Breakout Arrows ". Filter out low probability signals from any indicator. Avoid overtrading and minimize the losses. Trade in the direction of market sentiment and trend. Avoid the choppiness in the market. How to use Only L
KT Heiken Ashi Smoothed MT4
KEENBASE SOFTWARE SOLUTIONS
KT Heiken Ashi Smoothed 는 표준 Heiken Ashi 를 한층 더 부드럽게 처리한 버전으로, 추세 전환 시 매수/매도 화살표도 함께 표시합니다. 복잡한 설정 없이 시장의 핵심 변화를 직관적으로 보여주기 때문에 바쁜 트레이더에게 유용합니다. 상태가 약세에서 강세로 전환되면 매수 화살표가 나타납니다. 상태가 강세에서 약세로 전환되면 매도 화살표가 나타납니다. 모바일 알림, 이메일, 소리, 팝업 경고를 모두 지원합니다. Heiken Ashi Smoothed 란? 표준 Heiken Ashi 에 존재하는 잡음과 허위 신호를 제거하기 위해 두 개의 이동 평균으로 가격 데이터를 부드럽게 처리합니다. 약간의 지연은 있지만, 스윙 포인트와 새롭게 형성되는 추세를 명확히 드러내며, 평소 시야에 잘 들어오지 않는 가격 변화를 확인할 수 있습니다. 이를 통해 트레이더는 진입·청산 전략과 리스크 관리를 세밀하게 조정할 수 있습니다. 활용 이 지표는 외환, 원자재, 주식 등 다양한
KT Auto Fibo MT5
KEENBASE SOFTWARE SOLUTIONS
5 (1)
KT Auto Fibo는 현재 추세 방향에 따라 피보나치 되돌림 레벨을 자동으로 그립니다. 고점과 저점은 차트에 표시된 최대값과 최소값을 사용하여 자동으로 선택됩니다. 사용자는 차트를 확대/축소하거나 스크롤하여 피보나치 레벨을 적절히 조정할 수 있습니다. 모드 자동:  차트 영역을 기반으로 피보나치 레벨을 자동으로 그립니다. 수동: 피보나치 레벨을 한 번만 그리고, 이후에는 앵커 포인트를 수동으로 조정할 수 있습니다. 사용 방법: 미래 수익 목표를 논리적으로 예측하는 데 도움이 됩니다. 지지/저항선이나 추세선과 결합하면 강력한 반전 가능성을 제공합니다. 추세 시장에서 저위험 진입 기회를 제공합니다. 입력 매개변수 자동:  사람의 개입 없이 피보나치 되돌림 레벨을 자동으로 그립니다. 수동:  피보나치 되돌림 레벨을 한 번만 그리고, 이후에는 앵커 포인트를 직접 늘릴 수 있습니다. 미되돌림 영역 표시: 가격 되돌림이 아직 닿지 않은 차트 영역을 표시하거나 숨깁니다. 나머지 입력 항
FREE
외환 거래를 한다면, 통화 강도와 통화쌍 상관관계에 대한 상세한 정보를 아는 것은 거래 실력을 한 단계 끌어올리는 데 큰 도움이 됩니다. 상관관계를 분석하면 리스크를 절반으로 줄일 수 있고, 강도 분석을 통해 수익을 극대화할 수 있습니다. 이 지표는 통화 강도 분석과 통화쌍 상관관계를 결합하여 가장 적합한 통화쌍을 선택할 수 있도록 도와주는 하이브리드 접근 방식을 제공합니다. 통화 강도 분석 활용 방법 예를 들어, 당신의 거래 전략이 AUD/JPY 매수 기회를 제공한다고 가정해 봅시다. 하지만 KT 통화 강도 분석을 통해 JPY가 AUD보다 강해지고 있다는 것을 발견했다면, 이 거래는 손실로 끝날 가능성이 높습니다. 이 지표를 사용하면 이러한 손실을 쉽게 피할 수 있습니다. 통화쌍 상관관계 활용 방법 또 다른 예로, 거래 전략이 NZD/USD와 GBP/JPY 두 통화쌍 모두에 대해 매도 기회를 제공한다고 가정해 봅시다. KT 통화쌍 상관관계 분석을 사용하면 이 두 통화쌍 간 상관
KT MA Crossover MT5
KEENBASE SOFTWARE SOLUTIONS
KT MA Crossover는 사용자가 선택한 이동 평균선의 교차를 기반으로 매수 및 매도 화살표를 차트에 표시합니다. 또한 각 연속적인 신호에 대해 적절한 알림을 생성하며, MFE(최대 유리 변동값)도 함께 표시하여 트레이더가 가능한 최대 이익 범위를 파악할 수 있도록 도와줍니다. 이동 평균 교차 전략은 전 세계 트레이더들이 가장 많이 사용하는 기본적인 거래 전략 중 하나입니다. 일반적으로 빠른 이동 평균선과 느린 이동 평균선을 조합하여 교차 방향에 따라 매수 또는 매도 진입 신호를 식별합니다. 매수 신호 – 빠른 MA가 느린 MA를 상향 돌파할 때. 매도 신호 – 빠른 MA가 느린 MA를 하향 돌파할 때. 기능 각 이동 평균의 속성을 자유롭게 설정할 수 있습니다. 각 신호에 대해 MFE 값을 제공합니다. 가볍고 효율적으로 작동하는 인디케이터로 시스템 리소스 사용이 적습니다. MetaTrader의 모든 경고 기능이 포함되어 있습니다. 단점  이동 평균은 과거 데이터를 기반으로
FREE
KT Auto Fibo
KEENBASE SOFTWARE SOLUTIONS
KT Auto Fibo는 현재 추세 방향에 따라 피보나치 되돌림 레벨을 자동으로 그립니다. 고점과 저점은 차트에 표시된 최대값과 최소값을 사용하여 자동으로 선택됩니다. 사용자는 차트를 확대/축소하거나 스크롤하여 피보나치 레벨을 적절히 조정할 수 있습니다. 모드 자동:  차트 영역을 기반으로 피보나치 레벨을 자동으로 그립니다. 수동: 피보나치 레벨을 한 번만 그리고, 이후에는 앵커 포인트를 수동으로 조정할 수 있습니다. 사용 방법: 미래 수익 목표를 논리적으로 예측하는 데 도움이 됩니다. 지지/저항선이나 추세선과 결합하면 강력한 반전 가능성을 제공합니다. 추세 시장에서 저위험 진입 기회를 제공합니다. 입력 매개변수 자동:  사람의 개입 없이 피보나치 되돌림 레벨을 자동으로 그립니다. 수동:  피보나치 되돌림 레벨을 한 번만 그리고, 이후에는 앵커 포인트를 직접 늘릴 수 있습니다. 미되돌림 영역 표시: 가격 되돌림이 아직 닿지 않은 차트 영역을 표시하거나 숨깁니다. 나머지 입력 항
FREE
KT Pin Bar MT5
KEENBASE SOFTWARE SOLUTIONS
KT Pin Bar identifies the pin bar formation which is a type of price action pattern which depicts a sign of reversal or rejection of the trend. When combined with support and resistance, BRN and other significant levels, Pin Bar pattern proved to be a very strong sign of reversal. Basically, a pin bar is characterized by a small body relative to the bar length which is closed either in upper or lower 50% part of its length. They have very large wicks and small candle body. A pin bar candlestic
FREE
KT MA Crossover MT4
KEENBASE SOFTWARE SOLUTIONS
KT MA Crossover는 사용자가 선택한 이동 평균선의 교차를 기반으로 매수 및 매도 화살표를 차트에 표시합니다. 또한 각 연속적인 신호에 대해 적절한 알림을 생성하며, MFE(최대 유리 변동값)도 함께 표시하여 트레이더가 가능한 최대 이익 범위를 파악할 수 있도록 도와줍니다. 이동 평균 교차 전략은 전 세계 트레이더들이 가장 많이 사용하는 기본적인 거래 전략 중 하나입니다. 일반적으로 빠른 이동 평균선과 느린 이동 평균선을 조합하여 교차 방향에 따라 매수 또는 매도 진입 신호를 식별합니다. 매수 신호 – 빠른 MA가 느린 MA를 상향 돌파할 때. 매도 신호 – 빠른 MA가 느린 MA를 하향 돌파할 때. 기능 각 이동 평균의 속성을 자유롭게 설정할 수 있습니다. 각 신호에 대해 MFE 값을 제공합니다. 가볍고 효율적으로 작동하는 인디케이터로 시스템 리소스 사용이 적습니다. MetaTrader의 모든 경고 기능이 포함되어 있습니다. 단점  이동 평균은 과거 데이터를 기반으로
FREE
KT Heiken Ashi Smoothed MT5
KEENBASE SOFTWARE SOLUTIONS
KT Heiken Ashi Smoothed 는 표준 Heiken Ashi 를 한층 더 부드럽게 처리한 버전으로, 추세 전환 시 매수/매도 화살표도 함께 표시합니다. 복잡한 설정 없이 시장의 핵심 변화를 직관적으로 보여주기 때문에 바쁜 트레이더에게 유용합니다. 상태가 약세에서 강세로 전환되면 매수 화살표가 나타납니다. 상태가 강세에서 약세로 전환되면 매도 화살표가 나타납니다. 모바일 알림, 이메일, 소리, 팝업 경고를 모두 지원합니다. Heiken Ashi Smoothed 란? 표준 Heiken Ashi 에 존재하는 잡음과 허위 신호를 제거하기 위해 두 개의 이동 평균으로 가격 데이터를 부드럽게 처리합니다. 약간의 지연은 있지만, 스윙 포인트와 새롭게 형성되는 추세를 명확히 드러내며, 평소 시야에 잘 들어오지 않는 가격 변화를 확인할 수 있습니다. 이를 통해 트레이더는 진입·청산 전략과 리스크 관리를 세밀하게 조정할 수 있습니다. 활용 이 지표는 외환, 원자재, 주식 등 다양한
KT Psar Arrows
KEENBASE SOFTWARE SOLUTIONS
KT Psar Arrows는 표준 파라볼릭 SAR 지표를 사용하여 차트에 화살표를 표시합니다. 캔들의 고가가 SAR에 닿을 때 상승 화살표가 표시되고, 캔들의 저가가 SAR에 닿을 때 하락 화살표가 표시됩니다. 신호는 봉이 마감되기를 기다리지 않고 실시간으로 생성됩니다.  특징 Parabolic SAR 지표를 활용한 거래 전략을 실험하고 싶은 트레이더에게 유용한 도구입니다.  시장 반전 포인트를 찾는 데 사용할 수 있습니다. 사용자 정의 PSAR 입력 지원. MT4의 모든 알림 기능을 지원합니다. 주의사항: Parabolic SAR은 후행성 및 엄격한 기계적 지표입니다. 모든 잠재적 거래는 명확히 정의된 규칙에 따라 필터링해야 합니다.     입력 파라미터 PSAR 스텝: 스텝 값을 입력하세요. PSAR 최대값: 최대값을 입력하세요. PSAR 점 표시: PSAR 점을 표시하거나 숨길 수 있습니다. PSAR 점을 표시하지 않아도 화살표는 정상 작동합니다. 나머지 입력 항목은 직관적
KT Volatility Oscillator MT5
KEENBASE SOFTWARE SOLUTIONS
KT 변동성 오실레이터는 과거와 현재의 시장 데이터를 수학적 공식으로 분석하여 오실레이터 형태로 결과를 표시합니다. 증가하는 파동과 감소하는 파동은 각각 자산의 높은 변동성과 낮은 변동성을 나타냅니다.  간단히 말해, 변동성은 일정 기간 동안 자산 가격이 얼마나 변동했는지를 측정하는 지표입니다. 변동성이 없다면 시장의 움직임이 거의 없을 것이고, 트레이더들은 가격 변동을 통해 수익을 얻을 수 없을 것입니다. 외환 시장에서 변동성 활용 외환 시장에서 변동성을 적절히 활용하면 보다 효과적으로 거래할 수 있으며, 기대치를 현실에 맞춰 조정하는 데 도움이 됩니다.  높은 변동성 추세 기반 시스템은 변동성이 높은 시장에서 큰 스윙과 더 긴 포지션 보유 기간 덕분에 매우 잘 작동합니다. 고변동성 구간에서 발생하는 돌파는 더 많은 핍스를 획득할 수 있는 기회를 제공합니다. 낮은 변동성 평균 회귀 시스템은 시장이 평균값으로 되돌아가려는 성질이 있기 때문에 낮은 변동성 환경에서 특히 효과적입니다
FREE
KT Round Numbers MT5
KEENBASE SOFTWARE SOLUTIONS
KT Round Numbers plots the round number levels which are also commonly known as psychological levels in the Forex world. In the context of Forex trading, round number levels are those levels in which there are two or more zeroes at the end. They are named as 00 levels on the chart. Some traders also consider the halfway points as a valid round number level. They are named as 50 levels on the chart. Use of round number levels in trading Round number levels work as strong support and resistance
FREE
KT Trend Magic MT5
KEENBASE SOFTWARE SOLUTIONS
KT Trend Magic shows the trend depiction on chart using the combination of market momentum and volatility. A smoothing coefficient is used to smooth out the noise from the signal.It can be used to find out the new entries or confirm the trades produced by other EA or indicator. Features Drag n drop MTF scanner which scans for the new signals across multiple time-frames. Find new entries in the trend direction. Improve the accuracy of other indicators when used in conjunction. Can be used as a d
FREE
KT Volatility Oscillator
KEENBASE SOFTWARE SOLUTIONS
KT 변동성 오실레이터는 과거와 현재의 시장 데이터를 수학적 공식으로 분석하여 오실레이터 형태로 결과를 표시합니다. 증가하는 파동과 감소하는 파동은 각각 자산의 높은 변동성과 낮은 변동성을 나타냅니다.  간단히 말해, 변동성은 일정 기간 동안 자산 가격이 얼마나 변동했는지를 측정하는 지표입니다. 변동성이 없다면 시장의 움직임이 거의 없을 것이고, 트레이더들은 가격 변동을 통해 수익을 얻을 수 없을 것입니다. 외환 시장에서 변동성 활용 외환 시장에서 변동성을 적절히 활용하면 보다 효과적으로 거래할 수 있으며, 기대치를 현실에 맞춰 조정하는 데 도움이 됩니다.  높은 변동성 추세 기반 시스템은 변동성이 높은 시장에서 큰 스윙과 더 긴 포지션 보유 기간 덕분에 매우 잘 작동합니다. 고변동성 구간에서 발생하는 돌파는 더 많은 핍스를 획득할 수 있는 기회를 제공합니다. 낮은 변동성 평균 회귀 시스템은 시장이 평균값으로 되돌아가려는 성질이 있기 때문에 낮은 변동성 환경에서 특히 효과적입니다
FREE
KT Pin Bar
KEENBASE SOFTWARE SOLUTIONS
KT Pin Bar identifies the pin bar formation which is a type of price action pattern which depicts a sign of reversal or rejection of the trend. When combined with support and resistance, BRN and other significant levels, Pin Bar pattern proved to be a very strong sign of reversal. Basically, a pin bar is characterized by a small body relative to the bar length which is closed either in upper or lower 50% part of its length. They have very large wicks and small candle body. A pin bar candlestic
FREE
KT Trend Magic
KEENBASE SOFTWARE SOLUTIONS
KT Trend Magic shows the trend depiction on chart using the combination of market momentum and volatility. A smoothing coefficient is used to smooth out the noise from the signal.It can be used to find out the new entries or confirm the trades produced by other EA/Indicators. Usage Drag n drop MTF scanner which scans for the new signals across multiple time-frames. Find new entries in the trend direction. Improve the accuracy of other indicators when used in conjunction. Can be used as a dynami
FREE
KT Round Numbers MT4
KEENBASE SOFTWARE SOLUTIONS
KT Round Numbers plots the round number levels which are also commonly known as psychological levels in the Forex world. In the context of Forex trading, round number levels are those levels in which there are two or more zeroes at the end. They are named as 00 levels on the chart. Some traders also consider the halfway points as a valid round number level. They are named as 50 levels on the chart. Use of round number levels in trading Round number levels work as strong support and resistance
FREE
ACB Breakout Arrows
KEENBASE SOFTWARE SOLUTIONS
4.15 (34)
ACB Breakout Arrows 지표는 특별한 돌파 패턴을 감지하여 시장에서 매우 중요한 진입 신호를 제공합니다. 이 지표는 차트를 지속적으로 스캔하며 한 방향으로 안정적인 모멘텀이 형성되는지를 확인하고, 주요 움직임 직전에 정확한 진입 신호를 제공합니다.  다중 심볼 및 다중 타임프레임 스캐너 받기 – ACB Breakout Arrows MT4용 스캐너 주요 기능 지표가 자동으로 손절(Stop Loss) 및 이익실현(Take Profit) 레벨을 제공합니다. 모든 시간대의 돌파 신호를 추적하는 MTF 스캐너 대시보드가 포함되어 있습니다. 단타 트레이더, 스윙 트레이더, 스캘퍼에게 적합합니다. 정확도를 높이기 위한 최적화된 알고리즘 사용. 손익분기(Breakeven) 또는 단기 목표를 위한 특수 라인(퀵 프로핏 라인) 제공. 승률, 성공률, 평균 수익 등과 같은 성과 분석 지표 제공. 리페인트 없음 – 한번 생성된 신호는 사라지지 않습니다. 거래 확인 -  신뢰도 낮은 신호를
KT Momentum Arrows
KEENBASE SOFTWARE SOLUTIONS
KT Momentum Arrows 인디케이터는 순간적인 돌파 신호에 기반한 도구로, 밴드의 이탈 범위와 특정 방향으로 나타나는 변동성을 계산하여 신호를 생성합니다. 이 도구는 가격의 강한 움직임이 시작되는 시점을 빠르게 감지할 수 있도록 설계되었습니다. 가격이 상단 밴드를 상향 돌파하여 마감되면 매수 신호가 생성되며, 하단 밴드를 하향 돌파하여 마감되면 매도 신호가 생성됩니다. 밴드의 이탈과 변동성에 동시에 영향을 주는 '계수' 입력값이 있으며, 이는 거래 종목 및 시간 프레임에 따라 신중하게 분석 및 선택해야 합니다. 주요 특징 재도색 없음! 모멘텀 트레이더를 위한 훌륭한 진입 도구입니다. 승률, 손익비, 평균 수익 등 성과 분석 기능 포함. 단타, 스윙, 스캘핑 모든 스타일에 적합합니다. 입력 파라미터 히스토리 바:  지표 계산에 사용할 바의 수. 모멘텀 계수:  밴드 이탈 및 변동성 측정에 사용하는 계수. 성과 분석:  수익 추세선을 포함한 성과 분석 표시 여부.  알림
KT COG Advanced MT4
KEENBASE SOFTWARE SOLUTIONS
1 (1)
KT COG is an advanced implementation of the center of gravity indicator presented by John F. Ehlers in the May 2002 edition of Technical Analysis of Stocks & Commodities magazine. It's a leading indicator which can be used to identify the potential reversal points with the minimum lag. The COG oscillator catches the price swings quite effectively. MT5 version of the same indicator is available here KT COG Advanced MT5 Calculation of COG The COG indicator is consist of the two lines. The main l
KT Ichimoku Trader
KEENBASE SOFTWARE SOLUTIONS
1 (1)
KT Ichimoku Trader is a fully automated expert advisor that offers five popular trading strategies based on the Ichimoku indicator. Each strategy has it's own entry and exit method without any interference to other strategies. The Ichimoku system can be applied to all major currency pairs and metals. However, we found that it performs reasonably well mainly on two pairs.   MT5 Version is available here  https://www.mql5.com/en/market/product/35043 Features Trade up to 5 famous trading strategi
KT COG Robot
KEENBASE SOFTWARE SOLUTIONS
KT COG Robot is a fully automated Expert Advisor based on the KT COG Indicator . The COG indicator was originally presented by John F. Ehlers in the May 2002 edition of Technical Analysis of Stocks & Commodities magazine. The EA fires a long trade when COG line cross above the signal line and a short trade is fired when the COG line cross below the signal line.  Adaptive Filtration Our adaptive filtration algorithm combines the original COG formula with the major trend direction and market acce
ACB Breakout Arrows EA
KEENBASE SOFTWARE SOLUTIONS
이 EA는 저희의 커스텀 인디케이터인 "ACB Breakout Arrows" 를 기반으로 한 100% 자동화된 전문가용 어드바이저입니다. 양방향으로 자주 발생하는 돌파 패턴을 이용하며, 외부 입력 값인 "Signal Sensitivity"를 통해 진입 신호의 강도를 조절할 수 있습니다. 거래 확인 ACB Breakout Arrows EA는 또 다른 커스텀 인디케이터인 ACB Trade Filter 를 사용하여 거래 진입 조건을 필터링할 수 있는 기능을 제공합니다. 강력한 매수: 위쪽 화살표 + 초록색 히스토그램 + 상승 추세 강력한 매도: 아래쪽 화살표 + 빨간색 히스토그램 + 하락 추세 히스토그램이 회색이고 추세가 횡보일 경우, EA는 거래를 피합니다. EA는 모든 인디케이터와 의존 파일을 백그라운드에서 로드하며, 차트에는 표시되지 않습니다. 주요 기능 오랜 기대 끝에 이제 ACB Breakout Arrows 인디케이터 로 완전 자동 매매가 가능합니다. ACB Trade F
KT Asian Breakout
KEENBASE SOFTWARE SOLUTIONS
4 (1)
KT Asian Breakout carefully analyzes the range-bound market during the Asian session and then fires a long or short trade after doing some preassessment based on its inbuilt technical analysis module. The executed orders are closed within a day before the completion of the next day session. The inbuilt technical analysis module checks for the session range and compares it with the last 20 days price movement. If it finds any erratic price movement within the session, the orders are not executed
KT London Breakout
KEENBASE SOFTWARE SOLUTIONS
First thirty minutes are essential for a trading session. The early reaction of traders and market players sets a path for the rest of the day. KT London Breakout EA takes advantage of this phenomenon, and after analyzing the first thirty minutes of London session, it places two bidirectional pending orders. One of pending order is eventually canceled after realizing the market direction with certainty. It has been strictly tested and developed for EUR/JPY using 30-Min Time Frame. You can expe
MACD Divergence Seeker
KEENBASE SOFTWARE SOLUTIONS
KT MACD Divergence Seeker trades the regular and hidden divergence signals generated by our free indicator named KT MACD Divergence indicator. Trading the standalone divergences can be a risky affair that's why the KT MACD Divergence Seeker combines the standard divergence signals with an advanced analysis module to exploit the price inefficiencies on some FX pairs. What is the Divergence exactly? As a general conception if the price is making higher highs, then macd should also be making hig
필터:
리뷰 없음
리뷰 답변