Pivot Points MT4

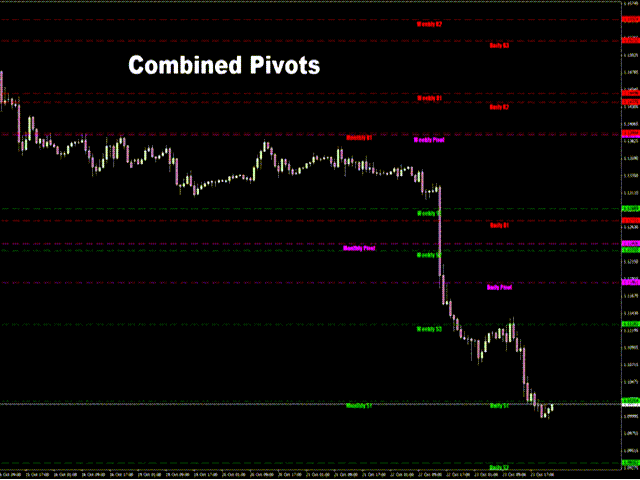
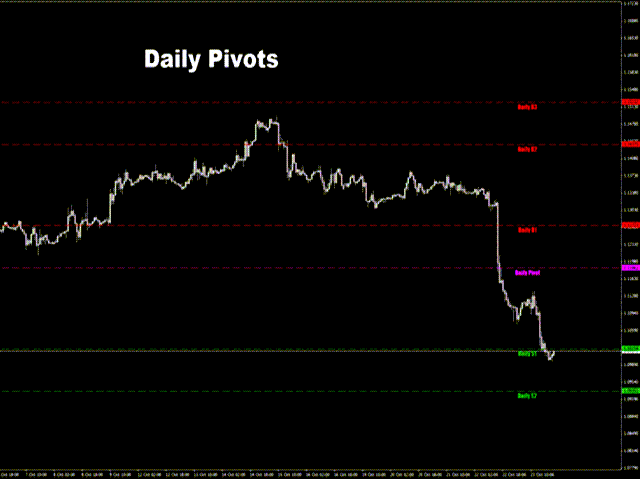
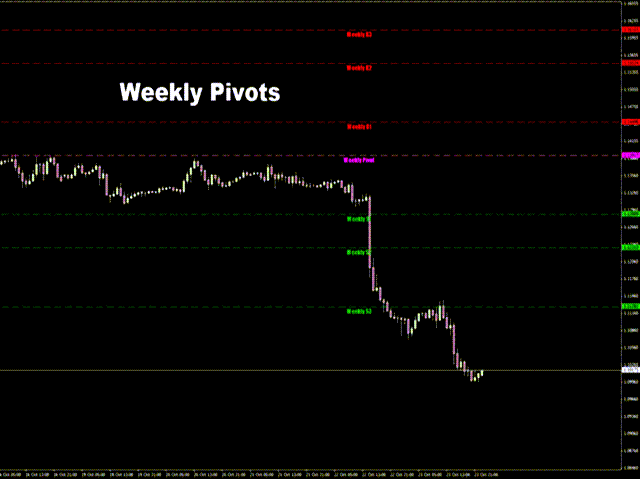
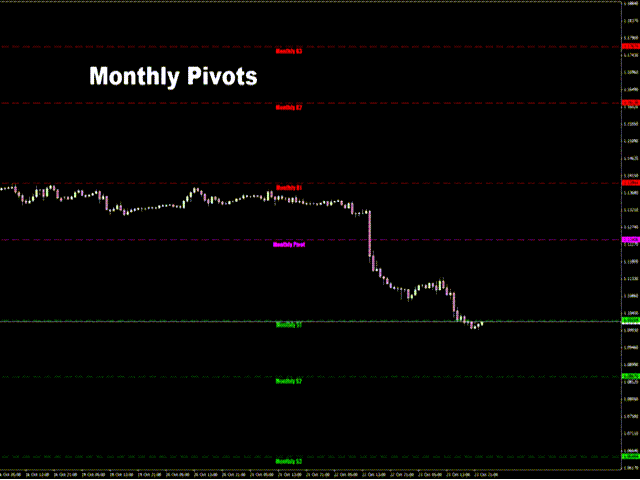
KT Pivot Points trace automatiquement les niveaux de pivot quotidiens, hebdomadaires et mensuels sur un graphique à partir des dernières données. Les points pivots sont un indicateur largement utilisé en analyse technique, en particulier sur le marché du Forex.

Fonctionnalités

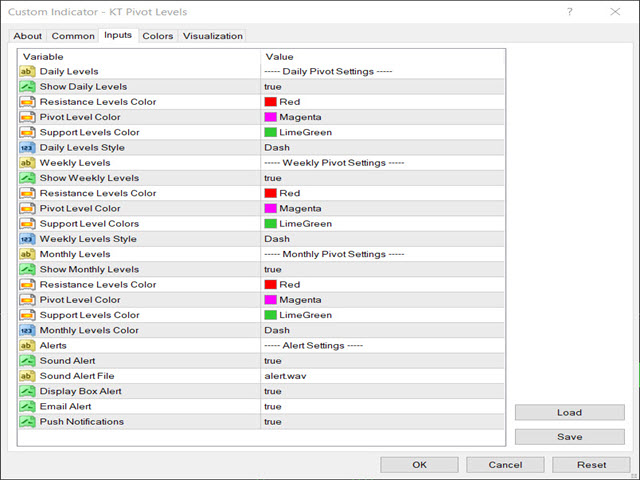
  • Envoie des alertes lorsque le prix touche un niveau de pivot. 
  • Offre une personnalisation complète pour chaque type de niveau de pivot.  
  • Affiche les pivots quotidiens, hebdomadaires et mensuels de façon claire.
  • Utilise très peu de ressources CPU pour un calcul rapide.
  • Compatible avec d'autres indicateurs sur le graphique.

Qu’est-ce qu’un point pivot ?

Un point pivot est calculé à l’aide de la moyenne des prix haut, bas et de clôture de la séance de trading précédente. 

À partir de ces calculs, il est possible d’anticiper les niveaux de support et de résistance futurs, qui peuvent être utilisés pour prévoir les mouvements de prix autour de ces niveaux.

On considère généralement que si le prix se situe au-dessus du pivot, la tendance est haussière ; s’il est en dessous, elle est baissière.

Formule des pivots

Pour calculer les niveaux pivots, on utilise les points haut, bas et de clôture du jour, de la semaine ou du mois précédent.

  • P = (H + L + C) / 3
  • R1 = P + (P − L) = 2×P − L
  • S1 = P − (H − P) = 2×P − H
  • R2 = P + (H − L)
  • S2 = P − (H − L)
  • R3 = H + 2×(P − L) = R1 + (H − L)
  • S3 = L − 2×(H − P) = S1 − (H − L)

Où,

P = Pivot, H = Haut, L = Bas, C = Clôture
R = Résistance
S = Support

Comment utiliser les points pivots

Les niveaux pivots peuvent servir de support/résistance pour repérer les retournements, les poursuites de tendance, les niveaux de stop-loss et de prise de bénéfices. Les day-traders utilisent les pivots quotidiens, les swing traders les pivots hebdomadaires et les investisseurs long terme les pivots mensuels.

Les traders de position et les investisseurs peuvent aussi utiliser les données annuelles pour estimer les niveaux importants des années à venir.

Stratégies basées sur les pivots

En général, un trader peut acheter lorsque le prix atteint un niveau de support, et vendre lorsqu’il atteint un niveau de résistance. Cependant, cette stratégie peut être risquée en cas de marché fortement directionnel.

Les niveaux pivots peuvent être utilisés de manière plus intelligente. Si le prix est sous le niveau pivot central, on s’attend à une tendance baissière ; s’il est au-dessus, à une tendance haussière.

Aucun indicateur ou méthode n’est infaillible. Les niveaux pivots peuvent parfois échouer, mais ils restent un excellent repère dans votre stratégie de trading.

Produits recommandés
This is a Multi-Time-Frame Zigzag indicator You can change parameters of Zigzag, include Zigzag Depth, Zigzag Deviation, Zigzag Backstep. You can choose which Time Frame to display Zigzag by turn ShowXXX to true or false (ShowXXX = ShowM1, ShowM5, ShowM15...). Noted: Lower Time Frame Zigzag will not display on Higher Time Frame. Example: Your current Time Frame is H1, you can not see Zigzag of M1 to M30 even you turn them on.
Raymond Cloudy Day Indicator for MT4 – Pivot-Based Reversal and Trend Levels Raymond Cloudy Day Indicator is a pivot-based level indicator for MetaTrader 4 (MT4). It was developed by Ngo The Hung based on Raymond’s original idea and is designed to give a structured view of potential reversal zones, trend extensions and support/resistance levels directly on the chart. The default settings are optimised for XAUUSD on the H1 timeframe, but the indicator can be tested and adjusted for other symbols
BeST_ Classic Pivot Points is an MT4 Indicator that is based on the widely known and definitely classic Pivot Point of a market prices activity. A pivot point is calculated as an average of significant prices (high,low,close) from the performance of a market in the prior trading period. If the market in the following period trades above the pivot point it is usually evaluated as a bullish sentiment, whereas trading below the pivot point is seen as bearish. A pivot point and the associated suppo
FREE
Grapic ByArrowTrend Pro
Truong Cong Truc
1 (1)
Indicator support for only: Entry Point to Trend Pro Link indicator  support   :   https://www.mql5.com/en/market/product/70867 Supports all currency pairs declared in the definition. Help investors do not need to open many charts. Notice the DEAL:  multiple time frames confluence   M15, H1, H4. Entry Point to Trend Pro The indicator helps investors to identify the earliest and perfect reversal point. Easy to make decision to trade with the trend   Price action trading. support resistance an
FREE
The Auto Super Pivot indicator is an indicator designed to calculate support points and resistance points for pivot points. this indicator has the ability to calculate standard pivot, fibonacci, camarilla, woodie and demark pivot points. It also allows you to use all time zones with the time frame feature. Another feature of the indicator is the auto time slice feature. This feature allows automatic calculations without having to set any time zone. Features 6 different pivot calculation modes A
FiboZag
Andriy Sydoruk
Indicator FiboZag - transfer the indicator to the chart and the Fibonacci levels will be built automatically on the last ZigZag turn. The main advantage lies in the correct construction of Fibonacci levels and markup of price levels. Simple, visual and effective use. The indicator is not redrawn and does not lag. Works on all currency pairs and on all timeframes.
Power Renko is an indicator which plots Renko bricks underneath the chart using a histogram. You can select the brick size and the timeframe of the Renko bricks as well as whether or not to use the close price or the high/low price of the candles. Renko bricks are based on price alone, not time, therefor the Renko bricks will not be aligned with the chart's time. They are extremely useful for trend trading and many different strategies can be formed from them. Buffers are provided allowing you t
Classic Fractals indicator for MT4, with additional Trendlines connecting the latest couples of fractals ( fractals are showing highest high, and lowest low on each period) Rules for trendlines: -if new top fractal is below the last one = new resistance line -if new bot fractal is above the last one = new support line -Trendlines can be hidden -Fractals can be hidden Fractal Period = can be both even or uneven number, as it is setting for half (one side) of the bars sequence for findin
pivot points using by many traders and pivot levels most of the times are very helpfull . this indicator is a custom with internal parameters. it can show two times pivot (weekly and daily). you can choose periods total for each time showing pivots.( 1 week , 2 week ,...1day , 2day ,...) when use weekly and daily pivots , it can show you many support and resistance zones. if have proposal comment too me for upgrading indicator.
FREE
L'indicateur vous permet de déterminer la direction actuelle des prix et la volatilité du marché. Cette version du Traders Dynamic Index a supprimé le redessinage des données historiques, la vitesse de calcul de l'algorithme optimisée, plus de paramètres externes pour des ajustements plus précis, et ses fonctionnalités étendues : ajout de la sélection de l'oscillateur initial et des méthodes de lissage des moyennes . Paramètres: Mode Osc - estimation sélection de l'oscillateur Period Osc - la pé
SR indicator
Alexander Chertnik
5 (2)
SR is a support and resistance indicator, it shows major highs and lows by different colors. The color of a level is changing if the last high or low are touching it. After the closing of a bar above or below level, it will delete it. extern inputs: loop for candles / colors / drawing time *This indicator signal is not perfect and have to be used with other market analysis and confirmations.
FREE
VJ Pivot Levels
Vijayaratna Kumar Boda
4.25 (4)
Introduction: Whatever trading method you use, it is important to know the Pivot levels to take the key attention for your entries & exits. This indicator has been made using the standard classic formula for Auto drawing the Pivot levels. Also based on the previous day trading range, the probable expected today trading range has been highlighted in a different color for your reference. Output of the Indicator: This Indicator gives the Pivot level Different resistance Levels Different Support le
The   Pivot Point indicator   automatically calculates and displays the pivot point line and support and resistance levels. Pivot can be calculated according to the Classic, Floor, Fibonacci, Woodie, Camarilla or DeMark formula. It is also possible to select the period for calculating the indicator. A trader can choose from daily, weekly, monthly, or user-defined periods. Types of pivots Classic Floor Fibonacci Woodie Camarilla DeMark Main features The indicator shows the current and historic
FREE
What is a Pivot? A pivot is a significant price level known in advance which traders view as important and may make trading decisions around that level. As a technical indicator, a pivot price is similar to a resistance or support level. If the pivot level is exceeded, the price is expected to continue in that direction. Or the price could reverse at or near that level. What does a Pivot Tell You? There are pivots and pivot points. These terms may mean different things to different people.
Pivot Point Indicator (Poivt) ClassicMode indicator calculation formula (ClassicMode): pp=(High+Low+Close)/3.0         s1=2*pp-High         s2=pp-(High-Low)         s3=Low-2*(High-pp)         r1=2*pp-Low         r2=pp+(High-Low)         r3=High+2*(pp-Low) Woodie Mode indicator calculation formula (WoodieMode): pp=(High+Low+2*Close)/4.0         s1=2*pp-High         s2=pp-(High-Low)         s3=Low-2*(High-pp)         r1=2*pp-Low                 r2=pp+(High-Low)         r3=High+2*(pp-Low) Fibo
.....................................hi....................... ................for showing high s and low s and support and resistanses .....................we have a lot of ways............................... it can be helpful for finding trends , higher highs , higher lows , lower highs , lower lows .......................today i write on of thems.......................... ........................you can enter the number of last support and resistanses .........................and it will dra
FREE
The price is moving between two curve tunnel lines in a trend. The two lines of a tunnel represent support and resistance. In an uptrend, for instance, a trade might be entered at the support of the trend line (shown by the red line in the chart) and exited at resistance of the upper tunnel line (shown by the blue line). Tunnel show trend direction for any timeframe (if you have enough bars on the chart for higher timeframes). Trend, or price tunnel, can be up, down or sideways. If the current p
Pivots MT4
Denis Luchinkin
Pivots MT4 - Простой и удобный индикатор уровней pivot , рассчитывает уровни по методам  Classic , Fibonacci , DeMark , Camarilla , WooDie , Central Pivot Range . Индикатор выгодно отличается следующим Рассчитывает уровни pivot по методам  Classic ,  Fibonacci ,  DeMark ,  Camarilla ,  WooDie ,  Central Pivot Range ; Выводит на графике текущие уровни и уровни на предыдущих периодах; Выводит на графике выбранные метод и период, названия уровней и их ценовые значения. Параметры Pivot Method - Выпа
The indicator allows to find consolidations. It is meant for channel breakthrough. Easy to use, it has only three parameters: Minimum number of bars to analyze Consolidation tunnel Indicator color It works on all timeframes . Approximate settings are adjusted for H1 by default. Works on all currency pairs. This indicator does not repaint and is not recalculated. All screenshots are real!
"Auto FIBO Pro" Crypto_Forex indicator - est un excellent outil auxiliaire dans le trading ! - L'indicateur calcule et place automatiquement sur le graphique les niveaux de Fibo et les lignes de tendance locales (couleur rouge). - Les niveaux de Fibonacci indiquent les zones clés où le prix peut s'inverser. - Les niveaux les plus importants sont 23,6 %, 38,2 %, 50 % et 61,8 %. - Vous pouvez l'utiliser pour le scalping inversé ou pour le trading en grille de zones. - Il existe également de nomb
Pivot Point Fibo RSJ est un indicateur qui trace les lignes de support et de résistance de la journée en utilisant les taux de Fibonacci. Cet indicateur spectaculaire crée jusqu'à 7 niveaux de support et de résistance via Pivot Point en utilisant les taux de Fibonacci. C'est fantastique de voir comment les prix respectent chaque niveau de ce support et de cette résistance, où il est possible de percevoir les points d'entrée/sortie possibles d'une opération. Caractéristiques Jusqu'à 7 niveaux
FREE
This indicator is stand alone version from  MP Pivot Levels  (All in one) containing Woodie Pivots. Woodie’s pivot points are made up of multiple key levels, calculated from past price points, in order to frame trades in a simplistic manner. The key levels include the ‘pivot’ itself, and multiple support and resistance levels (usually up to three each). Traders use these levels as a guide for future price movements when setting up trades. The pivot : (Previous high + previous low + 2 x previous
FREE
Free automatic Fibonacci is an indicator that automatically plots a Fibonacci retracement based on the number of bars you select on the BarsToScan setting in the indicator. The Fibonacci is automatically updated in real time as new highest and lowest values appears amongst the selected bars. You can select which level values to be displayed in the indicator settings. You can also select the color of the levels thus enabling the trader to be able to attach the indicator several times with differe
FREE
Trendline indicator
David Muriithi
2 (1)
Are you tired of drawing trendlines every time you're analyzing charts? Or perhaps you would like more consistency in your technical analysis. Then this is for you. This indicator will draw trend lines automatically when dropped on a chart. How it works Works similar to standard deviation channel found on mt4 and mt5. It has 2 parameters: 1. Starting Bar 2. Number of bars for calculation The   starting bar   is the bar which drawing of the trend lines will begin, while the   number of bars for c
FREE
Trade History Drawer
David Leander Tschacher
Trade History Drawer is an indicator for MetaTrader 4. It shows trades on the chart and draws them in customized colors. Furthermore, the indicator shows a trade summary and saves a CSV history file for either one selected pair or all pairs. Inputs General Settings Number Trades : Number of trades to be drawn on the chart, if -1 then all trades Magic Number : Only trades with this magic number, if -1 then ignore Line Style : Line Style Line Thickness : Line Thickness Arrow Size : Arrow Size
The indicator detects and displays Shark harmonic pattern (see the screenshot). The pattern is plotted by the extreme values of the ZigZag indicator (included in the resources, no need to install). After detecting the pattern, the indicator notifies of that by a pop-up window, a mobile notification and an email. The indicator highlights the process of the pattern formation and not just the complete pattern. In the former case, it is displayed in the contour triangles. After the pattern is comple
Octave Fractal Channel — Dynamic Gann-Based Support/Resistance Levels with Auto-Scaling. This indicator plots a dynamic channel based on the fractal structure of price movement. Channel levels adapt to the current symbol and timeframe, making it suitable for use across various financial instruments — from currency pairs to cryptocurrencies and indices. The indicator can be used in combination with other technical tools, such as the RSI oscillator, to provide additional signal filtering. How to
Pivot Pro
Igor Semyonov
Description Pivot Pro  is a universal color indicator of the  Pivot Points  levels systems. You can select one of its three versions:  Standard   Old , Standard New  and  Fibo . The system will automatically calculate the  Pivot Point  on the basis of market data for the previous day ( PERIOD_D1 ) and the system of support and resistance levels, three in each. It can also display price tags for each level. You can color the indicator lines. Only a method of calculation of the third level of supp
Scalping indicator. Points show the price reversal places on the chart. Not redrawn. Minimum delay. Works on M1, M5, M30, H1, H4 timeframes. You can work on all currency pairs. The indicator can also work on gold, silver and cryptocurrencies. This indicator can also be used for binary options. How to trade (an example of a strategy for GBPUSD)? When a blue dot appears, buy. When a red dot appears, sell. TakeProfit set to 25 points. StopLoss set 35 points. TrelingStop is set at 15 pips. Benefit
Rainbow MT4
Jamal El Alama
Rainbow MT4 is a technical indicator based on Moving average with period 34 and very easy to use. When price crosses above MA and MA changes color to green, it’s a signal to buy. When price crosses below MA and MA changes color to red, it’s a signal to sell. The Expert advisor ( Rainbow EA MT4) based on Rainbow MT4 indicator, as you can see in the short video below is now available here .
FREE
Les acheteurs de ce produit ont également acheté
Gann Made Easy
Oleg Rodin
4.83 (151)
Gann Made Easy est un système de trading Forex professionnel et facile à utiliser qui est basé sur les meilleurs principes de trading en utilisant la théorie de mr. WD Gann. L'indicateur fournit des signaux d'ACHAT et de VENTE précis, y compris les niveaux Stop Loss et Take Profit. Vous pouvez échanger même en déplacement en utilisant les notifications PUSH. VEUILLEZ ME CONTACTER APRÈS L'ACHAT POUR OBTENIR DES CONSEILS DE TRADING, DES BONUS ET L'ASSISTANT EA GANN MADE EASY GRATUITEMENT! Vous ave
Smc Blast Signal
Mohit Dhariwal
5 (3)
NEW YEAR 2026 SALE OFFER PRICE AT JUST 99 DOLLARS FEW COPIES ONLY AT This price From 10th Jan -25th Jan MIDNIGHT Final offer GRAB YOUR COPY ON THIS New Year EVE Prices will be increased to 150 after the offer period ends Full Fledged EA and Alert plus for alerts will also be provided in this offer along with the purchase of Indicator. Limited copies only at this price and Ea too. Grab your copy soon Alert plus for indicator with set file is kept in comment section with the image  SMC Blast Signa
Scalper Inside PRO
Alexey Minkov
4.74 (69)
An exclusive indicator that utilizes an innovative algorithm to swiftly and accurately determine the market trend. The indicator automatically calculates opening, closing, and profit levels, providing detailed trading statistics. With these features, you can choose the most appropriate trading instrument for the current market conditions. Additionally, you can easily integrate your own arrow indicators into Scalper Inside Pro to quickly evaluate their statistics and profitability. Scalper Inside
M1 Sniper
Oleg Rodin
4.89 (18)
M1 SNIPER est un système d'indicateurs de trading facile à utiliser. Il s'agit d'un indicateur à flèche conçu pour l'unité de temps M1. Cet indicateur peut être utilisé seul pour le scalping sur l'unité de temps M1 ou intégré à votre système de trading existant. Bien que conçu spécifiquement pour le trading sur l'unité de temps M1, ce système peut également être utilisé avec d'autres unités de temps. Initialement, j'avais conçu cette méthode pour le trading du XAUUSD et du BTCUSD. Cependant, je
Game Changer Indicator
Vasiliy Strukov
4.47 (15)
Game Changer est un indicateur de tendance révolutionnaire, conçu pour être utilisé sur tout instrument financier et transformer votre MetaTrader en un puissant analyseur de tendances. L'indicateur ne se redessine pas et est sans latence. Il fonctionne sur n'importe quelle unité de temps et facilite l'identification des tendances, signale les retournements potentiels, agit comme un stop suiveur et fournit des alertes en temps réel pour une réaction rapide du marché. Que vous soyez un trader expé
Actuellement 20% de réduction ! La meilleure solution pour tout débutant ou trader expert ! Ce logiciel de tableau de bord fonctionne sur 28 paires de devises. Il est basé sur 2 de nos principaux indicateurs (Advanced Currency Strength 28 et Advanced Currency Impulse). Il donne un excellent aperçu de l'ensemble du marché Forex. Il montre les valeurs de l'Advanced Currency Strength, la vitesse de mouvement des devises et les signaux pour 28 paires de devises dans tous les (9) délais. Imaginez
Apollo SR Master est un indicateur de support/résistance doté de fonctionnalités spéciales qui simplifient et fiabilisent le trading basé sur les zones de support/résistance. Cet indicateur calcule ces zones en temps réel, sans aucun décalage, en détectant les sommets et les creux locaux des prix. Pour confirmer la nouvelle zone de support/résistance, il affiche un signal spécifique indiquant que cette zone peut être prise en compte et utilisée comme un véritable signal d'achat ou de vente. Dans
Gold Signal Pro
Mohamed Hassan
5 (1)
First 25 copies at $80, after that price becomes $149 (4 copies left) Gold Signal Pro is a powerful MT4 indicator designed to help traders spot strong price reactions in the market. It focuses on clear wick rejections , showing when price strongly rejects a level and often continues in the same direction. Gold Signal Pro is mainly built for scalping gold (XAUUSD) and works best on lower timeframes like M5 and M15 , where timing matters most. That said, it can also be used on any forex pair, a
GOLD Impulse with Alert
Bernhard Schweigert
4.64 (11)
Cet indicateur est une super combinaison de nos 2 produits Advanced Currency IMPULSE with ALERT  +   Currency Strength Exotics . Il fonctionne pour tous les cadres temporels et montre graphiquement l'impulsion de force ou de faiblesse pour les 8 principales devises plus un symbole ! Cet indicateur est spécialisé pour montrer l'accélération de la force des devises pour tout symbole comme l'or, les paires exotiques, les matières premières, les indices ou les contrats à terme. C'est le premier
Trend indicator AI
Ramil Minniakhmetov
4.9 (77)
L'indicateur Trend Ai est un excellent outil qui améliorera l'analyse du marché d'un trader en combinant l'identification des tendances avec des points d'entrée exploitables et des alertes d'inversion. Cet indicateur permet aux utilisateurs de naviguer dans les complexités du marché forex avec confiance et précision Au-delà des signaux primaires, l'indicateur Trend Ai identifie les points d'entrée secondaires qui surviennent lors des retraits ou des retracements, permettant aux traders de capit
Dynamic Forex28 Navigator
Bernhard Schweigert
4.43 (7)
Dynamic Forex28 Navigator - L'outil de trading Forex de nouvelle génération. ACTUELLEMENT 49 % DE RÉDUCTION. Dynamic Forex28 Navigator est l'évolution de nos indicateurs populaires de longue date, combinant la puissance de trois en un : Advanced Currency Strength28 Indicator (695 avis) + Advanced Currency IMPULSE avec ALERT (520 avis) + CS28 Combo Signals (Bonus). Détails sur l'indicateur https://www.mql5.com/en/blogs/post/758844 Qu'offre l'indicateur de force de nouvelle génération ? Tout
Volatility Trend System - un système de trading qui donne des signaux pour les entrées. Le système de volatilité donne des signaux linéaires et ponctuels dans le sens de la tendance, ainsi que des signaux pour en sortir, sans redessiner ni retarder. L'indicateur de tendance surveille la direction de la tendance à moyen terme, montre la direction et son changement. L'indicateur de signal est basé sur les changements de volatilité et montre les entrées sur le marché. L'indicateur est équipé de pl
Indicateur Miraculous – Outil Forex et Binaire 100% Non-Repaint Basé sur le Carré de Neuf de Gann Cette vidéo présente l' Indicateur Miraculous , un outil de trading très précis et puissant, spécifiquement développé pour les traders du Forex et des Options Binaires . Ce qui rend cet indicateur unique est sa fondation sur le légendaire Carré de Neuf de Gann et la Loi de Vibration de Gann , en faisant l'un des outils de prévision les plus précis disponibles dans le trading moderne. L'Indicateur Mi
Atomic Analyst
Issam Kassas
5 (3)
Tout d'abord, il convient de souligner que cet indicateur de trading n'est ni repainting, ni redrawing et ne présente aucun délai, ce qui le rend idéal à la fois pour le trading manuel et automatisé. Manuel de l'utilisateur : réglages, entrées et stratégie. L'Analyste Atomique est un indicateur d'action sur les prix PA qui utilise la force et le momentum du prix pour trouver un meilleur avantage sur le marché. Équipé de filtres avancés qui aident à éliminer les bruits et les faux signaux, et à
Trend Screener
STE S.S.COMPANY
4.79 (95)
Indicateur de tendance, solution unique révolutionnaire pour le trading et le filtrage des tendances avec toutes les fonctionnalités de tendance importantes intégrées dans un seul outil ! Il s'agit d'un indicateur multi-période et multi-devises 100 % non repeint qui peut être utilisé sur tous les symboles/instruments : forex, matières premières, crypto-monnaies, indices et actions. OFFRE À DURÉE LIMITÉE : L'indicateur Support and Resistance Screener est disponible pour seulement 50 $ et à vie. (
ZeusArrow Smart Liquidity Finder  Smart Liquidity Finder is Ai controlled indicator based on the Idea of Your SL is My Entry. It scan and draws the major Liquidity areas on chart partitioning them with Premium and Discount Zone and allows you find the best possible trading setups and help you decide the perfect entry price to avoid getting your Stop Loss hunted . Now no more confusion about when to enter and where to enter. Benefit from this one of it's kind trading tool powered by Ai an trade
Algo Pumping MT4
Ihor Otkydach
4.69 (16)
PUMPING STATION – Votre stratégie personnelle «tout compris» Nous vous présentons PUMPING STATION – un indicateur Forex révolutionnaire qui transformera votre façon de trader en une expérience à la fois efficace et passionnante. Ce n’est pas seulement un assistant, mais un véritable système de trading complet, doté d’algorithmes puissants pour vous aider à trader de manière plus stable. En achetant ce produit, vous recevez GRATUITEMENT : Fichiers de configuration exclusifs : pour un réglage auto
Trend Lines PRO
Roman Podpora
5 (1)
TREND LINES PRO     Cet indicateur permet de comprendre les véritables changements de direction du marché. Il révèle les renversements de tendance et les points de retour des principaux acteurs. Tu vois     Lignes BOS     Détection des changements de tendance et des niveaux clés sur des unités de temps supérieures, sans paramètres complexes ni interférences inutiles. Les signaux restent affichés sur le graphique même après la fermeture de la bougie. Ce que l'indicateur montre : De véritables ch
Si vous achetez cet indicateur, vous recevrez mon Gestionnaire de Trading Professionnel   + EA  GRATUITEMENT. Tout d'abord, il convient de souligner que ce système de trading est un indicateur non repeint, non redessiné et non retardé, ce qui le rend idéal pour le trading manuel et automatisé. Cours en ligne, manuel et téléchargement de préréglages. Le "Système de Trading Smart Trend MT5" est une solution de trading complète conçue pour les traders débutants et expérimentés. Il combine plus de
PZ Day Trading
PZ TRADING SLU
3.67 (3)
Effortless trading: non-repainting indicator for accurate price reversals This indicator detects price reversals in a zig-zag fashion, using only price action analysis and a donchian channel. It has been specifically designed for short-term trading, without repainting or backpainting at all. It is a fantastic tool for shrewd traders aiming to increase the timing of their operations. [ Installation Guide | Update Guide | Troubleshooting | FAQ | All Products ] Amazingly easy to trade It provides
ACTUELLEMENT 20% DE RÉDUCTION ! La meilleure solution pour tout débutant ou trader expert ! Cet indicateur est un outil de trading abordable car nous avons incorporé un certain nombre de caractéristiques exclusives ainsi qu'une nouvelle formule. L'Indicateur Avancé de Volume Accumulé de Devises est spécialisé pour les 28 principales paires Forex et fonctionne sur tous les cadres temporels. Il s'agit d'une nouvelle formule qui, sur un seul graphique, extrait tout le volume des devises (C-Volu
Version MT5 disponible ici : https://www.mql5.com/en/market/product/50538 Canal et groupe Telegram : https://t.me/bluedigitsfx Accès au groupe VIP : Envoyez la preuve de paiement à notre boîte de réception Courtier recommandé : https://bit.ly/BlueDigitsFxStarTrader BlueDigitsFx OBV Divergence — Indicateur MT4 puissant pour détecter les divergences OBV et prédire les retournements de marché L’indicateur BlueDigitsFx OBV Divergence analyse le prix et le volume On-Balance (OBV) afin d’identifi
M1 Arrow
Oleg Rodin
5 (20)
Une stratégie intraday basée sur deux principes fondamentaux du marché. L'algorithme est basé sur l'analyse des volumes et des vagues de prix à l'aide de filtres supplémentaires. L'algorithme intelligent de l'indicateur ne donne un signal que lorsque deux facteurs de marché se combinent en un seul. L'indicateur calcule les vagues d'une certaine plage sur le graphique M1 en utilisant les données de la période la plus élevée. Et pour confirmer la vague, l'indicateur utilise une analyse en volume.
Découvrez l'Indicateur d'Avion F-16, un outil de pointe pour MT4 conçu pour révolutionner votre expérience de trading. Inspiré par la vitesse et la précision inégalées de l'avion de chasse F-16, cet indicateur combine des algorithmes avancés et une technologie de pointe pour offrir des performances inégalées sur les marchés financiers. Avec l'Indicateur d'Avion F-16, vous surplomberez la concurrence car il fournit une analyse en temps réel et génère des signaux de trading hautement précis. Ses f
FX Volume
Daniel Stein
4.63 (38)
FX Volume : Découvrez le Sentiment du Marché tel que perçu par un Courtier Présentation Rapide Vous souhaitez faire passer votre approche de trading au niveau supérieur ? FX Volume vous fournit, en temps réel, des informations sur la manière dont les traders particuliers et les courtiers sont positionnés—bien avant la publication de rapports retardés comme le COT. Que vous visiez des gains réguliers ou recherchiez simplement un avantage plus solide sur les marchés, FX Volume vous aide à repére
Version MT5 disponible ici : https://www.mql5.com/en/market/product/50048 Chaîne et groupe Telegram : https://t.me/bluedigitsfx Accès au groupe V.I.P : Envoyez une preuve de paiement de l’un de nos produits payants en message privé Courtier recommandé : https://bit.ly/BlueDigitsFxStarTrader BlueDigitsFx Easy 123 System — Indicateur puissant pour détecter les retournements et les cassures sur MT4 Système tout-en-un non repaint pour repérer facilement les changements de structure du marché, l
Horizont
Ivan Stefanov
Horizont est un système de trading qui fournit une configuration de trade complète : point d’entrée, objectif 1, objectif 2 et stop loss, le tout calculé automatiquement. Le système identifie automatiquement les sommets et les creux du marché et les relie afin de définir la tendance actuelle. Vous choisissez la tendance à trader et Horizont génère les niveaux correspondants d’entrée, d’objectifs et de stop. Le système intègre une gestion automatique du risque. Il vérifie le solde de votre compte
Matrix Arrow Indicator MT4
Juvenille Emperor Limited
5 (3)
Matrix Arrow Indicator MT4 est une tendance unique 10 en 1 suivant un indicateur multi-période 100% non repeint qui peut être utilisé sur tous les symboles/instruments: forex, matières premières, crypto-monnaies, indices, actions.  Matrix Arrow Indicator MT4 déterminera la tendance actuelle à ses débuts, en rassemblant des informations et des données à partir d'un maximum de 10 indicateurs standard, qui sont: Indice de mouvement directionnel moyen (ADX) Indice de canal de matières premières (CC
SMC Easy Signal
Mohamed Hassan
4.73 (15)
SMC Easy Signal was built to remove the confusion around the smart money concept by turning structural shifts like BOS (Break of Structure) and CHoCH (Change of Character) into simple buy and sell trading signals. It simplifies market structure trading by automatically identifying breakouts and reversals as they happen, allowing traders to focus on execution rather than analysis. Whether the market is continuing its trend or preparing to reverse, the indicator translates complex price action in
System Trend Pro
Aleksandr Makarov
5 (2)
System Trend Pro - This is the best trend trading indicator!!! The indicator no repaint!!!  The indicator has   MTF   mode, which adds confidence to trading on the trend (   no repaint   ). How to trade? Everything is very simple, we wait for the first signal (big arrow), then wait for the second signal (small arrow) and enter the market in the direction of the arrow. (See screens 1 and 2.) Exit on the opposite signal or take 20-30 pips, close half of it, and keep the rest until the opposite
Plus de l'auteur
ACB Breakout Arrows MT5
KEENBASE SOFTWARE SOLUTIONS
5 (1)
L’indicateur ACB Breakout Arrows fournit un signal d’entrée crucial sur le marché en détectant un modèle de rupture spécifique. Il analyse en continu le graphique à la recherche d’un momentum établi dans une direction et déclenche un signal précis juste avant le mouvement principal. Obtenez le scanner multi-actifs et multi-unités de temps ici - Scanner pour ACB Breakout Arrows MT5 Fonctionnalités principales Les niveaux de Stop Loss et Take Profit sont fournis par l’indicateur. Inclut un table
KT Momentum Arrows MT5
KEENBASE SOFTWARE SOLUTIONS
5 (2)
L’indicateur KT Momentum Arrows est basé sur une rupture momentanée, calculée à partir de l’écart des bandes et de la volatilité émergente dans une direction spécifique. Un signal d’achat est généré lorsque le prix clôture au-dessus de la bande supérieure, et un signal de vente lorsque le prix clôture en dessous de la bande inférieure. Un coefficient de magnitude est utilisé en paramètre d’entrée, influençant à la fois l’écart des bandes et la volatilité. Sa valeur doit être choisie avec soin se
KT CCI Divergence MT5
KEENBASE SOFTWARE SOLUTIONS
KT CCI Divergence shows the regular and hidden divergence created between the price and CCI oscillator. Divergence is one of the vital signals that depicts the upcoming price reversal in the market. Manually spotting the divergence between price and CCI can be a hectic and ambiguous task. Limitations of KT CCI Divergence   Using the CCI divergence as a standalone entry signal can be risky. Every divergence can't be interpreted as a strong reversal signal. For better results, try to combine it w
ACB Breakout Arrows
KEENBASE SOFTWARE SOLUTIONS
4.15 (34)
L'indicateur ACB Breakout Arrows fournit un signal d'entrée clé sur le marché en détectant un modèle de rupture spécifique. Il analyse en continu le graphique à la recherche d'une dynamique qui s'installe dans une direction et affiche un signal précis juste avant un mouvement majeur.  Obtenez le scanner multi-symboles et multi-timeframes ici : Scanner pour ACB Breakout Arrows MT4 Fonctionnalités principales Les niveaux de Stop Loss et Take Profit sont fournis automatiquement par l’indicateur. P
KT Stoch Divergence MT5
KEENBASE SOFTWARE SOLUTIONS
La divergence est l’un des signaux les plus importants permettant d’anticiper un retournement de tendance sur le marché. KT Stoch Divergence détecte les divergences régulières et cachées entre le prix et l’oscillateur stochastique. Limitations de KT Stoch Divergence Utiliser les divergences stochastiques comme unique signal d'entrée peut être risqué. Toutes les divergences ne conduisent pas à une forte inversion. Pour de meilleurs résultats, combinez-les avec l'action des prix et la direction d
KT Psar Arrows MT5
KEENBASE SOFTWARE SOLUTIONS
5 (1)
KT Psar Arrows trace des flèches sur le graphique en utilisant l'indicateur standard Parabolic SAR. Une flèche haussière est tracée lorsque le plus haut de la bougie touche le SAR. Une flèche baissière est tracée lorsque le plus bas de la bougie touche le SAR. Les signaux sont générés en temps réel sans attendre la clôture de la bougie.  Fonctionnalités Un outil utile pour les traders souhaitant expérimenter des stratégies de trading intégrant l'indicateur Parabolic SAR.  Peut être utilisé pour
MACD Divergence on MT5
KEENBASE SOFTWARE SOLUTIONS
KT MACD Divergence affiche les divergences régulières et cachées qui se forment entre le prix et l’oscillateur. Si votre stratégie de trading anticipe un retournement de tendance, vous pouvez utiliser la divergence MACD régulière pour repérer les points de retournement potentiels. Et si votre stratégie repose sur la continuité de la tendance, la divergence cachée du MACD sera plus appropriée. Limites de KT MACD Divergence Utiliser la divergence MACD comme unique signal d’entrée peut être risqu
KT Trend Magic
KEENBASE SOFTWARE SOLUTIONS
KT Trend Magic shows the trend depiction on chart using the combination of market momentum and volatility. A smoothing coefficient is used to smooth out the noise from the signal.It can be used to find out the new entries or confirm the trades produced by other EA/Indicators. Usage Drag n drop MTF scanner which scans for the new signals across multiple time-frames. Find new entries in the trend direction. Improve the accuracy of other indicators when used in conjunction. Can be used as a dynami
ACB Trade Filter MT4
KEENBASE SOFTWARE SOLUTIONS
5 (1)
The ACB Trade Filter indicator provides a solution for filtering out the low probability trading setups in a trading strategy. The indicator uses a sophisticated filtration algorithm based on the market sentiment and trend. Applications Works great with our indicator " ACB Breakout Arrows ". Filter out low probability signals from any indicator. Avoid overtrading and minimize the losses. Trade in the direction of market sentiment and trend. Avoid the choppiness in the market. How to use Only L
KT Momentum Arrows
KEENBASE SOFTWARE SOLUTIONS
L’indicateur KT Momentum Arrows est basé sur une rupture momentanée, calculée à partir de l’écart des bandes et de la volatilité émergente dans une direction spécifique. Un signal d’achat est généré lorsque le prix clôture au-dessus de la bande supérieure, et un signal de vente lorsque le prix clôture en dessous de la bande inférieure. Un coefficient de magnitude est utilisé en paramètre d’entrée, influençant à la fois l’écart des bandes et la volatilité. Sa valeur doit être choisie avec soin se
KT COG Advanced MT4
KEENBASE SOFTWARE SOLUTIONS
1 (1)
KT COG is an advanced implementation of the center of gravity indicator presented by John F. Ehlers in the May 2002 edition of Technical Analysis of Stocks & Commodities magazine. It's a leading indicator which can be used to identify the potential reversal points with the minimum lag. The COG oscillator catches the price swings quite effectively. MT5 version of the same indicator is available here KT COG Advanced MT5 Calculation of COG The COG indicator is consist of the two lines. The main l
KT Pin Bar
KEENBASE SOFTWARE SOLUTIONS
KT Pin Bar identifies the pin bar formation which is a type of price action pattern which depicts a sign of reversal or rejection of the trend. When combined with support and resistance, BRN and other significant levels, Pin Bar pattern proved to be a very strong sign of reversal. Basically, a pin bar is characterized by a small body relative to the bar length which is closed either in upper or lower 50% part of its length. They have very large wicks and small candle body. A pin bar candlestic
KT Auto Fibo
KEENBASE SOFTWARE SOLUTIONS
KT Auto Fibo trace automatiquement les niveaux de retracement de Fibonacci en fonction de la direction actuelle de la tendance. Les points hauts et bas sont sélectionnés automatiquement en utilisant les points maximum et minimum disponibles sur le graphique. Vous pouvez zoomer, dézoomer et faire défiler pour ajuster les niveaux de Fibonacci en conséquence. Modes Automatique :  Trace automatiquement les niveaux de Fibonacci en fonction de la zone visible du graphique. Manuel : Trace les niveaux
KT Psar Arrows
KEENBASE SOFTWARE SOLUTIONS
KT Psar Arrows trace des flèches sur le graphique en utilisant l'indicateur standard Parabolic SAR. Une flèche haussière est tracée lorsque le plus haut de la bougie touche le SAR. Une flèche baissière est tracée lorsque le plus bas de la bougie touche le SAR. Les signaux sont générés en temps réel sans attendre la clôture de la bougie.  Fonctionnalités Un outil utile pour les traders souhaitant expérimenter des stratégies de trading intégrant l'indicateur Parabolic SAR.  Peut être utilisé pour
KT Ichimoku Trader
KEENBASE SOFTWARE SOLUTIONS
1 (1)
KT Ichimoku Trader is a fully automated expert advisor that offers five popular trading strategies based on the Ichimoku indicator. Each strategy has it's own entry and exit method without any interference to other strategies. The Ichimoku system can be applied to all major currency pairs and metals. However, we found that it performs reasonably well mainly on two pairs.   MT5 Version is available here  https://www.mql5.com/en/market/product/35043 Features Trade up to 5 famous trading strategi
KT Volatility Oscillator
KEENBASE SOFTWARE SOLUTIONS
L'oscillateur de volatilité KT analyse les données de marché passées et actuelles à l'aide d'une formule mathématique pour afficher le résultat sous forme d'oscillateur. Les vagues croissantes et décroissantes correspondent respectivement à une volatilité élevée et faible de l'actif.  En résumé, la volatilité est simplement une mesure des fluctuations du prix d'un actif sur une certaine période de temps. Sans volatilité, il y aurait peu de mouvement sur le marché et les traders ne pourraient pas
KT COG Robot
KEENBASE SOFTWARE SOLUTIONS
KT COG Robot is a fully automated Expert Advisor based on the KT COG Indicator . The COG indicator was originally presented by John F. Ehlers in the May 2002 edition of Technical Analysis of Stocks & Commodities magazine. The EA fires a long trade when COG line cross above the signal line and a short trade is fired when the COG line cross below the signal line.  Adaptive Filtration Our adaptive filtration algorithm combines the original COG formula with the major trend direction and market acce
ACB Breakout Arrows EA
KEENBASE SOFTWARE SOLUTIONS
Il s'agit d'un Expert Advisor 100 % automatisé basé sur notre indicateur personnalisé nommé "ACB Breakout Arrows" . Les entrées sont fondées sur un schéma de cassure qui se produit fréquemment dans les deux sens. L'intensité des signaux d'entrée peut être ajustée à l'aide du paramètre externe "Signal Sensitivity". Confirmation des trades L'EA ACB Breakout Arrows permet de filtrer les signaux d'entrée en utilisant un autre de nos indicateurs personnalisés nommé ACB Trade Filter . Forte position
KT Asian Breakout
KEENBASE SOFTWARE SOLUTIONS
4 (1)
KT Asian Breakout carefully analyzes the range-bound market during the Asian session and then fires a long or short trade after doing some preassessment based on its inbuilt technical analysis module. The executed orders are closed within a day before the completion of the next day session. The inbuilt technical analysis module checks for the session range and compares it with the last 20 days price movement. If it finds any erratic price movement within the session, the orders are not executed
KT London Breakout
KEENBASE SOFTWARE SOLUTIONS
First thirty minutes are essential for a trading session. The early reaction of traders and market players sets a path for the rest of the day. KT London Breakout EA takes advantage of this phenomenon, and after analyzing the first thirty minutes of London session, it places two bidirectional pending orders. One of pending order is eventually canceled after realizing the market direction with certainty. It has been strictly tested and developed for EUR/JPY using 30-Min Time Frame. You can expe
Use of support and resistance in systematic trading is very subjective. Every trader has their own idea and way to plotting the support and resistance levels on the chart. KT Support and Resistance indicator take out this ambiguity out of the situation and automatically draws support and resistance levels following an algorithmic approach using a unique multi-timeframe analysis. When launched on the chart, It immediately scan the most significant extreme points across all the available timefra
Si vous tradez sur le marché du Forex, disposer d'informations détaillées sur la force des devises et la corrélation entre les paires de devises peut élever votre trading à un niveau supérieur. La corrélation vous aidera à réduire votre risque de moitié, tandis que l'analyse de la force maximisera vos profits. Cet indicateur propose une approche hybride pour sélectionner les paires de devises les plus appropriées en combinant l'analyse de la force des devises et la corrélation des paires. Comme
MACD Divergence Seeker
KEENBASE SOFTWARE SOLUTIONS
KT MACD Divergence Seeker trades the regular and hidden divergence signals generated by our free indicator named KT MACD Divergence indicator. Trading the standalone divergences can be a risky affair that's why the KT MACD Divergence Seeker combines the standard divergence signals with an advanced analysis module to exploit the price inefficiencies on some FX pairs. What is the Divergence exactly? As a general conception if the price is making higher highs, then macd should also be making hig
KT Asian Breakout Indicator
KEENBASE SOFTWARE SOLUTIONS
L'indicateur KT Asian Breakout analyse une partie clé de la session asiatique afin de générer des signaux d'achat et de vente dans les deux directions en fonction de la cassure du prix. Un signal d'achat est déclenché lorsque le prix dépasse le plus haut de la session, tandis qu'un signal de vente est déclenché lorsque le prix casse le plus bas de la session. Points importants à retenir Si la boîte de session est trop large verticalement, il est préférable d’éviter une nouvelle entrée, car la m
MACD Divergence MT4
KEENBASE SOFTWARE SOLUTIONS
KT MACD Divergence affiche les divergences régulières et cachées qui se forment entre le prix et l’oscillateur. Si votre stratégie de trading anticipe un retournement de tendance, vous pouvez utiliser la divergence MACD régulière pour repérer les points de retournement potentiels. Et si votre stratégie repose sur la continuité de la tendance, la divergence cachée du MACD sera plus appropriée. Limites de KT MACD Divergence Utiliser la divergence MACD comme unique signal d’entrée peut être risqu
KT Bollinger Bands Trader MT4
KEENBASE SOFTWARE SOLUTIONS
KT Bollinger Bands Trader est un Expert Advisor 100 % automatisé qui applique une stratégie de retour à la moyenne basée sur les bandes de Bollinger pendant les périodes de faible volatilité. Le prix réagit souvent sur la ligne supérieure ou inférieure des bandes, mais un retournement ne se produit pas systématiquement. Cependant, la probabilité d’un retournement est plus élevée lorsque la volatilité est faible. Entrées Un achat est déclenché lorsque le prix se positionne correctement sous la b
KT CCI Divergence MT4
KEENBASE SOFTWARE SOLUTIONS
KT CCI Divergence shows the regular and hidden divergence created between the price and CCI oscillator. Divergence is one of the vital signals that depicts the upcoming price reversal in the market. Manually spotting the divergence between price and CCI can be a hectic and ambiguous task. Limitations of KT CCI Divergence   Using the CCI divergence as a standalone entry signal can be risky. Every divergence can't be interpreted as a strong reversal signal. For better results, try to combine it w
KT Heiken Ashi Smoothed MT4
KEENBASE SOFTWARE SOLUTIONS
KT Heiken Ashi Smoothed est une version lissée du Heiken Ashi classique ; il trace également des flèches d’achat/vente lors d’un changement de tendance. Une flèche d’achat apparaît quand l’état passe de baissier à haussier. Une flèche de vente apparaît quand l’état passe de haussier à baissier. Alertes mobiles, email, sonores et fenêtres pop-up incluses. Qu’est-ce que le Heiken Ashi Smoothed ? Il élimine les faux signaux et le bruit du Heiken Ashi standard en appliquant deux moyennes mobiles p
KT MA Crossover MT4
KEENBASE SOFTWARE SOLUTIONS
KT MA Crossover affiche des flèches d'achat et de vente en fonction du croisement des moyennes mobiles sélectionnées. Il génère également les alertes appropriées et affiche la valeur MFE (Excursion la plus favorable) pour chaque signal successif. La stratégie de croisement des moyennes mobiles est l'une des techniques les plus utilisées par les traders dans le monde entier. Elle repose généralement sur une moyenne mobile rapide et une moyenne mobile lente pour détecter les signaux d'achat et de
KT Round Numbers MT4
KEENBASE SOFTWARE SOLUTIONS
KT Round Numbers plots the round number levels which are also commonly known as psychological levels in the Forex world. In the context of Forex trading, round number levels are those levels in which there are two or more zeroes at the end. They are named as 00 levels on the chart. Some traders also consider the halfway points as a valid round number level. They are named as 50 levels on the chart. Use of round number levels in trading Round number levels work as strong support and resistance
Filtrer:
Aucun avis
Répondre à l'avis