Full Trend Killer

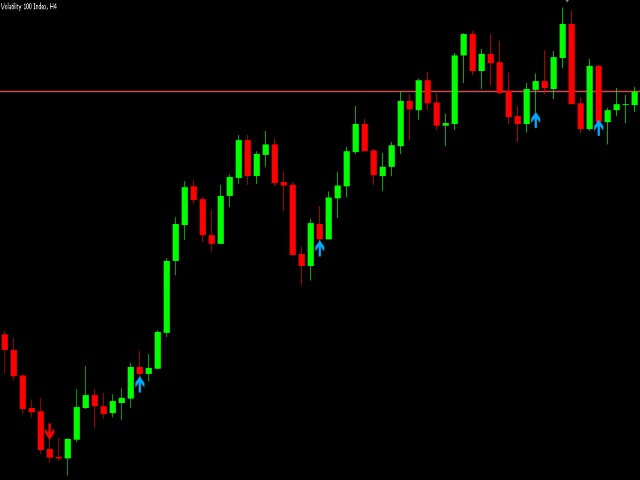
FULL TREND KILLER is an indicator based on Bollingen Bands and it is easy to use; no internal adjustments to be made.
It is specially designed for synthetic indices but also works well on Forex Assets.
The best time frame to use on synthetic indices is M15, this is just a tip, however it can be used on all time frames.

Settings :

BANDS PERIOD

Push Notification
Email Notification
Audible Alert


おすすめのプロダクト
Viking Strategy Indicator – The Beating Heart of the BT 3.0 System The Viking Strategy Indicator is not just another indicator… It’s one of the pillars of the revolutionary BT 3.0 trading system , built to transform the trading experience for everyone — from beginners to experts . BT 3.0 is much more than a tool: It’s a complete trading solution , both semi-automated and fully automated , integrating 6 powerful indicators and a smart assistant that analyzes, detects, alerts, and executes b
VarMomentPulse is a unique manual trading algorithm developed with precision and flexibility in mind, based on an extensive historical data cluster.  Its operation is grounded in the principles of analyzing crossovers between normalized moving averages and dispersions across various time intervals, enabling it to uncover new opportunities in evaluating market trends. Key Features of the VarMomentPulse Indicator: Adaptability to Volatility:The use of price dispersion analysis allows VarMomentPul
This indicator is a scalping indicator intended solely for the Boom and Crash indices of the Deriv Limited market It supports Boom 500, Boom 1000, Crash 500 and Crash 1000 Not repaint and no bug The settings are intuitive and easy to use The product activation number is 20 The Time Frame used depends on the user If you are an aggressive scalper then just use M1 For long trades use M15 If you are conservative use M5 Please contact me for more details of its use
RED ZONE Monitor Loss-Cut & Break-Even Risk Monitor for Averaging Traders (MT5) RED ZONE Monitor is a risk management indicator for traders who use averaging, scaling-in, or multiple open positions . It visually displays: The loss-cut (liquidation) risk zone The break-even price Based on current open positions, lots, and margin conditions This indicator does not provide entry signals. It does not promise profits. It shows where your account actually fails if price moves against you. What RED ZO
Advanced Trading Chaos  The main purpose of the indicator is to help the trader detect the signals described by Bill Williams in his books to make a quick and correct trading decision. 1)Bullish/Bearish Reversal Bar(BDB) 2) Divergent Bar(DB) 3) Second Sage Signal — the third consecutive Awesome Oscillator bar  4) Working fractals (Fractals that worked above/below the red forehead  5) Three bar coloring modes 5.1) Coloring of bars according to the AO indicator (Including the squatting bar) 5.2
Check out my TRADE PLANNER MT5 – strongly recommended to anticipate account scenarios before risking any money. This is a multi-symbol, multi-timeframe, table-based indicator for MetaTrader 5 that identifies 46 types of candlestick formations. Each formation has its own image for easier recognition. The indicator includes popular patterns such as Engulfing, Hammer, Three Line Strike, Piercing, and Doji-like candles. You can check the full list of patterns in the screenshots below. Also you can
Mega Spikes Max is a specialized indicator for Boom and Crash synthetic indices that generates trading signals with automatic alert notifications. Features The indicator analyzes market conditions using proprietary algorithms and displays buy/sell arrows directly on the chart. It works specifically with Boom and Crash indices on M5 timeframe. Signal generation combines multiple technical analysis methods to identify potential trading opportunities. The system provides two TP levels and SL calcu
MT5 Session Indicator: Track Global Market Hours with Precision Boost your trading strategy with this FREE Session Indicator for MetaTrader 5 , designed to help you effortlessly identify active trading sessions across global markets. Perfect for forex, stocks, and commodities traders, this tool highlights key market hours (Asian, European, North American, and overlaps) directly on your chart, ensuring you never miss high-liquidity periods. Key Features: Visual Session Overlays : Clear color-c
FREE
RSI Dashboard PRO is a multi-symbol, multi-timeframe RSI monitoring indicator designed to help traders analyze Relative Strength Index values efficiently within a single panel. The indicator displays real-time RSI readings for selected symbols and timeframes, using a clear color scheme to highlight overbought, oversold, and neutral conditions. This allows users to quickly compare market states and identify areas of interest without switching charts. RSI Dashboard PRO includes interactive contro
SlopeChannelB – 価格の傾斜チャネルを構築するテクニカル分析ツールで、市場の現状を評価し、取引シグナルを見つけるためのユニークな機会を提供します。 インジケーターの主な特徴: 価格の傾斜チャネル : このインジケーターは、サポートとレジスタンスのレベルを視覚化するのに役立ち、トレンドの逆転または継続の可能性を示すことができます。 ラインの色と背景の強調表示が異なる : 傾斜したサポートとレジスタンスのレベルは異なる色で表示され、チャネル自体はさらに背景で強調され、チャートの視覚的分析を簡素化します。 ライン計算のための3つのオプション : このインジケーターは回帰分析を使用してチャネルラインを構築します。3つの方法から選択できます: Robust(デフォルト) – 外れ値に強い方法。 OLS(最小二乗法) . Median(中央値計算) . 最適なモデル選択 : SlopeChannelBは5つの品質基準の分析に基づいて最も適切なチャネルラインのバリエーションを自動的に選択します。 品質パラメータはチャートに直接表示され、結果の評価に役立ちます。また、ボタンを使
Description : Rainbow EA MT5 is a simple Expert advisor based on   Rainbow MT5 indicator witch is based on Moving average with period 34. The indicator is incorporated in the EA, therefore, it is not required for the EA to operate, but if you wish, you can download it from   my product page . The Expert Advisor settings are as follows : Suitable for Timeframes up to H1 The parameters below can be set according to your trading rules. StopLoss ( Stop Loss in pips) TakeProfit ( Take Profit in pips
PAX3 Price Action Indicator
Marco Aurelio Santos Costa
5 (5)
You probably won't see the power of the indicator in the backtest, because it uses 3 windows, something you can't do, in the DEMO version that the site offers.  I trust 100% on my work and on my indicator, if you want a test version, send me a message, different from other sellers, who just want to "sell", I want whether you have a full version before renting and deciding. Christmas Discount 30% off until the 25th As you can imagine, it was a failure, I'm not saying that any indicator doesn't w
Sqn Max Indicator Sqn Max is an exclusive indicator to trade the market with high effectiveness. The indicator is based on price action, volatility and trend. This indicator is as simple as possible but not too simple. The indicator can generate alerts to ease the trading process. You don't have to stay all day in front of your screen. The indicator can be used with any class of assets and with any time frame. It is possible to achieve better results trading our list of selected assets. We achi
Stratos Pali Indicator is a revolutionary tool designed to enhance your trading strategy by accurately identifying market trends. This sophisticated indicator uses a unique algorithm to generate a complete histogram, which records when the trend is Long or Short. When a trend reversal occurs, an arrow appears, indicating the new direction of the trend. Important Information Revealed Leave a review and contact me via mql5 message to receive My Top 5 set files for Stratos Pali at no cost ! Down
Ultimate Boom and Crash Indicator The Ultimate Boom and Crash Indicator is a cutting-edge tool developed by  Coetsee Digital , designed to identify potential spike opportunities in the market. Crafted for traders focusing on Deriv and Weltrade synthetic markets, this indicator is optimized to operate exclusively on the 3-minute (M3), 5-minute (M5), 15-minute (M15), 30-minute (M30), and 1-hour (H1) timeframes and supports only the following pairs: PainX 1200, PainX 999, PainX 800, PainX 600, Pai
TouchGuard Alert – Advanced Price Alert & Notification Indicator for MetaTrader 5 (MT5) TouchGuard Alert is a fast, lightweight, and highly accurate price-touch Alert & Notification system designed for MetaTrader 4 (MT4) and MetaTrader 5 (MT5) . It automatically sends real-time Alerts, Pop-Up Alerts, Email Notifications, Push Notifications and early-warning notifications when price touches or approaches your chart objects. Key Features (High-Precision Alert & Notification System) Comprehensive P
Visual Vortex Indicator
AL MOOSAWI ABDULLAH JAFFER BAQER
Unleash the Power of Market Dynamics with the Vortex Indicator! The Visual Vortex Indicator is your advanced tool for decoding market trends, reversals, and momentum shifts. Priced at $65, this indicator provides a comprehensive view of market behavior, but it’s designed for you to fine-tune and optimize it according to your unique trading strategy. What Makes It Unique? The Vortex Indicator is based on a strategy that identifies directional movements and trend strength by analyzing key price d
r-Trend Sync indicator is manual trading system for extra volatility markets. Main System features : The indicators's algorithm is based on the analysis of an extensive array of historical data (from 1995 for EURUSD & EURJPY and from 2004 for XAUUSD), which ensured the identification of general patterns in the behavior of these pairs across a wide range of timeframes. The analysis of historical data helped the system learn to recognize market triggers for medium-term trends and cycles, as well a
インジケータMTFクリスタリウム矢印は、半自動取引システムであります. これは、すべての通貨ペアで動作します。  インジケータは、三つのルールを使用しています:1)我々は唯一のトレンドで取引、2)"誰もが販売しているときに購入し、誰もが買うときに販売する"、3)価格  インジケータMTF矢印は、内蔵の指標を使用して、複数の時間枠全体のクリスタリウムフィルタルール。 トレンドは、選択した時間間隔で一致した場合、インジケータは、市場に参入するための矢印を与えます。 それからあなた自身の決定をする。 購入する-緑の矢印、売る-赤い矢印。 指標では、ロットを変更したり、EAの取引時間とシャットダウン時間を設定することができます。 また、作業期間と時間フィルタを変更することができます。 ビープ音が鳴ってる  推薦された働く期間D1。 フィルタH1とH4。  設定: TF働く期間(推薦されたD1) Cci_cperiodcomment CCIレベルアップ CCIレベルDn CCI価格 SARステップ SAR最大値 TFのFilter1–(推薦されたH1) TFのFilter2
インディケータは現在のクオートを作成し、これを過去のものと比較して、これに基づいて価格変動予測を行います。インジケータには、目的の日付にすばやく移動するためのテキスト フィールドがあります。 オプション: シンボル - インジケーターが表示するシンボルの選択; SymbolPeriod - 指標がデータを取る期間の選択; IndicatorColor - インジケータの色; HorisontalShift - 指定されたバー数だけインディケータによって描画されたクオートのシフト; Inverse - true は引用符を逆にします。false - 元のビュー。 ChartVerticalShiftStep - チャートを垂直方向にシフトします (キーボードの上下矢印)。 次は日付を入力できるテキストフィールドの設定で、「Enter」を押すとすぐにジャンプできます。
Knowledge of the strength and weakness of each currency is vital for every forex trader. Our   Currency Strength Meter indicator   measures the strength of eight major currencies (USD, EUR, GBP, CHF, JPY, CAD, AUD, NZD) by using the Relative Strength Index indicator, also known as RSI. The Currency Strength Meter indicator shows you, simply and quickly, when a currency is oversold, overbought, or in "normal area". This way, you can identify which currency is the strongest and the weakest. Our
Ing (inguz,ingwar) - the 23rd rune of the elder Futhark ᛝ, Unicode+16DD. Add some runic magic to your trading strategies. The correct marking of the daily chart will indicate to you the successful moments for counter-trend trading. Simple to use, has high efficiency in volatile areas. Be careful in lateral movements. Signals ᛝ are generated when the main lines of construction intersect. Red arrow down - recommended sales Blue up arrow - recommended purchases rare purple arrows indicate exce
The OCTO Indicator is a  new and  easy to use zero-crossing trend/trend reversal indicator that provides entry signals for both long and short positions. It is based on High/Low divergence and correlation of the values over time. Reliability of the indicator has been backtested with an example trading robot. How to use The OCTO indicator is added in a separate window, showing a red and a green indicator line, as well as the zero line for crossing. You can see an example of the standard look and
Energy Gravity — User Guide Energy Gravity is a structural market analysis tool that visualizes the hidden energetic geometry of price. The indicator treats the market as a dynamic field of distributed mass, where past price interaction forms: attraction zones equilibrium areas structural tension probable return directions Core concept: Price does not move randomly — it interacts with accumulated liquidity and time. Energy Gravity shows where equilibrium is located, where liquidity is concentrat
Gold Venamax - これは最高の株式テクニカル指標です。 指標アルゴリズムは資産の価格変動を分析し、ボラティリティと潜在的なエントリーゾーンを反映します。 インジケーターの機能: これは、快適で収益性の高い取引のためのマジックとトレンド矢印の 2 つのブロックを備えたスーパー インジケーターです。 チャート上にブロックを切り替えるための赤いボタンが表示されます。 マジックはインジケーター設定で設定されているため、異なるブロックを表示する 2 つのチャートにインジケーターをインストールできます。 Gold Venamax は、異なる矢印バッファー (GV と SD) を備えた 2 つのチャートに配置できます。 これを行うには、設定で異なる Magic を選択する必要があります。たとえば、あるマジック = 999、別のマジック = 666 を選択します。次に、チャート上の赤いボタンで矢印バッファを選択できます。 インジケーター設定の各矢印バッファー (GV および SD) には、快適で収益性の高い取引のための個別の矢印フィルターがあります (UseFiltrGV = true;
The " Stochastic Advanced " indicator displays the signals of the 'Stochastic" indicator directly on the chart without the presence of the indicator itself at the bottom of the screen. The indicator signals can be displayed not only on the current timeframe, but also on a timeframe one level higher. In addition, we have implemented a filter system based on the Moving Average indicator. Manual (Be sure to read before purchasing) | Version for MT4 Advantages 1. Displaying the signals of the "Stoch
Nova AC Trader is a modern automation of the Accelerator Oscillator (AC) — a Bill Williams momentum tool designed to detect shifts in market acceleration before trends fully form. This EA transforms the indicator’s early-warning nature into a structured trading system that reacts only when momentum changes are clear and consistent. Instead of waiting for the trend to be obvious, Nova AC Trader identifies when market acceleration starts to turn — offering opportunities at the earliest stage of mo
Range Directional Force Indicator – Designed for You to Optimize! The Range Directional Force Indicator is a cutting-edge tool designed to empower traders by visualizing market dynamics and directional strength. Built to offer insights into market trends and reversals, this indicator is an invaluable asset for traders seeking precision in their strategies. However, it is important to note that this indicator is not optimized, leaving room for you to tailor it to your unique trading preferences.
STRICTLY FOR BOOM INDEX ONLY!!!!! Here I bring the Maximum Trend Arrows OT1.0 MT5 indicator. This indicator is made up of a combination of different trend indicators for entries and exits, for entries an orange arrow will paint on the chart below the current market and a red flag for closing of trades and it produces buy arrows only. When the orange arrow appears, it will appear along with it's sound to notify you. The 1H timeframe is recommended, don't use it anywhere else than on the 1H timefr
Weighted average price indicator or VWAP. The well-known standard VWAP with the beginning of the day is added with the function of selecting the periodization. It can be calculated both every day and on other periods. Also the indicator allows to exclude the volume from the calculation, which will allow using it on the cryptocurrencies and forex. There is an alert for a VWAP price crossing. There are 1 and 2 standard deviation. Settings: Volume: turning volume on and off in the calculation mecha
このプロダクトを購入した人は以下も購入しています
ARIPoint is a powerful trading companion designed to generate high-probability entry signals with dynamic TP/SL/DP levels based on volatility. Built-in performance tracking shows win/loss stats, PP1/PP2 hits, and success rates all updated live. Key Features: Buy/Sell signals with adaptive volatility bands Real-time TP/SL/DP levels based on ATR Built-in MA Filter with optional ATR/StdDev volatility Performance stats panel (Success, Profit/Loss, PP1/PP2) Alerts via popup, sound, push, or email Cu
このインジケーターは、市場で 関心が示されたゾーン をハイライトし、その後に 注文の蓄積ゾーン を表示します。 これは、大規模な**板情報(オーダーブック)**のように機能します。 これは、 巨大な資金 のためのインジケーターです。その性能は卓越しています。 市場にどんな関心が存在していても、 必ず目に見えるようになります 。 (これは 完全に再設計され、自動化されたバージョン です。もはや手動分析は必要ありません。) トランザクションスピード(取引速度) は新しい概念のインジケーターで、市場で大口注文が どこに・いつ 集中しているかを示し、それに基づいたチャンスを提供します。 トレンドの変化を 非常に早い段階 で察知することができます。 FXでは「出来高」と呼ばれているものは誤解されています。実際には、これは 時間あたりの価格変動量 です。したがって、正しい名称は トランザクションスピード です。 考え方・行動・分析の仕方すべてが問われます。 分析パラダイムの転換は非常に重要です。 このインジケーターは、FXにおける出来高の考え方を 根本から再定義 し、論理的な形で正確に活用する、
note: this indicator is for METATRADER4, if you want the version for METATRADER5 this is the link:  https://www.mql5.com/it/market/product/108106 TRENDMAESTRO ver 2.5 TRENDMAESTRO recognizes a new TREND from the start, he never makes mistakes. The certainty of identifying a new TREND is priceless. DESCRIPTION TRENDMAESTRO identifies a new TREND in the bud, this indicator examines the volatility, volumes and momentum to identify the moment in which there is an explosion of one or more of these da
「 Dynamic Scalper System MT5 」インジケーターは、トレンド波の中でスキャルピング取引を行う手法のために設計されています。 主要通貨ペアと金でテスト済みで、他の取引商品との互換性があります。 トレンドに沿った短期的なポジションオープンのシグナルを提供し、追加の価格変動サポートも提供します。 インジケーターの原理 大きな矢印はトレンドの方向を決定します。 トレンド波の中では、小さな矢印の形でスキャルピングシグナルを生成するアルゴリズムが機能します。 赤い矢印は強気方向、青い矢印は弱気方向です。 トレンドの方向には敏感な価格変動ラインが描かれ、小さな矢印のシグナルと連動します。 シグナルは次のように機能します。適切なタイミングでラインが現れるとエントリーシグナルが形成され、ラインが開いている間はポジションが保持され、完了すると取引が終了します。 推奨される動作時間枠はM1~H4です。 矢印は現在のローソク足に形成され、次のローソク足が開いている場合は、前のローソク足の矢印は再描画されません。 入力パラメータ Trend Wave Period - トレ
UZFX {SSS} スキャルピング・スマートシグナル MT5 は、変動の激しい市場で正確かつリアルタイムのシグナルを求めるスキャルパー、デイトレーダー、スイングトレーダー向けに設計された、再描画しない高性能取引指標です。(UZFX-LABS) によって開発されたこの指標は、価格行動分析、トレンド確認、スマートフィルタリングを組み合わせて、全ての通貨ペアと時間枠で高確率の売買シグナルを生成します。 主な機能 スマートシグナル検出 – 強力なトレンド反転と継続パターンを正確に識別。 マルチタイムフレーム・スキャルピング – 全タイムフレームで完璧に動作。 カスタマイズ可能なアラート – 全シグナルに対しポップアップ、メール、モバイル通知を取得(設定可能)。 明確な視覚的矢印 – チャート上で見やすい青(買い)と赤(売り)の矢印を表示。 適応型シグナル強度 – 短期・中期・長期取引向けにシグナル強度を調整可能。 ユーザーフレンドリーなインターフェース – リペインティングやシグナル遅延のないクリーンなチャート表示。 動作原理 UZFX SSSインジケーターは価格行動をスキャンし以下を検
ARICoin is a powerful trading companion designed to generate high-probability entry signals with dynamic TP/SL/DP levels based on volatility. Built-in performance tracking shows win/loss stats, PP1/PP2 hits, and success rates all updated live. Key Features: Buy/Sell signals with adaptive volatility bands Real-time TP/SL/DP levels based on ATR Built-in MA Filter with optional ATR/StdDev volatility Performance stats panel (Success, Profit/Loss, PP1/PP2) Alerts via popup, sound, push, or email Cust
ARIScalp is a powerful trading companion designed to generate high-probability entry signals with dynamic TP/SL/DP levels based on volatility. Built-in performance tracking shows win/loss stats, PP1/PP2 hits, and success rates all updated live. Key Features: Buy/Sell signals with adaptive volatility bands Real-time TP/SL/DP levels based on ATR Built-in MA Filter with optional ATR/StdDev volatility Performance stats panel (Success, Profit/Loss, PP1/PP2) Alerts via popup, sound, push, or email Cus
AriX
Temirlan Kdyrkhan
AriX Indicator for MT5 A powerful trend-following and signal-evaluation tool AriX is a custom MT5 indicator that combines Moving Averages and ATR-based risk/reward logic to generate clear buy/sell signals. It visualizes dynamic SL/TP levels, evaluates past trade outcomes, and displays win/loss statistics in a clean on-chart panel. Key features include: Buy/Sell signals based on MA crossovers ATR-based SL/TP1/TP2/TP3 levels with visual lines and labels Signal outcome tracking with real-time stat
Weis Wave with Alert MT5
Trade The Volume Waves Single Member P.C.
4.94 (17)
Rental/Lifetime Package Options and Privileges  Rent Monthly Six Months   Yearly/Lifetime Weis Wave with Speed with Alert+Speed Index x x x Manual  x x x Quick Set up Video x x x Blog x x x Lifetime Updates x x x Setup and Training Material x x Discord Access Channel "The SI traders"          x Rectangle Break Alert Tool      x How to trade with it:    http://www.tradethevolumewaves.com   ** If you purchase please contact me to setup your  : Training Room and  complete manual access.  Wei
UZFX SWS {スキャルピング・ウィニング・シグナルズ} Pro v1.0 は、Usman Zabir(UZFX LABS)が開発した強力なノンリペインティング指標です。急変する市場で正確なエントリーシグナルを求めるスキャルパー、デイトレーダー、スイングトレーダー向けに特別に設計されています。遅延や誤った再描画のない、信頼性の高いリアルタイムシグナルを求めるトレーダーに最適です。 私のおすすめ* 最適時間枠:30分以上。 {1時間} が私のお気に入りです。そして結果は驚くべきもの...! 主な機能: 直近および過去のシグナルを明確な視覚的矢印で表示(古いシグナルを点で表示するオプション付き)。 取引ラインの自動計算・描画:エントリー、ストップロス(直近のスイングロー/ハイに基づく)、複数テイクプロフィットレベル(RRR 1:1、2:1、3.5:1 – 完全カスタマイズ可能)。 最新シグナル詳細、エントリー価格、SL、TPレベルを表示するチャート上情報パネル。 包括的アラート:ポップアップ、サウンド、プッシュ通知、メール。 チャートカスタマイズオプション(色、背景、ローソク足ス
AlgoEAs Trend Dashboard V1 Indicator for MT5 Introduction: This is a Dashboard Indicator based on 7 built in Multi Timeframe indicators. This strategy gives Buy/Sell Ideas based on 9 trend states. Easy to view gas guage to view current trend. Has as optional Alerts to enable with 9 messages. Run on M15 chart, with M15, H1, and H4 indicator time frames. Great tool! Features: Non-Repainting Dashboard For Desktop MT5 Only, Works On Any Mt5 Pair Great for Intraday and Swing Trading Easy view gas
Big Player Range
Thalles Nascimento De Carvalho
5 (3)
BigPlayerRange — MT5向け最強インジケーター BigPlayerRange は、MetaTrader 5 で日経ミニやドル先物などの取引において、 最も効果的なインジケーター と評価されています。大口投資家(機関投資家)の行動を可視化し、高精度なテクニカル分析を可能にします。 どのように機能するのか? BigPlayerRangeは、買い圧力ゾーン(緑ライン)と売り圧力ゾーン(赤ライン)を描画し、価格がその範囲を超えるとトレンド方向への動きを示唆します。 緑のライン上で終値: 買いの勢いが強く、上昇トレンドの可能性。 赤のライン下で終値: 売り圧力が優勢で、下落が予想される。 範囲内での価格: レンジ相場でブレイクを待つ段階。 主なメリット: 機関投資家ゾーンの検出: 大口のエントリーポイントを視覚化。 自動ターゲット計算: 利確ポイントを戦略的に設定。 プルバックの可能性分析: リスク管理に役立つ情報提供。 推奨の使い方: Imbalance DOM Pro と併用してゾーンブレイクを確認。 SwingVolum
IVISTscalp5
Vadym Zhukovskyi
5 (6)
iVISTscalp5インジケーターをご紹介します。このインジケーターは、トレーディングにおいて独自でありながら効果的です。時間データに基づくこのインジケーターは、多年にわたる経験と金融市場の深い分析の結果です。iVISTscalp5インジケーターは、手動トレーディングにとって優れたツールです。便利さ、簡単さ、可視化 - すべての複雑さが内部に隠されています。私たちは、iVISTscalp5インジケーターの設定と使用を最大限に簡素化しました。このインジケーターは、MT5ターミナルにあるすべての金融商品に適しています。 稼働時間は、4時から20時(UTC+3)です。 iVISTscalp5インジケーターメニュー(スクリーンショット1を参照): History - 引用を計算する週数 dT_min - 時間間隔の選択(分) TFline - 水平ボリュームの作成(時間枠) BARSline - 水平ボリュームの作成(バー数) TFtrend1 - デイリーチャンネルの作成(時間枠) BARStrend1 - デイリーチャンネルの作成(バー数) TFtrend2 - 週次チャンネルの作成(時
MATADOR SILVER – XAGUSD MT5 M5 Timeframe Scalp Signals MATADOR SILVER is a professional signal and decision-support indicator developed specifically for XAGUSD (Silver) scalping on the M5 timeframe , designed for real market conditions and disciplined execution. This indicator does NOT open, manage, or close trades automatically . It provides structured BUY & SELL signals , intelligent filtering, and alerts, allowing traders to execute trades using their own strategy and risk management rules .
LTL ロングトレンドロケーター v2.0 - プロフェッショナルトレンドトレード指標 LTL ロングトレンドロケーターは、強力で持続的なトレンドを特定することで、トレーダーが市場への最適なエントリー・エグジットタイミングを見つけるのを支援します。トレンドの開始と終了時に明確なシグナルを提供し、適切なタイミングで正しい方向への取引を可能にします。強力な市場トレンドを発見し、明確なエントリー・ストップロス・テイクプロフィットレベルと共に、取引を配置すべき正確な位置を示します。 主な機能: 明確な買い/売りシグナル: 市場が上昇または下降する準備が整った際に矢印を表示 トレードライン表示: チャート上に完全なトレード設定を描画し、全レベルを明確に表示 トレンドゾーン: チャートを色分けし、強気(緑)または弱気(ピンク)の期間を表示 統計表示:各トレンドの持続バー数とポイント数を表示 情報パネル:現在のトレンド状態と最終シグナル時刻を表示 アラートシステム: 新規シグナル発生時にポップアップ/メール/音で通知 シグナルごとに1回のみ通知(煩わしい繰り返しなし) 操作の簡便性:
Rtc ML Ai | Predictor CORE MACHINE LEARNING ENGINE Adaptive ML Market Predictor – Multi-Bar Trend & Candle Forecast What This Indicator Does This indicator is a  real-time market prediction engine  designed to analyze price behavior and estimate  future market tendencies . Unlike conventional indicators, this system  does not rely on static parameters or historical curve-fitting , but adapts its internal state dynamically during live market operation. Instead of using static rules, the indic
Recommended TimeFrame >= H1. 100% Non Repainted at any moment.  Use it carefully, only with Trend Direction. Trading Usage: 2 Variants: as Range System or as BreakOut System (Both Only With Trend Direction)::: (Always use StopLoss for minimise Risk); [1] as Range System: (Recommended) in UP TREND:  - BUY in Blue Line , then if price goes down by 50 points (on H1) open Second BUY.   Close in any Profit you wish: TrailingStop(45 points) or Close when Price touches upper Gold Line. in DOWN TREND
This is an advanced indicator used with success rate.Unlock the secrets of trading Boom and Crash spikes with our powerful MT5 indicator! This spike detection tool provides accurate buy and sell signals, trade alerts, and High success rate entries. Perfect for scalping, day trading, and swing trading. Get the best Boom and Crash strategy with our Deriv Boom and Crash spike indicator. Indicator does not redraw or repaint. Recommendation · Use a Virtual Private Server (VPS) for 24/7 alerts on mob
WARNING: This indicator is distributed EXCLUSIVELY on MQL5.com MT4 version:   https://www.mql5.com/it/market/product/160363 MT5 version:   https://www.mql5.com/it/market/product/160410 ============================================================================================= MAX RIBBON ver 1.00 The indicator that shows you the TREND clearly and unambiguously! ============================================================================================= DESCRIPTION MAX RIBBON is an advanced tre
+++++++++++++++++++++++++++++++++++++++++++++++++++++++++++++++++++++++++++++++++++++++++++++++++ +++ Link to EURUSD Only Free Version -->  https://www.mql5.com/en/market/product/156904?source=Unknown +++++++++++++++++++++++++++++++++++++++++++++++++++++++++++++++++++++++++++++++++++++++++++++++++ Hallo Trader, This is a traditional GANN & FIBONACCI strategy based on detection of an impulsive move in the opposite direction. This is called a Breakout. At the moment of Breakout, the indicator draw
##   ONLY GOLD ##   Тiльки Золото ## **Mercaria Professional Trading Zones - Complete Guide** ## **Mercaria Professional Trading Zones - Повний посібник** ### **How Mercaria Zones Work / Як працюють зони Mercaria** **English:** Mercaria Zones is an advanced trading indicator that identifies high-probability support and resistance areas using ZigZag extremes combined with mathematical zone calculations. The indicator works on multiple timeframes simultaneously, providing a comprehensive view
マーケットメーカーのためのツール。 Meravith は次の機能を提供します: すべての時間足を分析し、現在有効なトレンドを表示します。 強気と弱気の出来高が等しくなる流動性ゾーン(出来高均衡)を強調表示します。 異なる時間足のすべての流動性レベルをチャート上に直接表示します。 テキスト形式の市場分析を生成し、参考情報として表示します。 現在のトレンドに基づいて目標値、サポートレベル、ストップロスを計算します。 取引のリスクリワード比を算出します。 口座残高に基づいてポジションサイズを計算し、潜在的な利益を推定します。 また、市場に大きな変化があった場合には警告を表示します。 インジケーターの主要ライン: 強気/弱気の出来高エグゾーストライン ― 目標値として機能します。 市場のトレンドを示すライン。市場が強気か弱気かによって色が変わり、トレンドのサポートとして機能します。主にその色が市場センチメントを示します。 出来高均衡ライン(Eq)。Eq(Volume Equilibrium)ラインはシステムの中核です。これは買い手と売り手の出来高のバランスポイントを表します。市場の流動性を示し
FRONTIER PIVOTS - Geometric Levels Indicator This indicator plots support and resistance levels/ranges on the chart using mathematical calculations. It helps traders identify potential price reaction zones based on geometric patterns. Main Features: Automatically calculates and displays key price levels Plots both support and resistance lines Uses daily price data for level calculation Clean visual presentation with different colors for different level types No repainting - levels remain static
A tool for on-chart strategy backtesting and performance analysis. A utility for developing, debugging, and testing custom trading ideas and indicator functions. An indicator designed to quickly test trading concepts and visualize the effectiveness of different input parameters. An all-in-one sandbox for testing everything from simple crossovers to complex, multi-condition trading systems.
VTrende Pro
Andrii Diachenko
5 (1)
VTrende Pro - MTF indicator for trend trading with a display panel for MT5 *** Videos can be translated into any language using subtitles (video language - Russian) Although the signals of the VTrende Pro indicator can be used as signals of a full-fledged trading system, it is recommended to use them in conjunction with the Bill Williams TS. VTrende Pro is an extended version of the VTrende indicator. Difference between Pro version and VTrende: - Time zones - Signal V - signal 1-2 waves -    S
FXLAND Smart Reversal Indicator (MT5) FXLAND Smart Reversal Indicator is a professional technical analysis tool designed to help traders identify potential price reversal zones and key market turning points with clarity and precision. The best reversal indicator and price return by choosing only one ceiling or floor in each time frame A masterpiece of combining mathematics and Gann, fractal matrix, Fibonacci, movement angle and time. Completely intelligent Key Features Detects potenti
CGE Trading Suite
Carl Gustav Johan Ekstrom
5 (1)
CGE Trading Suite delivers the analytical edge typically reserved for professional trading desks. The platform integrates a full suite of analytical tools into one seamless workflow: dynamic grid mapping, liquidity behavior analysis, ECM, trend lines, MIDAS, trade cycles, and directional channel projections. Together, these provide a unified view of market structure and momentum. Directional clarity is further enhanced by the capital flow index, which measures currency basket strength to identif
A scalping indicator based on mathematical patterns, which on average gives signals with relatively small SL, and also occasionally helps to catch big moves in the markets (more information in the video) This indicator has three main types of notifications: The first type warns of a possible/upcoming signal on the next bar The second type indicates the presence of a ready signal to enter the market/open a position The third type is for SL and TP levels - you will be notified every time price re
MATADOR GOLD – XAUUSD MT5 M5 Timeframe Scalp Signals MATADOR GOLD is a professional signal indicator designed for XAUUSD (Gold) scalping on the M5 timeframe , with optional higher-timeframe confirmation. This indicator does not open or manage trades automatically . It provides structured buy and sell signals, intelligent filtering, and alerts, allowing traders to execute trades using their own strategy and risk management rules. Core Concept (Multi-Concept Architecture) MATADOR GOLD is built
XCalper TFO
Aecio de Feo Flora Neto
This oscillator was developed exclusively by xCalper in 2015 based on moving averages calculations to indicate and try predicting oversold and overbought levels. The fast line (white, by default) oscillates basically between values -0.5 (oversold) and +0.5 (overbought). Whenever this line crosses upward value -0.5, it means an oversold price level. When it crosses downward value +0.5, it means an overbought price level. When fast line crosses value 0.0 and returns, it is a strong pull-back indic
作者のその他のプロダクト
the indicator will show signal arrows on the graph at the crossing of a given level it has push and audible alerts. By crossing from low to high level 0.3, a blue arrow will come out for the purchase, at the same time an audible signal will sound. By crossing from low to high level 0.7, a red arrow will come out for the sale, at the same time an audible signal will sound. Possibility to deactivate push and audible alerts. MT5 version :  https://www.mql5.com/en/market/product/51968
This Expert Advisor must be placed on a second graph; placing on a second chart it will automatically modify your orders placed without StopLoss and TakeProfit. Editable parameter; updates will be available shortly to improve its efficiency. It only has two editable entries in its parameter: (Stoploss and Takeprofit). A trailing stop function will soon be added to it.
Colored candlesticks showing the trend based on two moving averages and the slope of the slow moving average. For long term trends use Period2 = 200. Convenient to filter trends according to your trading strategy The time unit also depends on your trading style Gives you a signal for each trend, displayed on the screen coloring the candlesticks. No sound signal; no push notification; these functions will be there in the next updates
the indicator will show signal arrows on the graph at the crossing two EMA it has push and audible alerts. By crossing above each others , a blue arrow will come out for the BUY, at the same time an audible signal will sound. By crossing Below each others, a red arrow will come out for the SELL, at the same time an audible signal will sound. Possibility to deactivate push and audible alerts.
the indicator will show signal arrows on the graph at the crossing of Awesome Oscillator base level it has push and audible alerts and Email alert. By crossing above base level , a blue arrow will come out for the BUY, at the same time an audible signal will sound. By crossing Below base level, a red arrow will come out for the SELL, at the same time an audible signal will sound. Possibility to deactivate push and audible alerts. MT5 version :  Buy the 'Awesome cross MT5' Technical Indicator fo
the indicator will show signal arrows on the graph at the crossing of MACD level it has push and audible alerts. By crossing from low to high level 0, a blue arrow will come out for the BUY, at the same time an audible signal will sound. By crossing from low to high level 0, a red arrow will come out for the SELL, at the same time an audible signal will sound. Possibility to deactivate push and audible alerts. MT5 :  Buy the 'MACD Arrow' Technical Indicator for MetaTrader 5 in MetaTrader Marke
the indicator will show signal arrows on the graph at the crossing of a given level it has push and audible alerts. By crossing from low to high level 0.3, a blue arrow will come out for the purchase, at the same time an audible signal will sound. By crossing from low to high level 0.7, a red arrow will come out for the sale, at the same time an audible signal will sound. Possibility to deactivate push and audible alerts. MT4 version of this product here
ichimoku indicator with alert; audible alert, email alert, push alert you can enable or disable the settings as you wish When there is a crossing of tenkansen and kijun you will get an alert When there is a cross between Senkouspan A and Senkouspan B you will get an alert Affordable sound settings possibility to modify the parameters of the ichimoku indicator
this indicator is a Spike detector indicator, it is specially designed to trade Boom 1000, Boom 500, Crash 1000 and Crash 500 We recommend using it on Deriv Boom and Crash indices only Its setting is intuitive, familiar, easy to use it has notification functions; audible notifications and push notifications. this tool is simple to use, easy to handle This update is based on different strategies for spikes
RSI Arrow1 is an arrow indicator based on the RSI, is easy to use; no internal adjustments to be made. the user can change the indicator period as desired in the settings. It can be used on all markets but it will all depend on your Trade strategy. There is no better Time Frame for its use; the use will depend on the Trader himself. Settings: RSI Period Push Notification Email Notification Audible Alert Down levels Up levels
This indicator is based on the crossing of two Moving Average with the RSI It is intended for scalpers Specially designed for Boom and Crash syhtetic indices from Binary.com/Deriv.com It is easy to use and intuitive. We recommend its use on M1 and is equipped with three types of notification Email alert Sound notification Push notification these parameters can be activated and deactivated.
This indicator is a scalping indicator intended solely for the Boom and Crash indices of the Deriv Limited market It supports Boom 500, Boom 1000, Crash 500 and Crash 1000 Not repaint and no bug The settings are intuitive and easy to use The product activation number is 20 The Time Frame used depends on the user If you are an aggressive scalper then just use M1 For long trades use M15 If you are conservative use M5 Please contact me for more details of its use
the indicator will show signal arrows on the graph at the crossing of Awesome Oscillator base level it has push and audible alerts and Email alert. By crossing above base level , a blue arrow will come out for the BUY, at the same time an audible signal will sound. By crossing Below base level, a red arrow will come out for the SELL, at the same time an audible signal will sound. Possibility to deactivate push and audible alerts. MT4 version :  Buy the 'Awesome cross' Technical Indicator for M
フィルタ:
レビューなし
レビューに返信