PAX3 Price Action Indicator

5
You probably won't see the power of the indicator in the backtest, because it uses 3 windows, something you can't do, in the DEMO version that the site offers.  I trust 100% on my work and on my indicator, if you want a test version, send me a message, different from other sellers, who just want to "sell", I want whether you have a full version before renting and deciding.

Christmas Discount 30% off until the 25th

As you can imagine, it was a failure, I'm not saying that any indicator doesn't work, but they alone, don't help much.


I spent almost 4 years losing money in the market, until finally, after starting to work in a bank, I started to understand how the game works.

What moves the market are the big liquidity providers, they make the price go up or down.

And there's a way to follow this and it's simple, just follow the price!

Price Action has become trendy, but 90% of the people who teach it don't know for sure how it works.

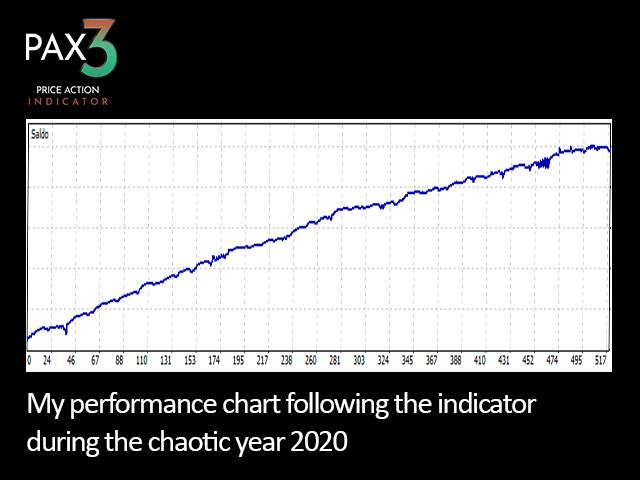
I developed my own setup over these years, with an average hit rate of 82%, and in some months hitting over 90%, all with a lot of discipline.

All my trades have a 2/3 to 1 ratio, that is, I get 2 or 3, to lose 1

With this, I needed to create something that would be "easy" to visualize the price movement, and after 1 year after improving, here comes my own price action indicator, to facilitate my trades.

I've been using it for over 3 years with a lot of success, and today I'm willing to put it to rent so other people can earn as I do.

It doesn't need configuration (just the news parameter), you just need to put the template on your screen and start the trades.
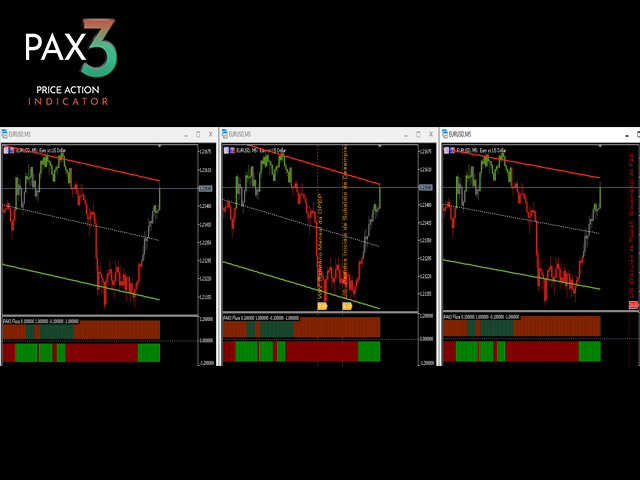
HOW TO INSTALL:
- Open 3 screens of the same asset in M5 
- I put in window 1, template 1, in window 2 template2 and in window 3 template3
The indicator is ready for use


HIGHLIGHTS:
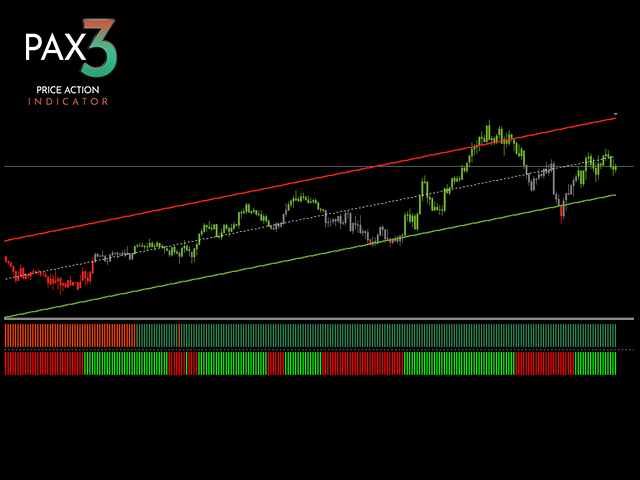
- The candles are painted to confirm your entry (Do not repaint)
- There is in real time the economic calendar of the main news for you not to enter the trade at the wrong time
- Triple Screen: you see the trend clearly, and you'll never miss a trade again


I recommend downloading the operations manual so you know in detail how it works, but everything is very simple, just follow the direction of the channel... and operate in the price zones (buy or sell)

When you buy, request my PAX3 FLUXE indicator completely free per message.

It shows us the current smart money flow, ie who is making the price move, if not the buyers or sellers, this can anticipate a market move, BELIEVE, it can actually predict a drop or a rise before it happens.


レビュー 7
Juliano Pacheco
91
Juliano Pacheco 2021.04.05 20:45 
 

Excelente para operações curtas ou seguindo uma tendência de curto prazo. Um dos melhores indicadores que já comprei na comunidade...

Marcus Ataide
250
Marcus Ataide 2021.03.05 18:10 
 

Really good indicator, gives you not only the signals but also the zone trending, so you will reduce your risk a lot. Thanks!

freddo13542
139
freddo13542 2021.03.02 12:12 
 

I have had a good number of trades, all winning so far between 5-20pips depending on the volatility of the pair. Very good looking indicator, still getting used to the feeling of it and when to step back from it for a couple hours when no signals are close.

おすすめのプロダクト
MT5 Drawdown Tracker – Track Your EA’s Performance with Precision! Take your trading analysis to the next level with our MT5 indicator designed to monitor, record, and report the drawdown of any Expert Advisor. Whether you’re fine-tuning your strategies or optimizing risk management, this tool gives you the insights you need. Key Features: Effortless Tracking: Automatically monitors the drawdown levels of your EAs with precision. Comprehensive Data Storage: Accurately logs each drawdown event,
The Hybrid Trend Impulse indicator is an advanced tool that combines modern approaches to trend and impulse analysis, offering unique capabilities for effective deposit management. Key advantages of the HybridTrendImpulse_indicator: Nonlinear dynamics: The method of interaction between opening prices forms a unique nonlinear model that is particularly sensitive to significant price fluctuations, increasing their significance and making the indicator ideal for working in high volatility conditio
HiLo Activator is one of the most used indicators to determine trend. Find it here with the ability to customize period and colors. This indicator also plots up and down arrows when there is a change on the trend, indicating very strong entry and exit points. HiLo fits well to different types of periods for day trading. You can easily understand when it is time to buy or sell. It works pretty good also for other periods like daily and monthly signalizing long-term trends. The use of the indicato
TouchGuard Alert – Advanced Price Alert & Notification Indicator for MetaTrader 5 (MT5) TouchGuard Alert is a fast, lightweight, and highly accurate price-touch Alert & Notification system designed for MetaTrader 4 (MT4) and MetaTrader 5 (MT5) . It automatically sends real-time Alerts, Pop-Up Alerts, Email Notifications, Push Notifications and early-warning notifications when price touches or approaches your chart objects. Key Features (High-Precision Alert & Notification System) Comprehensive P
RED ZONE Monitor Loss-Cut & Break-Even Risk Monitor for Averaging Traders (MT5) RED ZONE Monitor is a risk management indicator for traders who use averaging, scaling-in, or multiple open positions . It visually displays: The loss-cut (liquidation) risk zone The break-even price Based on current open positions, lots, and margin conditions This indicator does not provide entry signals. It does not promise profits. It shows where your account actually fails if price moves against you. What RED ZO
Boom & Crash Master Mitigation Pro   is a high-performance MT5 indicator engineered specifically for the Deriv synthetic indices market. Unlike standard indicators that lag, this tool uses a   Zero-Lag Persistent Level   algorithm to detect institutional support and resistance zones. It identifies "Return to Impulse" moves (Mitigation) and provides high-probability entry signals for both initial spikes and trend continuations. With its smart "Bullish/Bearish Lock" logic, it filters out dangerous
The " Stochastic Advanced " indicator displays the signals of the 'Stochastic" indicator directly on the chart without the presence of the indicator itself at the bottom of the screen. The indicator signals can be displayed not only on the current timeframe, but also on a timeframe one level higher. In addition, we have implemented a filter system based on the Moving Average indicator. Manual (Be sure to read before purchasing) | Version for MT4 Advantages 1. Displaying the signals of the "Stoch
Basic information. To perform its work, the indicator takes data on volumes from a lower timeframe, builds Market Profiles for a higher timeframe and a histogram for the current timeframe. The indicator starts in several stages. In this case, messages like: "Build Source & Target TF. Step: …" are output to the log. The process can be accelerated by changing the input parameter Milliseconds between steps - the initialization speed. The final value of this parameter is always individual and is set
Check out my TRADE PLANNER MT5 – strongly recommended to anticipate account scenarios before risking any money. This is a multi-symbol, multi-timeframe, table-based indicator for MetaTrader 5 that identifies 46 types of candlestick formations. Each formation has its own image for easier recognition. The indicator includes popular patterns such as Engulfing, Hammer, Three Line Strike, Piercing, and Doji-like candles. You can check the full list of patterns in the screenshots below. Also you can
Advanced 4xZeovo MT5 Indicator (MetaTrader 5)   Product Description  4xZeovo is a powerful trading indicator system monitoring 24/7 financial markets. Metatrader5 tool designed to find the best buying/selling opportunities and notifies the user.    Making life easy for traders in helping with the two most difficult decisions with the use of advanced innovate trading indicators aiming to encourage users to hold the winning positions and take profit at the best times.    Equipped with a unique tra
HiLo Activator v1.02 by xCalper The HiLo Activator is similar to moving average of previous highs and lows. It is a trend-following indicator used to display market’s direction of movement. The indicator is responsible for entry signals and also helps determine stop-loss levels. The HiLo Activator was first introduced by Robert Krausz in the Feb. 1998 issue of Stocks & Commodities Magazine.
FULL TREND KILLER is an indicator based on Bollingen Bands and it is easy to use; no internal adjustments to be made. It is specially designed for synthetic indices but also works well on Forex Assets. The best time frame to use on synthetic indices is M15, this is just a tip, however it can be used on all time frames. Settings : BANDS PERIOD Push Notification Email Notification Audible Alert
インディケータは現在のクオートを作成し、これを過去のものと比較して、これに基づいて価格変動予測を行います。インジケータには、目的の日付にすばやく移動するためのテキスト フィールドがあります。 オプション: シンボル - インジケーターが表示するシンボルの選択; SymbolPeriod - 指標がデータを取る期間の選択; IndicatorColor - インジケータの色; HorisontalShift - 指定されたバー数だけインディケータによって描画されたクオートのシフト; Inverse - true は引用符を逆にします。false - 元のビュー。 ChartVerticalShiftStep - チャートを垂直方向にシフトします (キーボードの上下矢印)。 次は日付を入力できるテキストフィールドの設定で、「Enter」を押すとすぐにジャンプできます。
"We have developed a highly accurate trading signal system applicable to all assets on the 15-minute (M15) timeframe. Calibrated against actual Gold price behavior, this system allows users to trade every candlestick effectively, regardless of market conditions—whether the market is trending, moving sideways, or reversing. The system features real-time arrows and color-coded indicators that signal immediate Buy or Sell entry points. This allows traders to use it as a reliable confirmation tool t
FREE
RangeZone  Indicator General Overview: Global Exchange Trading from East to West World financial markets operate on the principle of continuous trading sessions, where activity moves with the sun from one financial center to another. Understanding this dynamic is key to successful trading! How Trading Moves Around the World: Asian Session   (Sydney, Tokyo): Opens first, sets the tone for daily volatility Japanese yen, Australian dollar, Asian indices Often forms key support/resistance level
DRX PRIME FLOW は、市場構造とボラティリティの変化をチャート上で直接可視化するために設計された、自動適応型市場分析システムです。 ガイド&マニュアル: ここをクリック 手動での調整の代わりに、このシステムはバックグラウンドで現在の資産のボラティリティに適応する動的アルゴリズムを使用しています。ゴールド、暗号資産、通貨、インデックスにおいて、パラメータの調整なしにシームレスに機能します。 主な機能 自動適応ゾーン: インジケーターは、市場のボラティリティに基づいて拡大・縮小する動的なバンドを投影します。 内部ゾーン: 市場は均衡状態にあります。 外部ゾーン: 市場は過熱状態 – 反転またはプルバックの可能性があります。 スマート背景可視化: チャートの背景色を使用して市場フェーズを通知します。 色 A(例:緑): 価格が下限の極値に到達(買いの潜在ゾーン)。 色 B(例:赤): 価格が上限の極値に到達(売りの潜在ゾーン)。 ニュートラル: 価格は正常範囲内です。 ダッシュボードパネル: 中央のヘッドアップディスプレイ(HUD)に、現在のトレンド方向とフローの状態が表示されま
SlopeChannelB – 価格の傾斜チャネルを構築するテクニカル分析ツールで、市場の現状を評価し、取引シグナルを見つけるためのユニークな機会を提供します。 インジケーターの主な特徴: 価格の傾斜チャネル : このインジケーターは、サポートとレジスタンスのレベルを視覚化するのに役立ち、トレンドの逆転または継続の可能性を示すことができます。 ラインの色と背景の強調表示が異なる : 傾斜したサポートとレジスタンスのレベルは異なる色で表示され、チャネル自体はさらに背景で強調され、チャートの視覚的分析を簡素化します。 ライン計算のための3つのオプション : このインジケーターは回帰分析を使用してチャネルラインを構築します。3つの方法から選択できます: Robust(デフォルト) – 外れ値に強い方法。 OLS(最小二乗法) . Median(中央値計算) . 最適なモデル選択 : SlopeChannelBは5つの品質基準の分析に基づいて最も適切なチャネルラインのバリエーションを自動的に選択します。 品質パラメータはチャートに直接表示され、結果の評価に役立ちます。また、ボタンを使
Forex Strategist is a trading system for EURUSD, USDCHF, USDJPY, AUDUSD, NZDUSD, EURJPY, AUDJPY, NZDJPY, CADJPY H2 and H3 Timeframe.  Input Parameters: Line setting:  Line Style: Default is Solid Buy Color: Default is White Sell Color: Default is White Stop Loss Color: Default is White Target Color: Default is Gold Panel Setting:  Corner: Default is Let upper chart corner X Panel: Default is 10 Y Panel: Default is 20 BackGround1: Default is DarkBlue BackGround 2: Default is 47,47,47 Text Color
Ing (inguz,ingwar) - the 23rd rune of the elder Futhark ᛝ, Unicode+16DD. Add some runic magic to your trading strategies. The correct marking of the daily chart will indicate to you the successful moments for counter-trend trading. Simple to use, has high efficiency in volatile areas. Be careful in lateral movements. Signals ᛝ are generated when the main lines of construction intersect. Red arrow down - recommended sales Blue up arrow - recommended purchases rare purple arrows indicate exce
The indicator detects divergence signals - the divergences between the price peaks and the MACD oscillator values. The signals are displayed as arrows in the additional window and are maintained by the messages in a pop-up window, e-mails and push-notifications. The conditions which formed the signal are displayed by lines on the chart and in the indicator window. The indicator parameters MacdFast - fast MACD line period MacdSlow - slow MACD line period MacdSignal - MACD signal line period Macd
FlagTrendTF Free Indicator for MetaTrader 5 FlagTrendTF is a free MetaTrader 5 indicator designed to help traders identify market trends across multiple timeframes quickly and visually. It is ideal for confirming whether the market direction is aligned from higher timeframes down to the trading timeframe. How FlagTrendTF Works The indicator allows you to monitor up to 4 timeframes simultaneously , displaying easy-to-read arrows: Green arrow : bullish trend Red arrow : bearish trend This fa
FREE
RSI Indicator with Bollinger Bands: Maximize Your Win Rate with Precision and Advanced Trading Strategies Take your trading to the next level with the RSI Indicator combined with Bollinger Bands. Customize the RSI period, band moving average, and deviation to tailor the indicator to your unique strategies. Upon request, we also offer the possibility to customize or create bespoke indicators to best meet your trading needs.
Note: This indicator is for sub-window use and not for the main chart. If you need to apply it for the indicators in the main chart, then use this indicator instead:  https://www.mql5.com/en/market/product/108876 AIntel Predict   - Your Gateway to Future Trading Success! Unlock the power of predictive analytics with AIntel Predict. Say goodbye to the guesswork and hello to improved forecasting, as AIntel Predict leverages historical data to unveil the future of your trades like never before. Whe
Every indicator has its advantages and disadvantages. Trending ones show good signals during a trend, but lag during a flat. Flat ones thrive in the flat, but die off as soon as a trend comes. All this would not be a problem, if it was easy to predict when a flat changes to a trend and when a trend changes to a flat, but in practice it is an extremely serious task. What if you develop such an algorithm, which could eliminate an indicator's flaws and enhance its strengths? What if such an algorit
TheRealPrice v3.0 | Ultimate Spread & Ask Visualizer TheRealPrice is a high-precision utility for MetaTrader 5 designed to expose the hidden cost of every trade: The Spread . While standard charts only display the Bid price, professional traders know that buy orders and short-exits happen at the Ask price. TheRealPrice bridges this gap by drawing a dynamic, real-time horizontal line that tracks the exact Ask level, providing a clear visual representation of the current market spread. Why do you
##   ONLY GOLD ##   Тiльки Золото ## **Mercaria Professional Trading Zones - Complete Guide** ## **Mercaria Professional Trading Zones - Повний посібник** ### **How Mercaria Zones Work / Як працюють зони Mercaria** **English:** Mercaria Zones is an advanced trading indicator that identifies high-probability support and resistance areas using ZigZag extremes combined with mathematical zone calculations. The indicator works on multiple timeframes simultaneously, providing a comprehensive view
r-Trend Sync indicator is manual trading system for extra volatility markets. Main System features : The indicators's algorithm is based on the analysis of an extensive array of historical data (from 1995 for EURUSD & EURJPY and from 2004 for XAUUSD), which ensured the identification of general patterns in the behavior of these pairs across a wide range of timeframes. The analysis of historical data helped the system learn to recognize market triggers for medium-term trends and cycles, as well a
A professional expert analyzes the market using the relative strength index. The basic principle is that the bot takes the indicated prices for a certain period of time and calculates the strength and amplitude of the price. This can show when the trend will lose strength and reverse. The signal from the exit from the overbought/oversold zones is analyzed, the levels of these zones will be the levels with LEVEL_MAX and LEVEL_MIN values. We buy when the signal first falls below a certain level (
VM Heiken Ashi Pro  ノイズを除去し明確な BUY/SELL シグナルを生成するための平滑化された Heiken-Ashi(HMA または EMA)。非リペイント(オプション ConfirmOnClosedBar)。チャート上に HA ローソクを表示(元のローソクは非表示可)、矢印の配置は ATR または固定オフセットによる。アラートを送信(popup、email、push)し、アンチスパム処理を行います。 主な目的 生のローソク足を平滑化された Heiken-Ashi に変換し、色の変化(ベアからブルへ / ブルからベアへ)を検出してエントリー用の矢印を描画します。ConfirmOnClosedBar オプションはシグナルのリペイントを避けるためにローソクのクローズを待つことを可能にします。UseATRForArrowOffset は矢印の表示をより自然にします。軽量で多くのチャート上で安定しています。 簡単な使用方法 インジケーターをアタッチし、Smoothing Method と Smoothing Period(デフォルト 50)を選択します。リペイント
VarMomentPulse is a unique manual trading algorithm developed with precision and flexibility in mind, based on an extensive historical data cluster.  Its operation is grounded in the principles of analyzing crossovers between normalized moving averages and dispersions across various time intervals, enabling it to uncover new opportunities in evaluating market trends. Key Features of the VarMomentPulse Indicator: Adaptability to Volatility:The use of price dispersion analysis allows VarMomentPul
このプロダクトを購入した人は以下も購入しています
Market Flow Pro Market Flow Pro is an intelligent trading advisor for the MetaTrader 5 platform, designed for automatic trading on financial markets using algorithmic analysis and strict risk management. -Key features: - Fully automatic trading 24/5 - Adaptive trend and momentum entry algorithm -  Built-in risk management - Flexible lot settings (fixed/auto-calculation) - Support for major currency pairs and indices - Optimised for operation on various timeframes  How it works Market
ARICoin is a powerful trading companion designed to generate high-probability entry signals with dynamic TP/SL/DP levels based on volatility. Built-in performance tracking shows win/loss stats, PP1/PP2 hits, and success rates all updated live. Key Features: Buy/Sell signals with adaptive volatility bands Real-time TP/SL/DP levels based on ATR Built-in MA Filter with optional ATR/StdDev volatility Performance stats panel (Success, Profit/Loss, PP1/PP2) Alerts via popup, sound, push, or email Cust
AriX
Temirlan Kdyrkhan
1 (4)
AriX Indicator for MT5 A powerful trend-following and signal-evaluation tool AriX is a custom MT5 indicator that combines Moving Averages and ATR-based risk/reward logic to generate clear buy/sell signals. It visualizes dynamic SL/TP levels, evaluates past trade outcomes, and displays win/loss statistics in a clean on-chart panel. Key features include: Buy/Sell signals based on MA crossovers ATR-based SL/TP1/TP2/TP3 levels with visual lines and labels Signal outcome tracking with real-time stat
ARIPoint is a powerful trading companion designed to generate high-probability entry signals with dynamic TP/SL/DP levels based on volatility. Built-in performance tracking shows win/loss stats, PP1/PP2 hits, and success rates all updated live. Key Features: Buy/Sell signals with adaptive volatility bands Real-time TP/SL/DP levels based on ATR Built-in MA Filter with optional ATR/StdDev volatility Performance stats panel (Success, Profit/Loss, PP1/PP2) Alerts via popup, sound, push, or email Cu
Azimuth Pro
Ottaviano De Cicco
5 (4)
発売プロモーション Azimuth Proは先着100名様限定で 299ドル でご提供します。最終価格は 499ドル となります。 リテールとインスティテューショナルのエントリーの違いはインジケーターではなく、ロケーションにあります。 多くのトレーダーは、モメンタムを追いかけたり、遅行シグナルに反応して、任意の価格レベルでエントリーします。機関投資家は、需給が実際にシフトする構造的なレベルに価格が到達するのを待ちます。 Azimuth Proはこれらのレベルを自動的にマッピングします:スイングアンカーVWAP、マルチタイムフレーム構造ライン、高確率ロケーションにのみ出現するABCパターン。 Azimuth Proは、構造分析とインテリジェントな自動化の両方を求めるプロフェッショナルトレーダー向けに構築されています。 Azimuthが外科的精度で市場構造をマッピングする一方、Azimuth Proはインテリジェンスレイヤーを追加します:トレーディングスタイルの自動検出、スマート設定された移動平均線、20年のデータでバックテストされた最適化パラメータ。その結果、お使いの銘柄と
RelicusRoad Pro: 定量的市場オペレーティングシステム 【期間限定】無制限アクセス 70% OFF - 2,000人超のトレーダーと共に なぜ多くのトレーダーは「完璧な」インジケーターを使っても失敗するのでしょうか? それは、文脈を無視して 単一の概念 だけでトレードしているからです。文脈のないシグナルは単なるギャンブルです。勝ち続けるには、 根拠の重なり(コンフルエンス) が必要です。 RelicusRoad Proは単なる矢印インジケーターではありません。完全な 定量的市場エコシステム です。独自のボラティリティモデリングを用いて、価格が推移する「適正価値の道(Fair Value Road)」をマッピングし、ノイズと真の構造的ブレイクを判別します。 推測はやめましょう。機関投資家レベルの「ロード・ロジック」でトレードを。 コアエンジン:「Road」アルゴリズム システムの中心となる Road Algo は、市場環境にリアルタイムで適応するダイナミックなボラティリティチャネルです。 安全ライン(平衡点) と、価格が数学的に反転しやすい 拡張レベル を投影します。 Si
Ultimate SMC Indicator
Hicham Mahmoud Almoustafa
1 (1)
Ultimate SMC PRO – Smart Money Concepts Indicator (Order Blocks, FVG, Liquidity, BOS) for MetaTrader 5 Ultimate SMC PRO is a professional trading indicator designed to visualize Smart Money Concepts directly on the chart. The indicator combines several institutional trading tools in one system to help traders identify potential high-probability trading zones. ULTIMATE SMC INDICATOR — COMPLETE TRADING GUIDE The indicator analyzes market structure, liquidity behavior and price imbalance to highl
CGE Trading Suite
Carl Gustav Johan Ekstrom
5 (1)
CGE Trading Suite delivers the analytical edge typically reserved for professional trading desks. The platform integrates a full suite of analytical tools into one seamless workflow: dynamic grid mapping, liquidity behavior analysis, ECM, trend lines, MIDAS, trade cycles, and directional channel projections. Together, these provide a unified view of market structure and momentum. Directional clarity is further enhanced by the capital flow index, which measures currency basket strength to identif
Cyclic Impulse MT5 — このテクニカル指標はチャートを構築し、周期的な価格変動を識別します。これにより、反転する周期的な価格変動とエントリーシグナルを見つけることができます。 指標の仕組み 周期的な下降傾向が検出されると、ローソク足が閉じた後に青い下降バーが生成されます。このバーは現在のローソク足上でちらつく場合があり、シグナルはまだ確認されていません。青い矢印は価格チャートに複製されます。 周期的な上昇傾向が検出されると、ローソク足が閉じた後に赤い上向きバーが生成されます。このバーは現在のローソク足上でちらつく場合があり、シグナルはまだ確認されていません。オレンジ色の矢印は価格チャートに複製されます。 あらゆるチャート、時間枠、取引商品で使用できます。 複数のアラートタイプ。 価格チャートに追加の矢印を表示。 履歴データの再描画は行わず、ローソク足の終値に基づいて機能します。ローソク足が閉じても、矢印またはバーは消えません。 使いやすく、パラメータの設定も簡単で、不要な情報でチャートが乱雑になることはありません。 異なるパラメータを持つ2つのインジケーターを使用
まず第一に、この取引ツールはノンリペイント、ノンリドロー、ノンラグの指標であり、プロの取引に理想的ですことを強調する価値があります。 オンラインコース、ユーザーマニュアル、デモ。 スマートプライスアクションコンセプトインジケーターは、新米から経験豊富なトレーダーまで、非常 に強力なツールです。Inner Circle Trader AnalysisやSmart Money Concepts Trading Strategiesなど、20以上の有用な指標を1つに組み合わせています。このインジケーターはスマートマネーコンセプトに焦点を当て、大手機関の取引方法を提供し、彼らの動きを予測するのに役立ちます。 特に、流動性分析に優れており、機関がどのように取引しているかを理解しやすくしています。市場のトレンドを予測し、価格の動きを慎重に分析するのに優れています。機関の戦略とトレードを合わせることで、市場の動向についてより正確な予測ができます。このインジケーターは多目的であり、市場構造を分析し、重要な注文ブロックを特定し、さまざまなパターンを認識するのに優れています。 このインジケーター
このインジケーターは、市場で 関心が示されたゾーン をハイライトし、その後に 注文の蓄積ゾーン を表示します。 これは、大規模な**板情報(オーダーブック)**のように機能します。 これは、 巨大な資金 のためのインジケーターです。その性能は卓越しています。 市場にどんな関心が存在していても、 必ず目に見えるようになります 。 (これは 完全に再設計され、自動化されたバージョン です。もはや手動分析は必要ありません。) トランザクションスピード(取引速度) は新しい概念のインジケーターで、市場で大口注文が どこに・いつ 集中しているかを示し、それに基づいたチャンスを提供します。 トレンドの変化を 非常に早い段階 で察知することができます。 FXでは「出来高」と呼ばれているものは誤解されています。実際には、これは 時間あたりの価格変動量 です。したがって、正しい名称は トランザクションスピード です。 考え方・行動・分析の仕方すべてが問われます。 分析パラダイムの転換は非常に重要です。 このインジケーターは、FXにおける出来高の考え方を 根本から再定義 し、論理的な形で正確に活用する、
「 Dynamic Scalper System MT5 」インジケーターは、トレンド波の中でスキャルピング取引を行う手法のために設計されています。 主要通貨ペアと金でテスト済みで、他の取引商品との互換性があります。 トレンドに沿った短期的なポジションオープンのシグナルを提供し、追加の価格変動サポートも提供します。 インジケーターの原理 大きな矢印はトレンドの方向を決定します。 トレンド波の中では、小さな矢印の形でスキャルピングシグナルを生成するアルゴリズムが機能します。 赤い矢印は強気方向、青い矢印は弱気方向です。 トレンドの方向には敏感な価格変動ラインが描かれ、小さな矢印のシグナルと連動します。 シグナルは次のように機能します。適切なタイミングでラインが現れるとエントリーシグナルが形成され、ラインが開いている間はポジションが保持され、完了すると取引が終了します。 推奨される動作時間枠はM1~H4です。 矢印は現在のローソク足に形成され、次のローソク足が開いている場合は、前のローソク足の矢印は再描画されません。 入力パラメータ Trend Wave Period - トレ
Pointer Trend Switch — precision trend reversal indicator Pointer Trend Switch is a high-precision arrow indicator designed to detect key moments of trend reversal based on asymmetric price behavior within a selected range of bars. It identifies localized price impulses by analyzing how far price deviates from the opening level, helping traders find accurate entry points before a trend visibly shifts. This indicator is ideal for scalping, intraday strategies, and swing trading, and performs equa
Overview TriParity AfterShock PRO Scanner は、MetaTrader 5 用の裁量判断支援ダッシュボード型インジケーターです。本説明において、トライアッドとは 3 つの通貨ペアまたは銘柄の関係を意味します。Scanner は複数のトライアッドと時間足を 1 つのパネルで確認し、トレーダーが監視対象をより構造的に整理できるよう支援します。目的は、チャートの過密状態を減らし、候補を横並びで比較し、より詳しく確認すべき条件を目立たせることです。 本製品は三角裁定を実行するものではありません。真の三角裁定には、3 レッグのほぼ同時執行、非常に低いレイテンシー、そして非常に小さい取引コストが必要です。Scanner は、パリティ調整後にも一時的に残り得る歪み状態を裁量的にレビューするために設計されています。 Functions Scanner は、選択されたトライアッドを複数の時間足で分析し、NOWCAST によって現在の状態を表示します。NOWCAST はセットアップを A、B、C、または NG として評価します。この文脈で NG は、現在の状態が適して
ARIScalp is a powerful trading companion designed to generate high-probability entry signals with dynamic TP/SL/DP levels based on volatility. Built-in performance tracking shows win/loss stats, PP1/PP2 hits, and success rates all updated live. Key Features: Buy/Sell signals with adaptive volatility bands Real-time TP/SL/DP levels based on ATR Built-in MA Filter with optional ATR/StdDev volatility Performance stats panel (Success, Profit/Loss, PP1/PP2) Alerts via popup, sound, push, or email Cus
Trend deviation scalper - is the manual system to scalp choppy market places. Indicator defines bull/bear trend and it's force. Inside exact trend system also defines "weak" places, when trend is ready to reverse. So as a rule, system plots a sell arrow when bull trend becomes weak and possibly reverses to bear trend. For buy arrow is opposite : arrow is plotted on bear weak trend. Such arrangement allows you to get a favorable price and stand up market noise. Loss arrows are closing by common p
Matreshka
Dimitr Trifonov
5 (2)
Matreshka self-testing and self-optimizing indicator: 1. Is an interpretation of the Elliott Wave Analysis Theory. 2. Based on the principle of the indicator type ZigZag, and the waves are based on the principle of interpretation of the theory of DeMark. 3. Filters waves in length and height. 4. Draws up to six levels of ZigZag at the same time, tracking waves of different orders. 5. Marks Pulsed and Recoil Waves. 6. Draws arrows to open positions 7. Draws three channels. 8. Notes support and re
Native Channels
BeeXXI Corporation
5 (1)
This indicator recognizes all support and resistance levels. A number of unique high-performance techniques have been applied, which made the existence of this indicator possible. All formed channels are naturally visible: horizontal linear linear parabolic cubic (Polynomial 3 degrees - Wave) This is due to a bundle of approximating channels. The formed channels form "standing waves" in a hierarchical sequence. Thus, all support and resistance levels are visible. All parameter management is i
The Institutional Secret Method  represents a paradigm shift in market analysis, moving away from lagging indicators and into the realm of Topological Finance . It is engineered to decode the hidden geometry of price movement by calculating the most efficient path—the Geodesic —between current price action and institutional liquidity targets. The system views the market as a physical landscape where price is naturally drawn toward massive pools of liquidity (Stops). It uses two primary calculati
UZFX {SSS} スキャルピング・スマートシグナル MT5 は、変動の激しい市場で正確かつリアルタイムのシグナルを求めるスキャルパー、デイトレーダー、スイングトレーダー向けに設計された、再描画しない高性能取引指標です。(UZFX-LABS) によって開発されたこの指標は、価格行動分析、トレンド確認、スマートフィルタリングを組み合わせて、全ての通貨ペアと時間枠で高確率の売買シグナルを生成します。 主な機能 スマートシグナル検出 – 強力なトレンド反転と継続パターンを正確に識別。 マルチタイムフレーム・スキャルピング – 全タイムフレームで完璧に動作。 カスタマイズ可能なアラート – 全シグナルに対しポップアップ、メール、モバイル通知を取得(設定可能)。 明確な視覚的矢印 – チャート上で見やすい青(買い)と赤(売り)の矢印を表示。 適応型シグナル強度 – 短期・中期・長期取引向けにシグナル強度を調整可能。 ユーザーフレンドリーなインターフェース – リペインティングやシグナル遅延のないクリーンなチャート表示。 動作原理 UZFX SSSインジケーターは価格行動をスキャンし以下を検
note: this indicator is for METATRADER4, if you want the version for METATRADER5 this is the link:  https://www.mql5.com/it/market/product/108106 TRENDMAESTRO ver 2.5 TRENDMAESTRO recognizes a new TREND from the start, he never makes mistakes. The certainty of identifying a new TREND is priceless. DESCRIPTION TRENDMAESTRO identifies a new TREND in the bud, this indicator examines the volatility, volumes and momentum to identify the moment in which there is an explosion of one or more of these da
UZFX SWS {スキャルピング・ウィニング・シグナルズ} Pro v1.0 は、Usman Zabir(UZFX LABS)が開発した強力なノンリペインティング指標です。急変する市場で正確なエントリーシグナルを求めるスキャルパー、デイトレーダー、スイングトレーダー向けに特別に設計されています。遅延や誤った再描画のない、信頼性の高いリアルタイムシグナルを求めるトレーダーに最適です。 私のおすすめ* 最適時間枠:30分以上。 {1時間} が私のお気に入りです。そして結果は驚くべきもの...! 主な機能: 直近および過去のシグナルを明確な視覚的矢印で表示(古いシグナルを点で表示するオプション付き)。 取引ラインの自動計算・描画:エントリー、ストップロス(直近のスイングロー/ハイに基づく)、複数テイクプロフィットレベル(RRR 1:1、2:1、3.5:1 – 完全カスタマイズ可能)。 最新シグナル詳細、エントリー価格、SL、TPレベルを表示するチャート上情報パネル。 包括的アラート:ポップアップ、サウンド、プッシュ通知、メール。 チャートカスタマイズオプション(色、背景、ローソク足ス
Weis Wave with Alert MT5
Trade The Volume Waves Single Member P.C.
4.94 (17)
Rental/Lifetime Package Options and Privileges  Rent Monthly Six Months   Yearly/Lifetime Weis Wave with Speed with Alert+Speed Index x x x Manual  x x x Quick Set up Video x x x Blog x x x Lifetime Updates x x x Setup and Training Material x x Discord Access Channel "The SI traders"          x Rectangle Break Alert Tool      x How to trade with it:    http://www.tradethevolumewaves.com   ** If you purchase please contact me to setup your  : Training Room and  complete manual access.  Wei
1. Tool Description The   Dynamic Liquidity HeatMap Profile   is an advanced technical indicator originally designed by BigBeluga (Pine Script) and ported to MQL5. Unlike a standard Volume Profile which shows where volume   has   occurred, this tool attempts to visualize where liquidity (limit orders and stop losses) is   likely waiting   (resting liquidity). It works by identifying pivots (local highs and lows) weighted by volume and ATR.   Crucially, if price moves through a level, that liquid
MetaForecast M5
Vahidreza Heidar Gholami
5 (3)
MetaForecastは、価格データのハーモニクスに基づいて、どんな市場の未来を予測し視覚化します。市場が常に予測可能ではありませんが、価格にパターンがある場合、MetaForecastは可能な限り正確な未来を予測できます。他の類似製品と比較して、MetaForecastは市場のトレンドを分析することでより正確な結果を生成することができます。 入力パラメータ Past size (過去のサイズ) MetaForecastが将来の予測を生成するために使用するバーの数を指定します。モデルは選択したバー上に描かれた黄色の線で表されます。 Future size (将来のサイズ) 予測すべき将来のバーの数を指定します。予測された将来は、ピンクの線で表示され、その上に青い回帰線が描かれます。 Degree (程度) この入力は、MetaForecastが市場で行う分析のレベルを決定します。 Degree 説明  0 Degree 0の場合、価格の全てのピークや谷、そして詳細をカバーするために、「Past size」の入力に大きな値を使用することが推奨されています。  1 (推奨) Degre
Introduction to X3 Chart Pattern Scanner X3 Cherart Pattern Scanner is the non-repainting and non-lagging indicator detecting X3 chart patterns including Harmonic pattern, Elliott Wave pattern, X3 patterns, and Japanese Candlestick patterns. Historical patterns match with signal patterns. Hence, you can readily develop the solid trading strategy in your chart. More importantly, this superb pattern scanner can detect the optimal pattern of its kind. In addition, you can switch on and off individu
Rtc ML Ai | Predictor CORE MACHINE LEARNING ENGINE Adaptive ML Market Predictor – Multi-Bar Trend & Candle Forecast What This Indicator Does This indicator is a  real-time market prediction engine  designed to analyze price behavior and estimate  future market tendencies . Unlike conventional indicators, this system  does not rely on static parameters or historical curve-fitting , but adapts its internal state dynamically during live market operation. Instead of using static rules, the indic
Jita Indicator Pro MT5 | All Timeframes Professional Trend Agreement System – Premium Edition ($500) What Is Jita Indicator Pro? Jita Indicator Pro is a structured trend-confirmation system designed for serious traders who value precision, alignment, and controlled signal behavior. It combines: Advanced band-based trend direction logic ATR-driven structural trigger engine Dual-confirmation agreement system Locked history update design This indicator prints signals only when multiple conditions
TPA True Price Action indicator reveals the true price action of the market makers through 100% non-repainting signals strictly at the close of a candle! TPA shows entries and re-entries, every time the bulls are definitely stronger than the bears and vice versa. Not to confuse with red/green candles. The shift of power gets confirmed at the earliest stage and is ONE exit strategy of several. There are available now two free parts of the TPA User Guide for our customers. The first "The Basics"
Recommended TimeFrame >= H1. 100% Non Repainted at any moment.  Use it carefully, only with Trend Direction. Trading Usage: 2 Variants: as Range System or as BreakOut System (Both Only With Trend Direction)::: (Always use StopLoss for minimise Risk); [1] as Range System: (Recommended) in UP TREND:  - BUY in Blue Line , then if price goes down by 50 points (on H1) open Second BUY.   Close in any Profit you wish: TrailingStop(45 points) or Close when Price touches upper Gold Line. in DOWN TREND
作者のその他のプロダクト
IA Trendx3 PRO
Marco Aurelio Santos Costa
What if God Created a Trade System? No miracles... Just see how mathematics can be effective in the market. We managed to combine technical analysis / price action into indicators, creating the best setup for trading, be it in Forex, Indices, or stocks. It took us 2 years to create something that really works, and now it's time for you to discover it. TrendX3 is a revolution in trend analysis. Based on advanced algorithms and real-time data, it provides valuable insights so that you can make inf
Cls PRO
Marco Aurelio Santos Costa
With CLS you WILL NOT LOSE, as long as you have a professional capital management. It is impossible to make a loss with CLS, why?  It works by buying and selling two positively correlated currency pairs. This means that when PAR 1 goes up PAR 2 also goes up, however, there is something that happens in the market that is the distortion of the price ratio. That is, when the PAR 1 rises and PAR 2 falls, that's when we enter, buying Par 2 and selling Par 1.  This seems simple but it is not, you
EQ Cutrim Theory
Marco Aurelio Santos Costa
Ronal Cutrim has been a dedicated mathematician for 14 years and has more than 10 years of experience in the financial market. The concept of the theory is simple, find imbalance between buyers and sellers. Which makes a lot of sense, because nothing goes up forever, nothing falls forever.   When you find an asset with a mathematical probability of unbalanced equilibrium, it is a great way to get into trading:  TUTORIAL: Turn on the subtitles, the video is subtitled
In a simple and practical way, you can better manage your trades by choosing the number of lots you want to close directly at market. This feature helps reduce your risk exposure and make partial sales, protecting profits and balancing your position with more control. With just one button, simply choose the number of lots. Select the order you want to close. Done, your risk is reduced!
フィルタ:
felipevar
19
felipevar 2021.07.20 01:37 
 

Boa tarde. Acabei de assinar a sua ferramenta PACX3. Gostaria de saber como faço para adquirir os histogramas, e os PDFs da explicação, junto com os valores que tem que mudar nas configurações? Obrigado.

Juliano Pacheco
91
Juliano Pacheco 2021.04.05 20:45 
 

Excelente para operações curtas ou seguindo uma tendência de curto prazo. Um dos melhores indicadores que já comprei na comunidade...

Marcus Ataide
250
Marcus Ataide 2021.03.05 18:10 
 

Really good indicator, gives you not only the signals but also the zone trending, so you will reduce your risk a lot. Thanks!

freddo13542
139
freddo13542 2021.03.02 12:12 
 

I have had a good number of trades, all winning so far between 5-20pips depending on the volatility of the pair. Very good looking indicator, still getting used to the feeling of it and when to step back from it for a couple hours when no signals are close.

Alfred Charano
1842
Alfred Charano 2021.02.26 04:41 
 

It's amazing system .. never seen before on the market, trade when the market open when it moves fast .. very good for scalping 20-30 pips is very easy with this system .. look for entries before the market open .. browse all pairs available .. trade only when all charts on the same direction .. winning rate 80% but you need to be patient waiting for that entries ..i use it on Asian & London Open .. please make MT4 version .. thank you

guibra55
19
guibra55 2021.01.21 21:16 
 

Estou usando e uma coisa que percebi foi que o indicador tira o nervosismo de operar... Tudo parece ficar mt mais claro, é muito bom, parabéns pelo trabalho!

OM2019
49
OM2019 2021.01.18 12:48 
 

ユーザーは評価に対して何もコメントを残しませんでした

レビューに返信