BOOM and CRASH Ultimate Soft

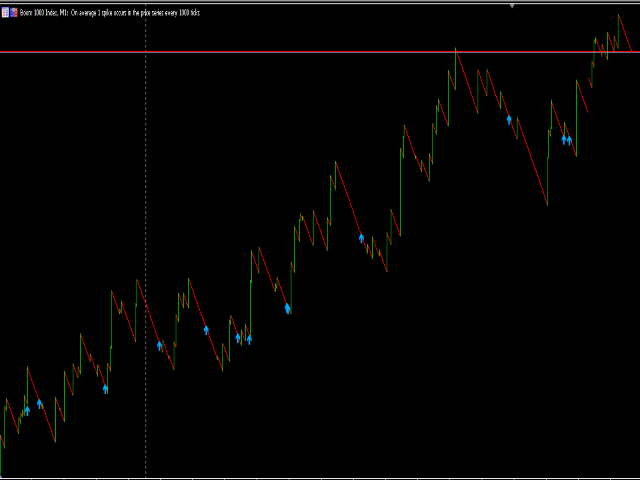
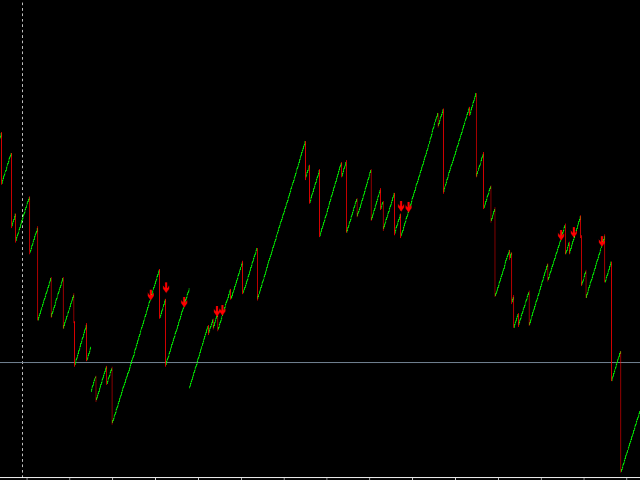
This indicator is a scalping indicator intended solely for the Boom and Crash indices of the Deriv Limited market

It supports Boom 500, Boom 1000, Crash 500 and Crash 1000

Not repaint and no bug

The settings are intuitive and easy to use

The product activation number is 20

The Time Frame used depends on the user

If you are an aggressive scalper then just use M1

For long trades use M15

If you are conservative use M5

Please contact me for more details of its use

おすすめのプロダクト
Our BOOM SELL ALERT indicator is specifically engineered to   take candles on BOOM 1000 , BOOM 500 is tool is optimized for M1 (1-minute) timeframe, ensuring you receive timely and actionable insights.   The indicator is a combination of   many indicators. -        AO Oscillator -        Stochastic   HOW TO USE THIS INDICATOR To use well this indicator , it   need to use SCHAFF TREND RSX ( 5 MIN OR M5) IF SCHAFF trend RSX is GREEN and you have a signal then SELL when you have ENTRY and out with
Rivoluziona il Tuo Trading con l'Indicatore di Segnali Scalping su Timeframe Multipli   Scopri il segreto del successo nel trading con il nostro esclusivo indicatore di SEGNALI scalping su timeframe multipli. Questo strumento avanzato è progettato per trovare segnali efficienti e precisi, aiutandoti a massimizzare i profitti e a ridurre i rischi associati al trading veloce L'indicatore di segnali Alien Scalper MTF è uno strumento di analisi tecnica altamente efficace, progettato per identificare
Ing (inguz,ingwar) - the 23rd rune of the elder Futhark ᛝ, Unicode+16DD. Add some runic magic to your trading strategies. The correct marking of the daily chart will indicate to you the successful moments for counter-trend trading. Simple to use, has high efficiency in volatile areas. Be careful in lateral movements. Signals ᛝ are generated when the main lines of construction intersect. Red arrow down - recommended sales Blue up arrow - recommended purchases rare purple arrows indicate exce
Intraday Session TPO: Precision Volume Profiling for Day Traders Stop trading blind during the most volatile hours of the day. Standard daily volume profiles blend everything together, masking the true areas of liquidity and institutional interest. The Intraday Session TPO is engineered specifically for session-to-session traders. It empowers you to isolate and profile specific time windows—like the London Open, the New York Killzone, or the Asian range—so you can see exactly where the volume is
FULL TREND KILLER is an indicator based on Bollingen Bands and it is easy to use; no internal adjustments to be made. It is specially designed for synthetic indices but also works well on Forex Assets. The best time frame to use on synthetic indices is M15, this is just a tip, however it can be used on all time frames. Settings : BANDS PERIOD Push Notification Email Notification Audible Alert
This Volume Delta Profile is an advanced MetaTrader 5 indicator that visualizes   volume delta (order flow imbalance)   using a volume profile-style histogram. It shows the difference between buying and selling pressure at specific price levels, helping traders identify supply and demand zones. This indicator provides a unique perspective on market dynamics by visualizing the imbalance between buying and selling pressure, offering insights beyond traditional volume analysis. Core Concept Positiv
Dyne
Fernando Souza Mendes
This isn't just an indicator; it's a top-tier market analysis tool that combines the power of various technical analysis techniques into one package. Perfect for traders seeking precision and clarity in their trading decisions. Key Features: HiLo Activator: Easily capture the essence of market trends. This component differentiates between bullish or bearish markets, helping you to be on the right side of the move. MACD (Moving Average Convergence Divergence): Quickly identify changes in market
FFx Universal Strength Meter PRO is more than a basic strength meter. Instead of limiting the calculation to price, it can be based on any of the 19 integrated strength modes + 9 timeframes. With the FFx USM, you are able to define any period for any combination of timeframes. For example, you can set the dashboard for the last 10 candles for M15-H1-H4… Full flexibility! Very easy to interpret... It gives a great idea about which currency is weak and which is strong, so you can find the best pai
Rolling vwap atr market panel
Florian Alain Bernard Jean-paul Pierre Cuiset
Rolling VWAP + ATR Bands + Market Panel — powerful visual tool for scalping, extensions detection and intraday market structure analysis. Rolling VWAP + Panel Rolling VWAP + Panel is a professional MetaTrader 5 indicator designed to analyze market structure using a Rolling Volume Weighted Average Price (VWAP) combined with ATR-based volatility bands , a real-time market analysis panel , and an integrated candle countdown timer . This indicator provides a clear and structured view of price beha
FREE
Weighted average price indicator or VWAP. The well-known standard VWAP with the beginning of the day is added with the function of selecting the periodization. It can be calculated both every day and on other periods. Also the indicator allows to exclude the volume from the calculation, which will allow using it on the cryptocurrencies and forex. There is an alert for a VWAP price crossing. There are 1 and 2 standard deviation. Settings: Volume: turning volume on and off in the calculation mecha
Introducing to your attention the unique trading system/indicator "Scaled Vidya Trends", designed for dynamic scalp trading on trend volatility pairs hour + timeframes. Main features of Scaled Vidya Trends: -Multi-level market analysis: it works on H1, H2, H3 timeframes; -Uses the most popular currency pairs: EURUSD, GBPUSD, USDCAD. Brokers usually set one of the lowest spreads for these pairs; -Applies a scalping method based on local targets for signals; -Signals appears at the new open of
Equinox Gold
Dmitriq Evgenoeviz Ko
Equinox Gold is a high-tech trading expert advisor (EA) specifically designed for the gold market ( XAUUSD ). The system is based on a unique Market Equilibrium algorithm that identifies areas of imbalance between supply and demand during extreme volatility. Unlike most robots that use dangerous sit-and-wait methods, Equinox Gold relies on mathematical momentum confirmation and strict risk control for every trade. MAIN ADVANTAGES VRP Filter (Volatility Range Filter): The robot automatically ada
StratoTrader FX
Jasser Bin Munir Bin Ayyad Bandakhil
Attach to Chart Open   MetaTrader 5   → Select a Forex pair (e.g., EURUSD). Drag & drop the EA onto the chart. Input Parameters   (Customizable) FastMA_Period   (Default: 10) SlowMA_Period   (Default: 20) LotSize   (Default: 0.1) StopLoss_Pips   (Default: 50) TakeProfit_Pips   (Default: 100) MagicNumber   (Unique ID for trades) Optimization (Optional) Test in   Strategy Tester   (Backtest & Forward Test). Adjust MA periods, SL/TP, and lot size for better results. Risk Management Start with   sm
インディケータは現在のクオートを作成し、これを過去のものと比較して、これに基づいて価格変動予測を行います。インジケータには、目的の日付にすばやく移動するためのテキスト フィールドがあります。 オプション: シンボル - インジケーターが表示するシンボルの選択; SymbolPeriod - 指標がデータを取る期間の選択; IndicatorColor - インジケータの色; HorisontalShift - 指定されたバー数だけインディケータによって描画されたクオートのシフト; Inverse - true は引用符を逆にします。false - 元のビュー。 ChartVerticalShiftStep - チャートを垂直方向にシフトします (キーボードの上下矢印)。 次は日付を入力できるテキストフィールドの設定で、「Enter」を押すとすぐにジャンプできます。
Gecko EA MT5
Profalgo Limited
5 (1)
NEW PROMO: Only a few copies copies available at 349$ Next price: 449$ Make sure to check out our " Ultimate EA combo package " in our   promo blog ! Gecko runs a simple, yet very effective, proven strategy.  It looks for important recent support and resistance levels and will trade the breakouts.  This is a "real" trading system, which means it will use a SL to protect the account.  It also means it will not use any dangerous techniques like martingale, grid or averaging down. The EA shows its
Arrow Micro Scalper は、スキャルピングと短期取引用に設計されたインジケーターで、あらゆるチャートや金融商品 (通貨、仮想通貨、株式、金属) に統合されています。 彼女は仕事で波動分析とトレンド方向フィルターを使用しています。 M1 から H4 までのタイムフレームでの使用が推奨されます。 インジケーターの操作方法。 インジケーターには設定を変更するための 2 つの外部パラメーターが含まれており、残りはデフォルトですでに構成されています。 大きな矢印はトレンド方向の変化を示し、青い矢印は下降トレンドの始まりを、ピンクの矢印は上昇トレンドの始まりを示します。 「 Only trending direction 」パラメータは、内部トレンドを使用するモードを有効または無効にし、独自のトレンドを使用するか、トレンドを使用せずに作業する機会を提供します。また、トレンド矢印とシグナルのみのトレンド矢印の表示を有効または無効にします。 小さなシグナル矢印、インジケーターの最も重要なオブジェクト、ピンクは「買い」トランザクション、青は「売り」トランザクション。 「 Smooth
VarMomentPulse is a unique manual trading algorithm developed with precision and flexibility in mind, based on an extensive historical data cluster.  Its operation is grounded in the principles of analyzing crossovers between normalized moving averages and dispersions across various time intervals, enabling it to uncover new opportunities in evaluating market trends. Key Features of the VarMomentPulse Indicator: Adaptability to Volatility:The use of price dispersion analysis allows VarMomentPul
MT5 Session Indicator: Track Global Market Hours with Precision Boost your trading strategy with this FREE Session Indicator for MetaTrader 5 , designed to help you effortlessly identify active trading sessions across global markets. Perfect for forex, stocks, and commodities traders, this tool highlights key market hours (Asian, European, North American, and overlaps) directly on your chart, ensuring you never miss high-liquidity periods. Key Features: Visual Session Overlays : Clear color-c
FREE
Quarterly Theory SSMT Indicator Overview The Quarterly Theory SSMT Indicator is a cutting-edge MetaTrader 5 tool that revolutionizes trading by fusing advanced divergence detection with quarterly cycle visualization. Tailored for forex, crypto, and indices traders seeking institutional-edge insights, it pinpoints high-probability reversal opportunities using the Sequential Smart Money Technique (SSMT)—a sophisticated evolution of traditional Smart Money Concepts. Unlike standard SMT, this seque
Was: $249  Now: $99   Market Profile defines a number of day types that can help the trader to determine market behaviour. A key feature is the Value Area, representing the range of price action where 70% of trading took place. Understanding the Value Area can give traders valuable insight into market direction and establish the higher odds trade. It is an excellent addition to any system you may be using. Inspired by Jim Dalton’s book “Mind Over Markets”, this indicator is designed to suit the
Quantum Levels PRO — 価格の行き先を、到達する前に知る MT5 ノーリペイント価格ターゲットインジケーター | バージョン 3.10 インジケーターの90%が抱える問題: すでに起こったこと しか表示しません。移動平均、RSI、MACD——これらは過去のデータを分析し、値動きが終わった 後 に反応します。シグナルが出る頃には、最適なエントリーポイントは過ぎ去っています。 Quantum Levels PROは違います。 値動きがまだ進行中の段階で、価格が次に向かう具体的な水準——正確な価格ターゲットを算出します。旅が終わる前に目的地が見えます。これは後知恵ではなく、先見性です。 Quantum Levels PROの機能 あらゆる銘柄——株式、FX、暗号資産、コモディティ、指数——のスイング構造を分析し、4つの精密な価格ターゲットを算出します: UP Trend Target ——最大上昇水準。ロングの利確目標、またはショートの反転エントリー。 UP Correction Target ——最小上昇水準、保守的な上昇目標。ロングの部分決済ゾーン。 DOWN Tren
Trade Extender
Loncey Duwarkah
5 (1)
Autonomously executes trades, overseeing the entire process from initiation to completion.  Free support via chat, email and remote assistance Originally built for XAUUSD (Gold). Settings changes for other symbols Powerful rules management Enhanced positioning features Risk Management / Dynamic lot sizing Quick Setup Symbols : XAUUSD Investment for all: Our trading bot is crafted to serve traders of all investment levels, ensuring accessibility to the forex market even for those with limited fu
Ignition
Dansie Software Limited
Strategy Overview The Ignition EA tries to take advantage of sudden momentum when the Ignition pattern is detected. The final bar in the ignition pattern has a small opening wick, a very little or no closing wick, is large in comparison to recent bars and must start from the lower end of the current range (for a bullish ignition) Quick Testing Use Symbol EURUSD, Timeframe M2, and remove the GBPUSD symbol from the "Symbols" input (stratergy 1 and stratergy 2) Settings The below settings appe
"Blow It Up!" – The Trading Indicator That Questions Your Life Choices Tired of boring indicators? Meet your new market companion that delivers:   "YOLO BUY!" arrows   when you should probably panic   Explosive rectangle confetti   (because why not?)   200+ soul-crushing quotes   like   "Your stop loss is imaginary"   and   "This isn’t trading, it’s donating to whales"   Random alerts that roast your strategy This Indicator is like Therapy   – Because daytrading shouldn’t feel
Range Directional Force Indicator – Designed for You to Optimize! The Range Directional Force Indicator is a cutting-edge tool designed to empower traders by visualizing market dynamics and directional strength. Built to offer insights into market trends and reversals, this indicator is an invaluable asset for traders seeking precision in their strategies. However, it is important to note that this indicator is not optimized, leaving room for you to tailor it to your unique trading preferences.
Gold Venamax - これは最高の株式テクニカル指標です。 指標アルゴリズムは資産の価格変動を分析し、ボラティリティと潜在的なエントリーゾーンを反映します。 インジケーターの機能: これは、快適で収益性の高い取引のためのマジックとトレンド矢印の 2 つのブロックを備えたスーパー インジケーターです。 チャート上にブロックを切り替えるための赤いボタンが表示されます。 マジックはインジケーター設定で設定されているため、異なるブロックを表示する 2 つのチャートにインジケーターをインストールできます。 Gold Venamax は、異なる矢印バッファー (GV と SD) を備えた 2 つのチャートに配置できます。 これを行うには、設定で異なる Magic を選択する必要があります。たとえば、あるマジック = 999、別のマジック = 666 を選択します。次に、チャート上の赤いボタンで矢印バッファを選択できます。 インジケーター設定の各矢印バッファー (GV および SD) には、快適で収益性の高い取引のための個別の矢印フィルターがあります (UseFiltrGV = true;
Ultimate Boom and Crash Indicator The Ultimate Boom and Crash Indicator is a cutting-edge tool developed by  Coetsee Digital , designed to identify potential spike opportunities in the market. Crafted for traders focusing on Deriv and Weltrade synthetic markets, this indicator is optimized to operate exclusively on the 3-minute (M3), 5-minute (M5), 15-minute (M15), 30-minute (M30), and 1-hour (H1) timeframes and supports only the following pairs: PainX 1200, PainX 999, PainX 800, PainX 600, Pai
KingTrend — Price Action Trend Analysis Tool KingTrend is a trend-following indicator based on long-standing price action principles involving Highs, Lows, Open, and Close. The logic behind this tool comes from concepts passed on to me by my mentor and translated into code for consistent structure recognition. Features: Identifies market structure using price action logic Detects trend direction and key turning points Marks Higher Highs, Lower Lows, and extensions Suitable for discretionary or
Advanced Trading Chaos  The main purpose of the indicator is to help the trader detect the signals described by Bill Williams in his books to make a quick and correct trading decision. 1)Bullish/Bearish Reversal Bar(BDB) 2) Divergent Bar(DB) 3) Second Sage Signal — the third consecutive Awesome Oscillator bar  4) Working fractals (Fractals that worked above/below the red forehead  5) Three bar coloring modes 5.1) Coloring of bars according to the AO indicator (Including the squatting bar) 5.2
このプロダクトを購入した人は以下も購入しています
ARICoin is a powerful trading companion designed to generate high-probability entry signals with dynamic TP/SL/DP levels based on volatility. Built-in performance tracking shows win/loss stats, PP1/PP2 hits, and success rates all updated live. Key Features: Buy/Sell signals with adaptive volatility bands Real-time TP/SL/DP levels based on ATR Built-in MA Filter with optional ATR/StdDev volatility Performance stats panel (Success, Profit/Loss, PP1/PP2) Alerts via popup, sound, push, or email Cust
AriX
Temirlan Kdyrkhan
1 (4)
AriX Indicator for MT5 A powerful trend-following and signal-evaluation tool AriX is a custom MT5 indicator that combines Moving Averages and ATR-based risk/reward logic to generate clear buy/sell signals. It visualizes dynamic SL/TP levels, evaluates past trade outcomes, and displays win/loss statistics in a clean on-chart panel. Key features include: Buy/Sell signals based on MA crossovers ATR-based SL/TP1/TP2/TP3 levels with visual lines and labels Signal outcome tracking with real-time stat
中国天機グローバル市場状態解析システムは、あらゆる銘柄とあらゆる時間足で使用できる MT5 用の市場状態分析インジケーターです。現在の相場がレンジなのかトレンドなのかを見極め、どの価格帯に注目すべきか、どの価格帯が魅力的に見えても実際にはリスクが高いのかを判断する助けになります。 中国天機グローバル市場状態解析システムは、市場の状態、価格構造、方向変化をより明確に理解するために設計された分析型インジケーターシステムです。単純な買いシグナルや売りシグナルだけを出すためのものではありません。現在の相場がレンジなのかトレンドなのか、そして今の価格帯がチャンスに近いのか、それともリスクに近いのかを、よりはっきり理解するためのものです。 多くのトレーダーは毎日同じような疑問を抱えています。相場はすでに下落した。この位置で反発するのか。今買うべきなのか。ここは本当の安値なのか、それとも偽の安値なのか。この反発のあと、相場はさらに下がるのか。今がレンジ相場なら、どこが買いに適した位置で、どこが売りに適した位置なのか。今がトレンド相場なら、どの価格帯が本当の安値に近く、どの価格帯が安く見えるだけで実際
Recommended TimeFrame >= H1. 100% Non Repainted at any moment.  Use it carefully, only with Trend Direction. Trading Usage: 2 Variants: as Range System or as BreakOut System (Both Only With Trend Direction)::: (Always use StopLoss for minimise Risk); [1] as Range System: (Recommended) in UP TREND:  - BUY in Blue Line , then if price goes down by 50 points (on H1) open Second BUY.   Close in any Profit you wish: TrailingStop(45 points) or Close when Price touches upper Gold Line. in DOWN TREND
Классификатор силы тренда. Показания на истории не меняет. Изменяется классификация только незакрытого бара. По идее подобен полной системе ASCTrend, сигнальный модуль которой, точнее его аппроксимация в несколько "урезанном" виде, есть в свободном доступе, а также в терминале как сигнальный индикатор SilverTrend . Точной копией системы ASCTrend не является. Работает на всех инструментах и всех временных диапазонах. Индикатор использует несколько некоррелируемых между собой алгоритмов для класси
The FFx Universal MTF alerter shows on a single chart all the timeframes (M1 to Monthly) with their own status for the chosen indicator. 9 indicators mode (MACD-RSI-Stochastic-MA-ADX-Ichimoku-Candles-CCI-PSAR). Each can be applied multiple times on the same chart with different settings. Very easy to interpret. Confirm your BUY entries when most of the timeframes are showing green color. And confirm your SELL entries when most of the timeframes are showing red color. 2 Alert Options : input to s
The FFx Watcher PRO is a dashboard displaying on a single chart the current direction of up to 15 standard indicators and up to 21 timeframes. It has 2 different modes: Watcher mode: Multi Indicators User is able to select up to 15 indicators to be displayed User is able to select up to 21 timeframes to be displayed Watcher mode: Multi Pairs User is able to select any number of pairs/symbols User is able to select up to 21 timeframes to be displayed This mode uses one of the standard indicators
FFx Patterns Alerter gives trade suggestions with Entry, Target 1, Target 2 and StopLoss .... for any of the selected patterns (PinBar, Engulfing, InsideBar, OutsideBar) Below are the different options available: Multiple instances can be applied on the same chart to monitor different patterns Entry suggestion - pips to be added over the break for the entry 3 different options to calculate the SL - by pips, by ATR multiplier or at the pattern High/Low 3 different options to calculate the 2 TPs -
MetaTrader 4 version available here : https://www.mql5.com/en/market/product/24881 FFx Basket Scanner is a global tool scanning all pairs and all timeframes over up to five indicators among the 16 available. You will clearly see which currencies to avoid trading and which ones to focus on. Once a currency goes into an extreme zone (e.g. 20/80%), you can trade the whole basket with great confidence. Another way to use it is to look at two currencies (weak vs strong) to find the best single pairs
MetaTrader 4 version available here: https://www.mql5.com/en/market/product/25793 FFx Pivot SR Suite PRO is a complete suite for support and resistance levels. Support and Resistance are the most used levels in all kinds of trading. Can be used to find reversal trend, to set targets and stop, etc. The indicator is fully flexible directly from the chart 4 periods to choose for the calculation: 4Hours, Daily, Weekly and Monthly 4 formulas to choose for the calculation: Classic, Camarilla, Fibonac
This indicator is based on the crossing of two Moving Average with the RSI It is intended for scalpers Specially designed for Boom and Crash syhtetic indices from Binary.com/Deriv.com It is easy to use and intuitive. We recommend its use on M1 and is equipped with three types of notification Email alert Sound notification Push notification these parameters can be activated and deactivated.
Boom and Crash Spike Detector v1.0 Boom and Crash spike detector prints Down non repaint Arrow for catching crash spikes and Up non repaint arrow for catching boom spikes.  It is suitable for 1M time frame for majorly crash500 and Boom 500.  When the Red arrow prints in a red zone moving averages, it indicates high probability of crash spikes downwards, likewise, blue arrow printing in a blue zone of moving average, it indicates high probability of boom spikes.  Its pretty straight forward since
Crash500 Spike Detector v1.0 Crash500 spike detector prints Down non repaint Arrow for catching crash spikes. It is suitable for 1M time frame for majorly crash500  When the Red arrow prints, it indicates high probability of crash spikes downwards. Its pretty straight forward since I designed it to follow strong trends.  Use default settings, however, you can change the color of your chart background as may be appropriate. The system uses mathematical approach in to display statistical data inf
Magicx
Hasan Abdulhussein
The indicator places a buy or sell signal when the conditions of the strategy it was designed with are met. The strategy is guaranteed, strong, and has been tested for 9 years. The indicator is for binary options and can be converted into a bot by linking it to MT2Trading, where it sends the signal to this platform. This platform automatically opens a trade on the trading platform you are using, whether it is Pocket Option, IQ Option, or any other binary options platforms. The entry is on the n
CBT Quantum Maverick 高効率バイナリーオプション取引システム CBT Quantum Maverickは、高いパフォーマンスとシンプルさを追求するトレーダー向けに設計されたバイナリーオプション取引システムです。カスタマイズの必要がなく、最適化された状態で使用を開始できます。シグナルに従うだけで、少しの練習でマスターできます。 主な特徴: シグナルの精度: 現在のローソク足を基に次のローソク足の取引シグナルを生成し、頻繁な再描画がありません。 多様な市場対応: バイナリーオプション取引に特化し、さまざまなブローカーや資産クラスに対応しています。 対応可能: Deriv Synthetic Charts :すべてのタイムフレームで使用可能。 OTCチャート :Quotex、PocketOption、Binomo、Stockity、IQOption、Exnova、OlympTrade、Deriv、Binolla、Homebrokerなどのブローカーに対応。MT5へのインポートは最初の1週間無料、その後は有料サービス。 FX、仮想通貨、商品市場 :幅広い資産利用が可能
This strategy focuses on identifying and following clear market trends by filtering out noise and short-term fluctuations. Using advanced algorithms, it highlights significant upward and downward movements, enabling traders to make data-driven decisions. The indicator is designed for simplicity and precision, ideal for traders who prefer a systematic approach to trend trading. Whether you're a beginner or an experienced trader, this tool helps you stay aligned with the dominant market direction
PRICE WILL BE INCREASED TO £4999 SOON! 5 or 15 MINUTE CHART ONLY: A state-of-the-art trading indicator, designed with advanced analytical and mathematical programming, delivers top-tier buy and sell signals. Simply enter a small buy position when a green arrow appears and a small sell position when a red arrow is shown. While signals from this indicator are infrequent, they boast exceptional accuracy when generated. Please apply your own stop-loss and take-profit levels as needed.
مؤشر Smart Trend Candles هو أداة فعّالة في منصة MetaTrader 4، تجمع بين عناصر تحليل فني متعددة لتحديد اتجاهات السوق وقياس قوة المشترين والبائعين. يوفر هذا المؤشر متعدد الاستخدامات إشارات مرئية واضحة تُحسّن قرارات التداول الخاصة بك. الميزات الرئيسية 1. تحديد الاتجاه يستخدم شموع Heikin-Ashi المعدلة (اختياري) لتصفية ضوضاء السوق يتضمن متوسطًا متحركًا (فترة قابلة للتكوين) لتأكيد الاتجاه تنفيذ مؤشر القوة النسبية لقياس الزخم 2. قياس القوة تشير الشموع المرمزة بالألوان إلى شدة ضغط الشراء/البيع تحليل الحج
Trend Frequency Market MT5 Carry out analysis and backtest even before opening your orders, check the strategy's Winrate and stay in favor of the Trend and the strength of the movement. The TFM indicator is specialized in providing you with the strength points of the movement, painting the candles GREEN or RED to report price aggression from the Players who are acting at the exact moment. Taking advantage of this detection, the indicator plots Arrow and Entry, Stop Loss and Take Profit levels
PRICE WILL BE INCREASED TO £4999 SOON! Knight Rider FX is a precision-engineered trading indicator that delivers highly accurate, non-repainting signals without flooding your chart. It filters out noise and selectively highlights only the highest probability trade setups. On higher timeframes, it anticipates major market reversals, while on intraday charts it pinpoints mini reversals with tactical clarity. By focusing on quality over quantity, Knight Rider FX equips traders with disciplined ent
Screens realtime-  https://t.me/ +rEuJQo8zHLllMzgy Signals.Metals.etc This tool is designed to detect anomalies in market trading activity. It analyzes price movements and volumes to identify moments of unusually strong buying or selling pressure. Such periods are often followed by a cooling phase or consolidation, providing traders with valuable reference points for decision-making.  The indicator requires no complex setup and is suitable for both experienced traders and beginners. Screensho
Screens realtime-  https://t.me/ +rEuJQo8zHLllMzgy in Signals.Metals.etc VI Calculator  is a professional MetaTrader 5 indicator that analyzing volume at the moment. This synergy allows traders to evaluate both the strength of market movements and overbought/oversold conditions at the same time. The indicator automatically processes market data and provides clear trading signals directly on the chart in the form of arrows and text recommendations. It is ideal for identifying entry and exit p
TrendCatcherBot: Find Your Edge in the Market Don't guess the trend—catch it. The TrendCatcherBot is an Expert Advisor designed for MetaTrader 5 that simplifies your trading strategy. By leveraging the power of moving average crossovers, this bot provides clear, visual signals directly on your chart, so you always know when to act. Watch for the unmistakable green, red, and black dots in the corner of your screen to instantly see if the market is signaling a buy, sell, or hold. It's the perfect
*** ### **Triple Crox Strategy - Professional Trading System** **Overview** The Triple Crox Strategy is an advanced technical indicator for MetaTrader 5, designed for serious traders. It synthesizes multiple analysis methodologies—including moving averages, Average True Range (ATR), Relative Strength Index (RSI), and cloud configurations—to generate highly reliable and precise trading signals. **Core Configuration** **Setup Types** *   **Setup Open/Close:** Utilizes Heikin Ashi can
Enigma112 PRO Multi-Confluence Trading System Version 2.13 | Copyright 2024 Issam.R Sabour --- 1. Overview Enigma112 PRO is an advanced MetaTrader 5 indicator that combines multiple technical analysis methodologies into a unified multi-confluence trading system. The indicator integrates PO3 Range analysis, Huddleston Volume Profile, Order Blocks, Fair Value Gaps, Tesla Gates digital root calculations, Pivot Points, and Multi-Timeframe trend analysis to generate high-probability trading signals.
Introducing the Ultimate Trend-Following Indicator: Precision Signals at Your Fingertips In a market saturated with "black-box" systems and cluttered, confusing charts, clarity is the ultimate advantage. Alpha Seeking Bull strips away the noise, distilling complex market analysis into a single, high-fidelity visual cue. Whether you are a seasoned day trader or just starting your journey, this indicator is engineered to provide the confidence you need to execute trades with surgical precision. Th
SuperScalp Pro — 高度なマルチフィルター対応スキャルピングインジケーターシステム SuperScalp Pro は、クラシックな Supertrend と複数のインテリジェントな確認フィルターを組み合わせた高度なスキャルピング用インジケーターシステムです。M1〜H4 のすべての時間足で効率的に機能し、特に XAUUSD、BTCUSD、および主要なFX通貨ペアに適しています。単体のシステムとして、また既存の取引戦略へ柔軟に統合して使用できます。 本インジケーターは 11 以上のフィルターを統合しており、短期・長期の EMA、トレンド判定に用いる 3 本の EMA、EMA スロープ(EMA slope)、RSI、ADX、出来高、VWAP、ボリンジャーバンドのブレイクアウト、MACD ダイバージェンスフィルターなどを含みます。スマートキャンドルフィルターはローソク足の終値を確認して弱いシグナルを排除し、3 本の EMA と MACD ダイバージェンスを組み合わせたトレンド認識メカニズムにより勝率の高いシグナルの選別を支援します。 SuperScalp Pro は ATR に基
Azimuth Pro
Ottaviano De Cicco
5 (6)
発売プロモーション Azimuth Proは先着100名様限定で 299ドル でご提供します。最終価格は 499ドル となります。 リテールとインスティテューショナルのエントリーの違いはインジケーターではなく、ロケーションにあります。 多くのトレーダーは、モメンタムを追いかけたり、遅行シグナルに反応して、任意の価格レベルでエントリーします。機関投資家は、需給が実際にシフトする構造的なレベルに価格が到達するのを待ちます。 Azimuth Proはこれらのレベルを自動的にマッピングします:スイングアンカーVWAP、マルチタイムフレーム構造ライン、高確率ロケーションにのみ出現するABCパターン。 Azimuth Proは、構造分析とインテリジェントな自動化の両方を求めるプロフェッショナルトレーダー向けに構築されています。 Azimuthが外科的精度で市場構造をマッピングする一方、Azimuth Proはインテリジェンスレイヤーを追加します:トレーディングスタイルの自動検出、スマート設定された移動平均線、20年のデータでバックテストされた最適化パラメータ。その結果、お使いの銘柄と
このインジケーターを購入された方には、以下の特典を 無料 で提供しています: 各トレードを自動で管理し、ストップロスとテイクプロフィットを設定し、戦略ルールに基づいてポジションを決済する補助ツール 「Bomber Utility」 様々な銘柄に合わせたインジケーターの設定ファイル(セットファイル) 「最小リスク」、「バランスリスク」、「待機戦略」 の3つのモードで使用できる Bomber Utility 用の設定ファイル このトレーディング戦略をすぐに導入・設定・開始できる ステップバイステップのビデオマニュアル ご注意: 上記の特典を受け取るには、MQL5のプライベートメッセージシステムを通じて販売者にご連絡ください。 オリジナルのカスタムインジケーター 「Divergence Bomber(ダイバージェンス・ボンバー)」 をご紹介します。これは、MACDのダイバージェンス(乖離)戦略に基づいた 「オールインワン」型のトレーディングシステム です。 このテクニカルインジケーターの主な目的は、価格とMACDインジケーターの間に発生するダイバージェンスを検出 し、将来の価格の動きを示す
Entry In The Zone and SMC Multi Timeframe is a real-time market analysis tool developed based on Smart Money Concepts (SMC). It is designed to analyze market structure, price direction, reversal points, and key zones across multiple timeframes in a systematic way. The system displays Points of Interest (POI) and real-time No Repaint signals, with instant alerts when price reaches key zones or when signals occur within those zones. It functions as both an Indicator and a Signal System (2-in-1), c
作者のその他のプロダクト
the indicator will show signal arrows on the graph at the crossing of a given level it has push and audible alerts. By crossing from low to high level 0.3, a blue arrow will come out for the purchase, at the same time an audible signal will sound. By crossing from low to high level 0.7, a red arrow will come out for the sale, at the same time an audible signal will sound. Possibility to deactivate push and audible alerts. MT5 version :  https://www.mql5.com/en/market/product/51968
This Expert Advisor must be placed on a second graph; placing on a second chart it will automatically modify your orders placed without StopLoss and TakeProfit. Editable parameter; updates will be available shortly to improve its efficiency. It only has two editable entries in its parameter: (Stoploss and Takeprofit). A trailing stop function will soon be added to it.
Colored candlesticks showing the trend based on two moving averages and the slope of the slow moving average. For long term trends use Period2 = 200. Convenient to filter trends according to your trading strategy The time unit also depends on your trading style Gives you a signal for each trend, displayed on the screen coloring the candlesticks. No sound signal; no push notification; these functions will be there in the next updates
the indicator will show signal arrows on the graph at the crossing two EMA it has push and audible alerts. By crossing above each others , a blue arrow will come out for the BUY, at the same time an audible signal will sound. By crossing Below each others, a red arrow will come out for the SELL, at the same time an audible signal will sound. Possibility to deactivate push and audible alerts.
the indicator will show signal arrows on the graph at the crossing of Awesome Oscillator base level it has push and audible alerts and Email alert. By crossing above base level , a blue arrow will come out for the BUY, at the same time an audible signal will sound. By crossing Below base level, a red arrow will come out for the SELL, at the same time an audible signal will sound. Possibility to deactivate push and audible alerts. MT5 version :  Buy the 'Awesome cross MT5' Technical Indicator fo
the indicator will show signal arrows on the graph at the crossing of MACD level it has push and audible alerts. By crossing from low to high level 0, a blue arrow will come out for the BUY, at the same time an audible signal will sound. By crossing from low to high level 0, a red arrow will come out for the SELL, at the same time an audible signal will sound. Possibility to deactivate push and audible alerts. MT5 :  Buy the 'MACD Arrow' Technical Indicator for MetaTrader 5 in MetaTrader Marke
the indicator will show signal arrows on the graph at the crossing of a given level it has push and audible alerts. By crossing from low to high level 0.3, a blue arrow will come out for the purchase, at the same time an audible signal will sound. By crossing from low to high level 0.7, a red arrow will come out for the sale, at the same time an audible signal will sound. Possibility to deactivate push and audible alerts. MT4 version of this product here
ichimoku indicator with alert; audible alert, email alert, push alert you can enable or disable the settings as you wish When there is a crossing of tenkansen and kijun you will get an alert When there is a cross between Senkouspan A and Senkouspan B you will get an alert Affordable sound settings possibility to modify the parameters of the ichimoku indicator
this indicator is a Spike detector indicator, it is specially designed to trade Boom 1000, Boom 500, Crash 1000 and Crash 500 We recommend using it on Deriv Boom and Crash indices only Its setting is intuitive, familiar, easy to use it has notification functions; audible notifications and push notifications. this tool is simple to use, easy to handle This update is based on different strategies for spikes
FULL TREND KILLER is an indicator based on Bollingen Bands and it is easy to use; no internal adjustments to be made. It is specially designed for synthetic indices but also works well on Forex Assets. The best time frame to use on synthetic indices is M15, this is just a tip, however it can be used on all time frames. Settings : BANDS PERIOD Push Notification Email Notification Audible Alert
RSI Arrow1 is an arrow indicator based on the RSI, is easy to use; no internal adjustments to be made. the user can change the indicator period as desired in the settings. It can be used on all markets but it will all depend on your Trade strategy. There is no better Time Frame for its use; the use will depend on the Trader himself. Settings: RSI Period Push Notification Email Notification Audible Alert Down levels Up levels
This indicator is based on the crossing of two Moving Average with the RSI It is intended for scalpers Specially designed for Boom and Crash syhtetic indices from Binary.com/Deriv.com It is easy to use and intuitive. We recommend its use on M1 and is equipped with three types of notification Email alert Sound notification Push notification these parameters can be activated and deactivated.
the indicator will show signal arrows on the graph at the crossing of Awesome Oscillator base level it has push and audible alerts and Email alert. By crossing above base level , a blue arrow will come out for the BUY, at the same time an audible signal will sound. By crossing Below base level, a red arrow will come out for the SELL, at the same time an audible signal will sound. Possibility to deactivate push and audible alerts. MT4 version :  Buy the 'Awesome cross' Technical Indicator for M
フィルタ:
レビューなし
レビューに返信