Awesome cross MT5
- インディケータ
- バージョン: 1.0
- アクティベーション: 5

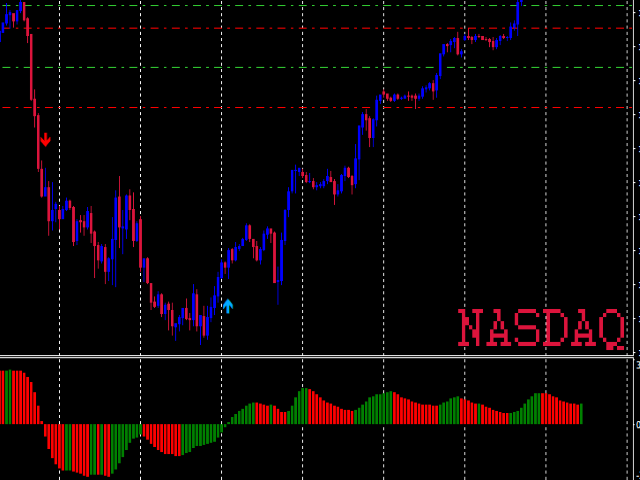
the indicator will show signal arrows on the graph at the crossing of Awesome Oscillator base level
it has push and audible alerts and Email alert.
By crossing above base level , a blue arrow will come out for the BUY, at the same time an audible signal will sound.
By crossing Below base level, a red arrow will come out for the SELL, at the same time an audible signal will sound.
Possibility to deactivate push and audible alerts.
MT4 version : Buy the 'Awesome cross' Technical Indicator for MetaTrader 4 in MetaTrader Market (mql5.com)