Currency Strength Meter MT5 Indicator by PipTick
- インディケータ
-
Michal Jurnik
 "Talent is cheaper than table salt. What separates the talented individual from the successful one is a lot of hard work." - Stephen King. Those few words reflect myself very well. I am probably not the most talented developer in the world but I truly believe in hard work, professional attitude and
 - バージョン: 6.0
- アップデート済み: 1 9月 2022
- アクティベーション: 5
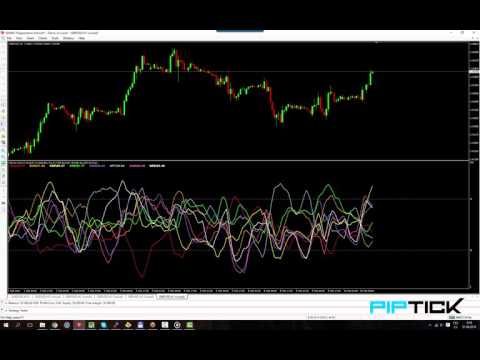
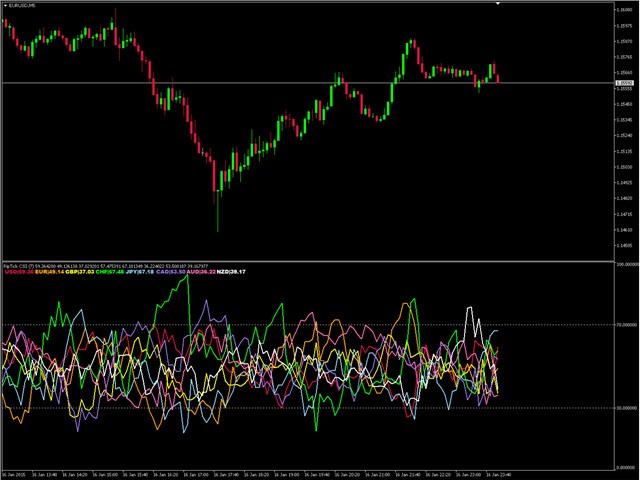
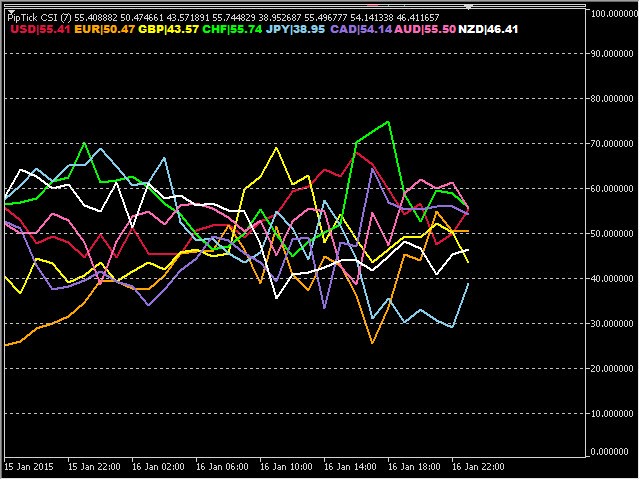
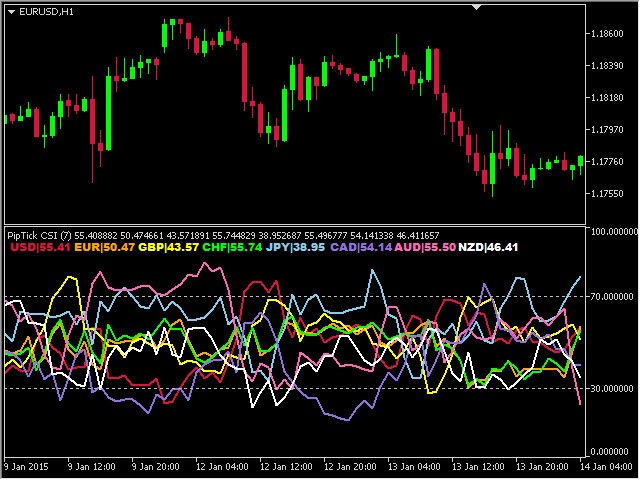
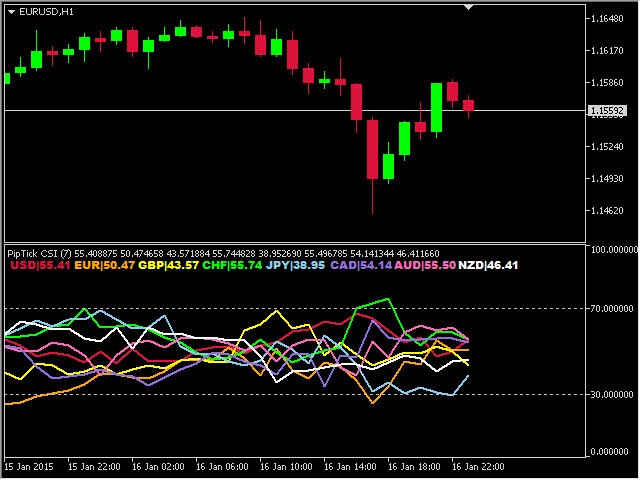
Knowledge of the strength and weakness of each currency is vital for every forex trader. Our Currency Strength Meter indicator measures the strength of eight major currencies (USD, EUR, GBP, CHF, JPY, CAD, AUD, NZD) by using the Relative Strength Index indicator, also known as RSI. The Currency Strength Meter indicator shows you, simply and quickly, when a currency is oversold, overbought, or in "normal area". This way, you can identify which currency is the strongest and the weakest.
Our indicator is calculated from 28 currency pairs and works on every MT platform. The Currency Strength Meter indicator uses only seven currency pairs to calculate the rest of the 21 pairs. Therefore, for the correct working of the indicator, you need only these seven pairs in your MT platform: EURUSD, GBPUSD, AUDUSD, NZDUSD, USDJPY, USDCHF, and USDCAD.
Note: If the indicator is used in Strategy Tester, all pairs' data must be downloaded in History Center before (How-to). No downloads are needed if it is added to the chart as usual.
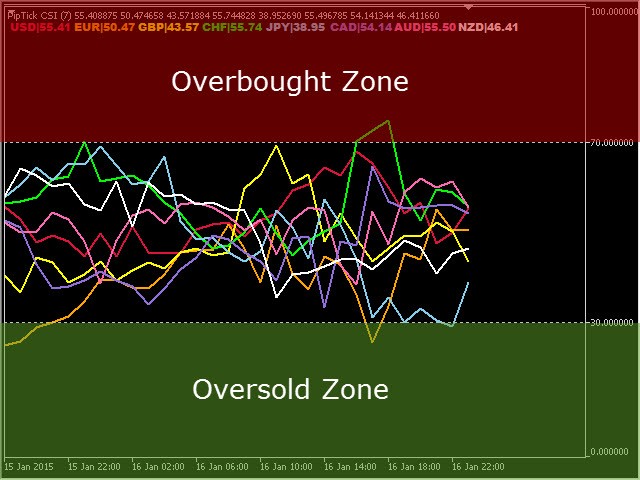
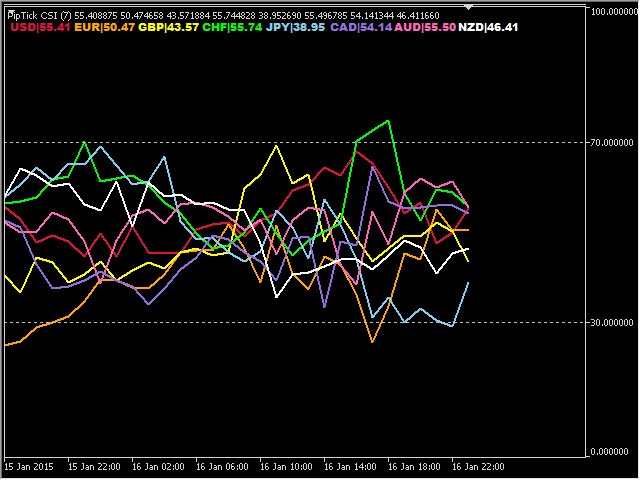
Interpretation of the indicator
Because our CSM indicator is based on well-known indicators, its interpretation is straightforward.
RSI
- Oversold area (the value of CSM is under the level of 30)
- Normal zone area (the value of CSM is between the levels of 30 and 70)
- Overbought area (the value of CSM is above the level of 70)
- Strong currency (the value of CSM is above the level of 50)
- Weak currency (the value of CSM is under the level of 50)
CCI
- Oversold area (the value of CSM is under 100)
- Normal zone area (the value of CSM is between -100 and 100)
- Overbought area (the value of CSM is above 100)
- Strong currency (the value of CSM is above the level of 0)
- Weak currency (the value of CSM is under the level of 0)
MFI
- Oversold area (the value of CSM is under the level of 30)
- Normal zone area (the value of CSM is between the levels of 30 and 70)
- Overbought area (the value of CSM is above the level of 70)
- Strong currency (the value of CSM is above the level of 50)
- Weak currency (the value of CSM is under the level of 50)
MACD
- Strong currency (the value of CSM is above the level of 0)
- Weak currency (the value of CSM is under the level of 0)
How to you use Currency Strength Meter indicator?
There are two basic approaches how to trade currency strength and weakness:
- Buy strong currency and sell weak currency - Trend Following strategy. For example, if the EUR is strengthening and AUD is weakening, buy the EURAUD currency pair. Do not trade if one of the currencies is overbought/oversold.
- Sell strong currency and buy weak currency - Counter Trend strategy. For example, if USD is overbought and JPY is oversold, sell USDJPY.
You can achieve great results if you use the overbought/oversold concept of currency in conjunction with Price Action or Candlestick patterns. All you have to do is wait for the overbought/oversold of one currency, followed by drawing a candlestick pattern like a hammer or shooting star. Of course, this is just one of the thousands of possible ways to use our currency strength indicator.
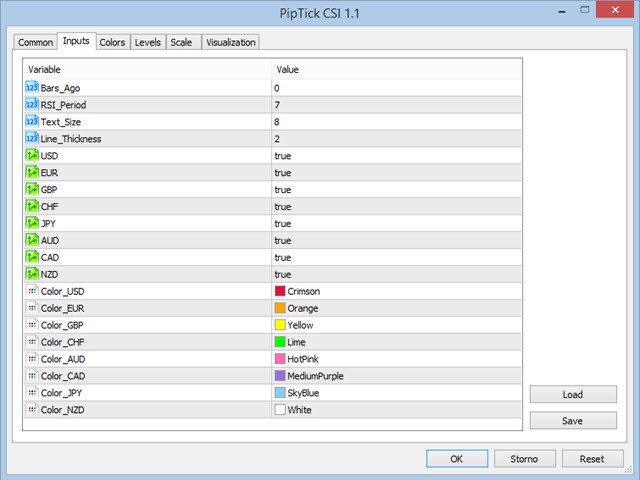
It is possible to use the CSM indicator for manual backtest as well. All you have to do is set parameter "Bars_Ago = 0" in indicator settings and download historical data for seven currency pairs which our indicator needs to calculate.
Main features
- The indicator shows the strength and weakness of eight major currencies (USD, EUR, GBP, CHF, JPY, CAD, AUD, NZD)
- A simple comparison of one currency against another
- Overbought and oversold area for entering or exiting the trades
- Works on every timeframe
- The indicator is non-repainting
- Ready for backtesting
- Customizable parameters
- Excellent results in conjunction with PA and Candlestick patterns
- Ideal tool for scalping
- Very fast calculation
- The indicator works with prefix and suffix of symbols as well
- Available for MT4 and MT5
Please visit the Currency Strength Meter indicator product page for inputs and outputs settings.