ATR HeikenAshi by Gerega

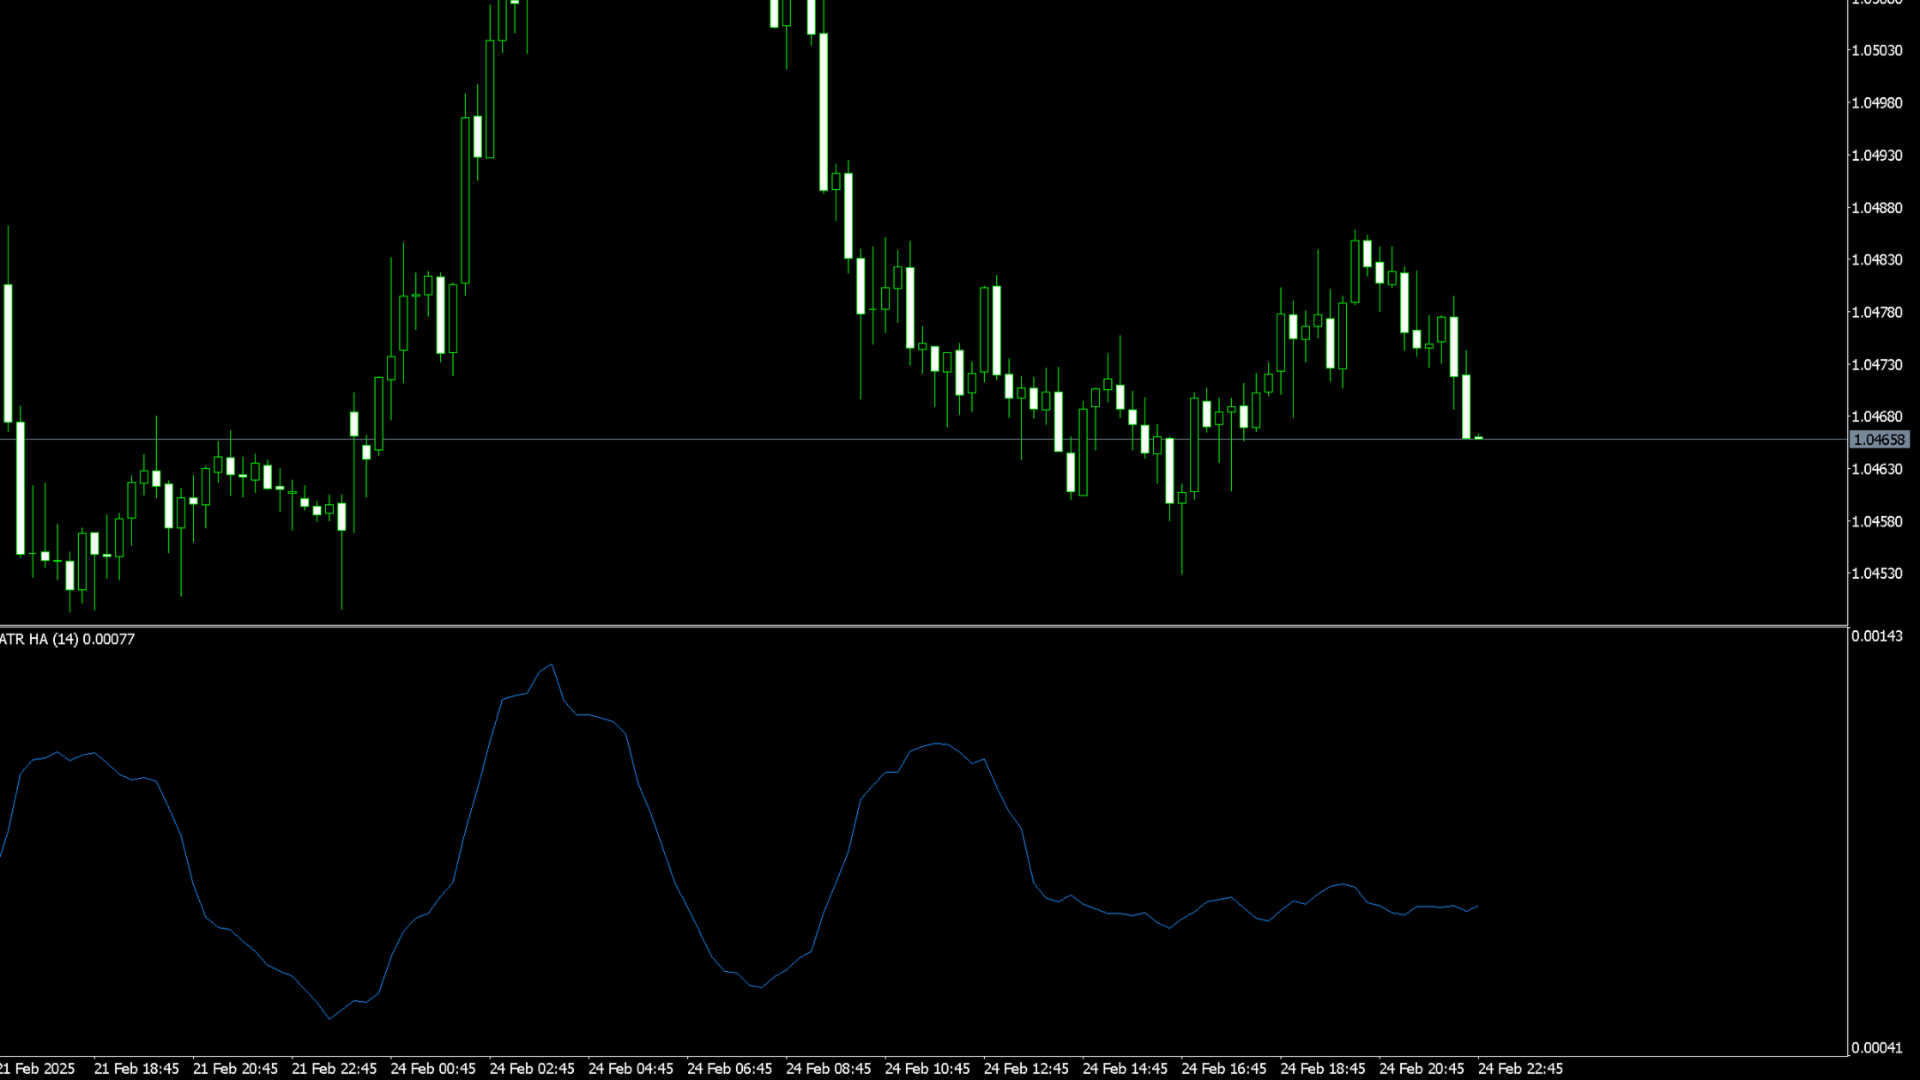
TheATR Indicator Based on Heiken Ashiis a unique volatility analysis tool that combines theAverage True Range (ATR)withHeiken Ashi candlestick calculationsto provide a smoother and more reliable measure of market volatility. Unlike the traditional ATR, which uses standard candlesticks, this indicator applies the Heiken Ashi formula to filter out market noise and deliver a clearer volatility signal.


Key Features:

ATR Calculation Based on Heiken Ashi Candlesticks– Offers a more stable volatility measure by reducing market noise.

Smooth and Accurate Trend Analysis– Helps traders identify real market momentum without false spikes.

Customizable Parameters– Adjust the ATR period and Heiken Ashi smoothing factor to fit your trading strategy.

Works on All Timeframes and Assets– Suitable for Forex, stocks, indices, and cryptocurrencies.

Enhanced Risk Management– Ideal for setting optimized stop-loss and take-profit levels based on filtered market volatility.


This indicator is perfect for traders looking to refine their volatility analysis and improve their trade execution by using a more stable and accurate ATR calculation.


おすすめのプロダクト
This MT5 indicator provides real-time updates of classic Renko charts. Renko charts focus on price movement, filtering out noise and highlighting trends. What are Renko candles? Renko charts display price movement using "bricks" of equal size, ignoring time. A new brick is drawn only when the price moves by a specified amount. They help visualize trends by removing time-based noise. Parameters - BrickSizePoints  (20): Renko brick size in points - HistoryDepthSec  (3600): Historical data to ini
FREE
Gino Renko
Stephane, Andr Valette
1 (1)
Another renko-based indicator. It returns different usable values ​​for an EA, and is directly displayed on the main chart. Its setting is very simple: The size of the renko The number of bars taken into account The falling color The color on the rise Returned values: Buffer 0 : Value of the middle Buffer 1 : Value of the Top Buffer 2 : Value of the Bottom Buffer 3 : Direction of renko (0.0 for top ; 1.0 for bottom) Buffer 4 : Ratio of the renko, for example, if it is twice, 3 times, ro more of
ZigZag SMC MT5
Kallebe Lins De Oliveira Santos
The ZigZag SMC/SMT Indicator for MT5 is the ideal tool for traders who want to accurately identify tops and bottoms based on the advanced concepts of Smart Money Concepts (SMC) and Smart Money Trap (SMT). Main Benefits: Automatic identification of strategic tops and bottoms. Based on concepts used by institutional traders. Ideal for analyzing liquidity, market structure and manipulation. Simple to use: just add it to the chart and track the critical points. ️ Free Version: This ve
FREE
GDS Renko Anatomy GDS Renko Anatomy 2D is a next-generation Renko visualization engine for MetaTrader 5. This is not a classic Renko chart. The indicator transforms market movement into a layered structural map where trend pressure, reversals, momentum continuity, and market topology become visually readable in real time. Designed with a modern dark institutional aesthetic, Anatomy 2D displays price action as a synthetic Renko structure with adaptive visual layers and semantic market interpreta
FREE
Hull Moving Average (HMA) for MT5 – 高速・滑らか・ゼロ遅延トレンド指標 MetaTrader 5向けの**Hull Moving Average (HMA)**で、トレードの精度をさらに高めましょう。SMA、EMA、WMAとは異なり、HMAは市場の方向に即座に反応しつつノイズを除去するため、スキャルピング、デイトレード、スイングトレードに最適なクリアで信頼性の高いシグナルを提供します。 高性能の加重移動平均エンジンで構築され、Alan Hullの正確な計算式を使用して滑らかで信頼性の高いトレンドラインを出力し、 再描画なし で視覚分析や自動売買戦略に最適です。 主なメリット トレンド変化へのゼロ遅延応答 滑らかで安定したラインによる明瞭なチャート表示 SMA/EMA/WMAより高精度 再描画なし、EA対応 すべての銘柄で使用可能:Forex、ゴールド、指数、暗号資産 トレンド方向、エントリー/エグジット、プルバック、反転の分析に最適 HMA for MT5を選ぶ理由 最小遅延で正確にトレンドを把握 市場反転の迅速な特定 システムトレードや自動売買
FREE
DAILY OH/OL SDEV QUANT MODEL - STATISTICAL TRADING WITH PRECISION RISK MANAGEMENT TRADE WITH MATHEMATICAL CERTAINTY - KNOW YOUR EXACT STOP-LOSS AND TAKE-PROFIT BEFORE YOU ENTER This indicator analyzes 5,000+ days of price history to give you: Exact entry levels (sigma bands locked at daily open) Exact stop-loss distance (from M
Renko Chart
Marcin Konieczny
3.56 (9)
This indicator allows to display Renko charts in the indicator window. Renko charts show only price movements that are bigger than the specified box size. It helps to eliminate noise and allows to focus on main trends. Time is not a factor here. Only price movements are taken into account. That's why Renko chart is not synchronized with the main chart it is attached to. Indicator works in two modes: CLOSE - only close prices are taken into account while building the chart HIGH_LOW - only high/l
FREE
Watermark Centralized Adds a watermark centered with the asset name and chosen period. It is possible to override the font type, font size, font color and separator character. The watermark is positioned behind the candles, not disturbing the visualization. It has automatic re-centering if the window is resized. Hope this indicator helps you, good trading ;)
FREE
"Five Minute Drive" indicator that is designed to be used in the 5 minute timeframe only. One of its most important advantages is that it shows the general trend in the upper time frames when looking at the 5-minute timeframe. Therefore, when opening positions in the 5 minute timeframe, when it is in line with the trends in the upper timeframes, you are less likely to be upside down. If you can interpret the curvilinear and linear lines drawn by this indicator on the graphic screen with your geo
FREE
MAD Bands(Moving Average Deviation Bands) MAD Bands は、価格に対するボラティリティの挙動を移動平均との関係から視覚的に確認したい場合に利用することを想定しています。 MAD_Bands (MQL5版) パラメータ解説 このドキュメントでは、各設定項目(Inputパラメータ)について、MT5のパラメータ入力画面を解説します。 Group: Main (基本設定) Period 初期値 :     20 解説 : 移動平均線(Mid)やバンド幅の計算に使用するローソク足の本数です。数値を大きくすると線が滑らかになりますが、反応は遅くなります。 Shift 初期値 :     0 解説 : インジケータの描画位置を左右にずらします。通常は     0     です。 Center Method 初期値 :     EMA 解説 : 中心線(Midライン)の計算ロジックを選択します。 SMA : 単純移動平均 EMA : 指数平滑移動平均(直近重視) WMA : 加重移動平均 SMMA : 平滑移動平均(長期目線) ZLMA : ゼロラグ
FREE
Advanced CRT Indicator MT5 — Candle Range Theory Tool Advanced CRT Indicator MT5 is a professional analysis tool that automates Candle Range Theory. It identifies consolidation ranges, breakout levels, Fair Value Gaps (FVG), and profit targets, with a real-time dashboard and alerts. Overview - Multi-timeframe candle range detection   - Automatic breakout levels with buffer settings   - Fair Value Gap identification and tracking   - Up to three customizable target levels (Risk:Reward ratios)  
Bands are a form of technical analysis that traders use to plot trend lines that are two standard deviations away from the simple moving average price of a security. The goal is to help a trader know when to enter or exit a position by identifying when an asset has been overbought or oversold. This indicator will show upper and lover bands. You can change input parameters nPeriod and  nMethod to calculate those bands for each timeframe. Aqua clouds represent up or down trends.
Trend Direction ADX indicator Trend Direction ADX is part of a serie of indicators used to characterize market conditions. Almost any strategy only work under certain market conditions. Therefore it is important to be able to characterize market conditions at any time: trend direction, trend strength, volatility, etc.. Trend Direction ADX is an indicator to be used to characterize trend direction: trending up trending down ranging Trend Direction ADX is based on ADX standard indicator. Tre
LongTerm は、中長期 trend の強さと質を解釈するために設計された方向性分析インジケーターであり、long oriented 分析に特化しています。 これはエントリーインジケーターでも運用 timing ツールでもなく、市場が long trend に対して有利または不利な条件を提供している時をトレーダーが理解するのを助けるために設計されたツールであり、短期変動に典型的なノイズを減らします。 目的 LongTerm は以下のために作られています: 強く構造化された long trends を識別する 拡大、減速、消耗のフェーズを区別する 支配的な方向性コンテキストを明確に読み取る これは swing trading と long term 分析を志向するトレーダーに理想的なツールです。 色と市場条件の解釈 LongTerm は、long trend のさまざまなフェーズを即座に読み取れるように設計されたカラー構造を使用し、市場の最良および最悪の条件を明確に強調します。 緑のライン 正の傾きで青のラインの上 この構成は最良の条件を表します。 Long trend は強く、安定
FREE
GDS Renko Conscience State Engine Trader State Intelligence Engine The market doesn’t stop you. Your conscience does. GDS Renko Conscience is a new generation behavioral atmosphere engine for MetaTrader 5 that visualizes the hidden psychological state behind market participation. This is not a classic oscillator. Not a signal generator. Not another noisy dashboard. Conscience transforms the chart itself into a living behavioral environment where trader pressure, emotional acceleration, hesitat
FREE
BerelzBox Darvas based
Barend Willem Van Den Berg
5 (1)
概要 BerelzBox Darvas は MetaTrader 5 用の Darvas Box インジケーターです。現在のローソク足にリアルタイムで更新されるボックスを描画し、参照用に前回の完成したボックスを表示します。ボックスはカラーコード化されたゾーンに分割され、潜在的なエントリーエリアとブレイクアウト条件の特定に役立ちます。 このインジケーターは、Nicolas Darvas の古典的なボックス理論に基づき、現代のマルチタイムフレーム使用に適応させたものです。 仕組み インジケーターは選択したタイムフレーム(デフォルト H4)で各ローソク足ごとに1つのボックスを作成します。現在のボックスは bar 0 の形成に合わせて毎ティック更新されます。前回のボックスは比較のために固定されたまま残ります。 各ボックスは6つのグラデーションゾーンに分割されます: 緑色ゾーン(下半分)は買いエッジエリアを示し、ボックスの安値付近でより濃い色になります 赤色ゾーン(上半分)は売りエッジエリアを示し、ボックスの高値付近でより濃い色になります 点線の中間線が2つの半分を分離します 設定可能な Edg
FREE
Harness the Power of Donchian Channels for Trend Trading The Donchian Channel Indicator may your key to precision trading. With Donchian channels, you'll gain insights into market volatility, breakouts, and overbought/oversold conditions.  This winning strategy is named after its developer, Richard Donchian. How Does the Donchian Strategy Work? The upper band represents the previous period's highest high;  The lower band represents the previous period's lowest Low;  The centre band reflects
FREE
2本の加重移動平均線(WMA)をチャート上に表示し、低モメンタムおよびレンジ相場を自動検出するプロフェッショナル向けインジケーターです。 WMA1は始値を基準に計算され、軽微なオフセット付きでトレンド方向を示します。 WMA2は終値を基準に計算され、モメンタムの確認に使用されます。 2本のWMA間の距離が縮小すると、ローソク足は自動的にグレー表示となり、市場がレンジまたは調整局面に入っていることを警告します。 すべての通貨ペア、指数、商品、そして全時間足で使用可能です。 SuperSmooth WMA Trading System Proへアップグレード Pro版では、エントリー/イグジットシグナル、ロング/ショートのローソク足カラー表示、上位足EMAトレンドフィルター、MACDモメンタム確認、SMA方向フィルター、リアルタイムアラート、時間足フィルター設定機能を追加。 すべてのフィルターが一致した場合のみシグナルを生成し、誤シグナルを大幅に削減します。 このインジケーターが役に立つと感じた場合は、ぜひレビューをご検討ください。あなたのフィードバックは、他のトレーダーがこのツールを
FREE
Are you tired of drawing trendlines every time you're analyzing charts? Or perhaps you would like more consistency in your technical analysis. Then this is for you. This indicator will draw trend lines automatically when dropped on a chart. How it works Works similar to standard deviation channel found on mt4 and mt5. It has 2 parameters: 1. Starting Bar 2. Number of bars for calculation The   starting bar   is the bar which drawing of the trend lines will begin, while the   number of bars for c
FREE
The   Trendlines Oscillator   helps traders identify trends and momentum based on the normalized distances between the current price and the most recently detected bullish and bearish trend lines. The indicator features bullish and bearish momentum, a signal line with crossings, and multiple smoothing options. USAGE The   Trendlines Oscillator   works by systematically: Identifying pivot highs and lows. Connecting pivots to form bullish (support) and bearish (resistance) trendlines. Measuring
This SMT (Smart Money Technique) divergence indicator identifies discrepancies in price movement between two different trading symbols, helping traders detect potential market reversals. This tool compares the price action of two correlated assets, such as two currency pairs or indices, to spot divergences where one asset's price moves in the opposite direction of the other. For example, while one symbol may be making higher highs, the other might be making lower highs, signaling a divergence. T
FREE
本指标 基于 Zigzag 基础上... 增加了: 1.增加了箭头指示,使图表更鲜明 2.增加了价格显示,使大家更清楚的看清价格. 3.增加了报警等设置,可以支持邮件发送 原指标特性: 1.基本的波段指标构型. 2.最近的2个ZIGZAG点不具有稳定性,随着行情而改变,(就是网友所说的未来函数) 3.原指标适合分析历史拐点,波段特性,对于价格波动有一定的指导性. Zigzag的使用方法一 丈量一段行情的起点和终点 (1)用ZigZag标注的折点作为起点和终点之后,行情的走势方向就被确立了(空头趋势); (2)根据道氏理论的逻辑,行情会按照波峰浪谷的锯齿形运行,行情确立之后会走回撤行情,回撤的过程中ZigZag会再次形成折点,就是回撤点; (3)在回撤点选择机会进场,等待行情再次启动,止损可以放到回撤的高点。 一套交易系统基本的框架就建立起来了。 Zigzag的使用方法二 作为画趋势线的连接点 趋势线是很常见的技术指标,在技术分析中被广泛地使用。 但一直以来趋势线在实战中都存在一个BUG,那就是难以保证划线的一致性。 在图表上有很多的高低点,到底该连接哪一个呢?不同的书上画趋势线的方法
FREE
This indicator calculates fibonacci levels via moving averages trend and draw these lines. You can change fast and slow Moving Averages settings for customization. Inputs: Fast MA Time Period :  64 Fast MA Shift: 0 Fast MA Method: Smoothed Fast MA Apply To: Median Price Slow MA Time Period: 32 Slow MA Shift: 0 Slow MA Method: Smoothed Slow MA Apply To: Median Price ZigZag: False ZigZag Color: Red ZigZag Type: DashDot ZigZag Width: VeryThin Fibo Settings TrendFibonacci: True FiboTrendColor: Black
FREE
Drawdown Shield — Free Prop Firm Drawdown Protector & Risk Manager for MT5 Free Prop Firm Drawdown Protector | FTMO Compliant | No DLL Required | NFP Safe Failed a prop firm challenge because of a drawdown breach? You're not alone. Over 70% of traders fail due to risk management — not strategy.   Drawdown Shield   gives you the essential Drawdown Protector to pass your FTMO challenge, completely free. Brought to you by the PropGuard Pro team. What You Get in This FREE Version Feature Stat
FREE
All about time and price by ICT. This indicator provides a comprehensive view of ICT killzones, Silver Bullet times, and ICT Macros, enhancing your trading experience.  In those time windows price either seeks liquidity or imbalances and you often find the most energetic price moves and turning points. Features: Automatic Adaptation: The ICT killzones intelligently adapt to the specific chart you are using. For Forex charts, it follows the ICT Forex times: In EST timezone: Session: Asia: 20h00-0
The indicator has only one parameter - the number of bars for analysis. The indicator calculates statistics for when the market was moving down, when it was moving up, and the number of bars for each movement. From this data, the average number of bars is calculated, which is displayed in the indicator window. If the indicator values sharply decrease, then the market is preparing for an upward movement. If the indicator values persist at high levels for an extended period, then the market is pre
FREE
概要 このインジケーターは、クラシックな ドンチャンチャネル を強化したバージョンで、実践的なトレード機能を追加しています。 標準の3本線(上限、下限、中央線)に加え、 ブレイクアウト を検出し、チャート上に矢印で視覚的に表示します。また、チャートを見やすくするために、 現在のトレンド方向と逆側のラインのみを表示 します。 インジケーターの機能: 視覚的シグナル :ブレイクアウト時にカラフルな矢印を表示 自動通知 :ポップアップ、プッシュ通知、Eメール RSIフィルター :市場の相対的な強弱に基づいてシグナルを検証 カスタマイズ可能 :色、ラインの太さ、矢印コード、RSI閾値など 動作原理 ドンチャンチャネルは次のように計算します: 上限線 :直近N本のクローズ済みローソク足の最高値 下限線 :直近N本のクローズ済みローソク足の最安値 中央線 :最高値と最安値の平均値 上方ブレイクアウト は終値が上限線を超えたときに発生し、 下方ブレイクアウト は終値が下限線を下回ったときに発生します。 インジケーターは以下を行います: 3本のドンチャンラインを描画 方向転換後の最初のブレイクアウト
FREE
Renko Plus
Eadvisors Software Inc.
With Renko Plus you can use the features in the Indicator functionality, just add it to the Metatrader5 chart.             The Renko chart is a type of chart, developed by the Japanese, that is constructed using price movement rather than standardized prices and time intervals like most charts. It is believed to be named after the Japanese word for bricks, "renga", as the graphic looks like a series of bricks.             A new brick is created when the price moves a specified pri
Neural Levels Indicator – Precise AI-Based Market Levels Unlock next-level trading precision with the Neural Levels Indicator, a powerful market analysis tool built on advanced price-action principles and inspired by cutting-edge neural networks. Instantly identify three key neural trading levels directly on your chart: Neural Level 1 Purpose: Crucial equilibrium level, ideal for identifying market balance points and potential turning zones. Neural Level 2 (Optimal Entry) Purpose: Indicates p
FREE
Renko Graph   練行足グラフ 現在の価格の場所にあるメインチャートウィンドウの練行足インジケーター。 インディケータは、通常の相場チャートの背景に対して、長方形(「ブリック」)の形で価格変動を表示します。設定で指定されたポイント数による価格の上昇は、前の次の長方形の上に追加することによってマークされ、下向きの動きは前の長方形の下に追加されます。 インジケーターは、主なトレンドを視覚的に識別するように設計されています。根底にあるトレンドを平均化する際に、主要なサポートとレジスタンスのレベルを特定するために使用されます。このビューでは、小さな価格変動(「ノイズ」)は考慮されていないため、非常に重要な動きに集中できます。 価格変動が指定されたしきい値レベルを超えた場合にのみ、上または下の新しい指標値がプロットされます。サイズは設定で設定され、常に同じです。たとえば、基本サイズが10ポイントで、価格が20上昇した場合、2つのインジケーター値が作成されます。 インジケーターの利点は、どのレンガでもその形成時間の長さを示すことができることです。価格が範囲内で変動し、成長せず、しきい値の
このプロダクトを購入した人は以下も購入しています
ARIPoint
Temirlan Kdyrkhan
1 (1)
ARIPoint is a powerful trading companion designed to generate high-probability entry signals with dynamic TP/SL/DP levels based on volatility. Built-in performance tracking shows win/loss stats, PP1/PP2 hits, and success rates all updated live. Key Features: Buy/Sell signals with adaptive volatility bands Real-time TP/SL/DP levels based on ATR Built-in MA Filter with optional ATR/StdDev volatility Performance stats panel (Success, Profit/Loss, PP1/PP2) Alerts via popup, sound, push, or email Cu
SuperScalp Pro
Van Minh Nguyen
4.63 (24)
SuperScalp Pro – 高度なマルチフィルタースキャルピングインジケーターシステム SuperScalp Pro は、クラシックな Supertrend と複数のインテリジェント確認フィルターを組み合わせた高度なスキャルピングインジケーターです。M1 から H4 まで複数の時間足で効率的に動作し、XAUUSD、BTCUSD、主要 Forex 通貨ペア向けに最適化されています。 このインジケーターは明確な Buy / Sell シグナルを提供し、ATR に基づいてエントリー価格、Stop Loss、Take Profit を自動計算します。Fibonacci Take Profit 機能により、重要な価格帯で早期決済し、到達時に通知を送信します。 初期設定では Fibonacci Take Profit が有効化されており、より安定した取引体験を重視しています。チャートに適用するだけですぐ利用可能です。上級者向けに、すべてのパラメータは自由にカスタマイズできます。 EMA、RSI、ADX、Volume、VWAP、Bollinger Bands、MACD Divergence な
このインジケーターを購入された方には、以下の特典を 無料 で提供しています: 各トレードを自動で管理し、ストップロスとテイクプロフィットを設定し、戦略ルールに基づいてポジションを決済する補助ツール 「Bomber Utility」 様々な銘柄に合わせたインジケーターの設定ファイル(セットファイル) 「最小リスク」、「バランスリスク」、「待機戦略」 の3つのモードで使用できる Bomber Utility 用の設定ファイル このトレーディング戦略をすぐに導入・設定・開始できる ステップバイステップのビデオマニュアル ご注意: 上記の特典を受け取るには、MQL5のプライベートメッセージシステムを通じて販売者にご連絡ください。 オリジナルのカスタムインジケーター 「Divergence Bomber(ダイバージェンス・ボンバー)」 をご紹介します。これは、MACDのダイバージェンス(乖離)戦略に基づいた 「オールインワン」型のトレーディングシステム です。 このテクニカルインジケーターの主な目的は、価格とMACDインジケーターの間に発生するダイバージェンスを検出 し、将来の価格の動きを示す
Entry In The Zone and SMC Multi Timeframe is a real-time 2-in-1 market analysis tool that combines market structure analysis and a No Repaint BUY / SELL signal system into a single indicator, built on Smart Money Concepts (SMC) — a widely adopted framework used by professional traders to understand market structure. This indicator helps you see the market more clearly, make decisions based on structure rather than guesswork, and focus on high-probability zones where price is more likely to react
Gold Entry Sniper – ゴールドスキャルピング&スイングトレード用プロフェッショナル多時間足ATRダッシュボード Gold Entry Sniper は、XAUUSDや他の銘柄向けに正確な 売買シグナル を提供する、MetaTrader 5用の高度なインジケーターです。 ATRトレーリングストップロジック と 多時間足分析ダッシュボード を搭載し、スキャルピングからスイングトレードまで対応します。 主な特徴と利点 多時間足シグナル分析 – M1、M5、M15 のトレンドを同時表示。 ATRベースのトレーリングストップ – ボラティリティに応じて動的に調整。 プロ仕様のチャートダッシュボード – シグナル状況、ATRレベル、回帰線、売買方向を表示。 明確な売買マーカー – 自動矢印とテキストラベル。 エグジットアラートとトレード管理 – 利益確定のための自動検出。 完全カスタマイズ可能 – パネル位置、色、フォント、ATR/回帰設定を調整可能。 ゴールド(XAUUSD)に最適化 – M1〜M15のスキャルピングに最適、FXや指数、暗号資産にも対応。 Gold Entry
Power Candles V3 - 自己最適化型強弱インジケーター Power Candles V3は 、通貨や銘柄の強さを、適用されたすべてのチャート上で実行可能なトレードプランに変換します。単にローソク足を色分けするだけでなく、バックグラウンドでリアルタイムの自動最適化を実行し、目の前の銘柄に対して最適なストップロス、テイクプロフィット、およびシグナルの閾値を提示します。ワンクリックで実取引に適用でき、エントリーポイント、ストップロス、テイクプロフィットのラインが正確な価格位置にチャート上に表示され、方向性を示すアラートがリアルタイムで発動します。 このツールは、Stein Investmentsのエコシステムの一部です。  18種類以上のツールをすべて閲覧し、AIを活用したセットアップの推奨事項を入手し、  https://stein.investments でコミュニティに参加しましょう クローズしたバーごとに3,000回以上のトレードシミュレーション。9つの強さの状態。2つの戦略を並行してテスト。勝率の高い設定をワンクリックで適用。 なぜこれが必要なのか ほとんどの強
SignalTech MT5 is a fully rule based trading system for EURUSD, USDCHF, USDJPY, AUDUSD, NZDUSD, EURJPY, AUDJPY, NZDJPY, CADJPY.  All the winning trades with chart setups are published on the comments page. 2025-12 1174 Pips 2026-01 2624 Pips 2026-02 2937 Pips 2026-03 2165 Pips 2026-04 2243 Pips It can generate signals with Buy/Sell Arrows and Pop-Up/Sound Alerts. Each signal has clear Entry and Stop Loss levels, which should be automatically flagged on the chart, as well as potential Targets 1,
ご紹介     Quantum Breakout PRO は 、ブレイクアウト ゾーンの取引方法を変革する画期的な MQL5 インジケーターです。 13年以上の取引経験を持つ経験豊富なトレーダーのチームによって開発されました。     クォンタム ブレイクアウト プロ   は、革新的でダイナミックなブレイクアウト ゾーン戦略により、あなたのトレーディングの旅を新たな高みに押し上げるように設計されています。 クォンタム ブレイクアウト インジケーターは、5 つの利益ターゲット ゾーンを備えたブレイクアウト ゾーン上のシグナル矢印と、ブレイクアウト ボックスに基づいたストップロスの提案を提供します。 初心者トレーダーにもプロのトレーダーにも適しています。 量子EAチャネル:       ここをクリック 重要!購入後、インストールマニュアルを受け取るためにプライベートメッセージを送ってください。 推奨事項: 時間枠: M15 通貨ペア: GBPJPY、EURJPY、USDJPY、NZDUSD、XAUUSD アカウントの種類: ECN、Raw、またはスプレッドが非常に低い R
Gann Made Easy   は、ミスター・ギャンの理論を使用した取引の最良の原則に基づいた、プロフェッショナルで使いやすい外国為替取引システムです。 W・D・ガン。このインジケーターは、ストップロスとテイクプロフィットレベルを含む正確な買いと売りのシグナルを提供します。 PUSH通知を利用して外出先でも取引可能です。 ご購入後、取引方法の説明と優れた追加インジケーターを無料で入手するには、私にご連絡ください! おそらく、ギャンの取引手法についてはすでに何度も聞いたことがあるでしょう。通常、ギャンの理論は初心者のトレーダーだけでなく、すでにある程度の取引経験がある人にとっても非常に複雑なものです。なぜなら、ギャンの取引手法は理論的にはそれほど簡単に適用できるものではないからです。私はその知識を磨き、最良の原則を私の外国為替インジケーターに組み込むために数年を費やしました。 このインジケーターは非常に簡単に適用できます。必要なのは、それをチャートに添付し、簡単な取引推奨事項に従うだけです。このインジケーターは常に市場分析の仕事を行い、取引の機会を探します。適切なエントリーポイントを検
RelicusRoad Pro: 定量的市場オペレーティングシステム 【期間限定】無制限アクセス 70% OFF - 2,000人超のトレーダーと共に なぜ多くのトレーダーは「完璧な」インジケーターを使っても失敗するのでしょうか? それは、文脈を無視して 単一の概念 だけでトレードしているからです。文脈のないシグナルは単なるギャンブルです。勝ち続けるには、 根拠の重なり(コンフルエンス) が必要です。 RelicusRoad Proは単なる矢印インジケーターではありません。完全な 定量的市場エコシステム です。独自のボラティリティモデリングを用いて、価格が推移する「適正価値の道(Fair Value Road)」をマッピングし、ノイズと真の構造的ブレイクを判別します。 推測はやめましょう。機関投資家レベルの「ロード・ロジック」でトレードを。 コアエンジン:「Road」アルゴリズム システムの中心となる Road Algo は、市場環境にリアルタイムで適応するダイナミックなボラティリティチャネルです。 安全ライン(平衡点) と、価格が数学的に反転しやすい 拡張レベル を投影します。 Si
MetaTrader 5 向けスマート多層ブレイクアウト&プルバック検出器 「スマート・シンプル・ファスト!」 高確率のブレイクアウトエントリーを見逃すことにうんざりしていませんか? 複数のチャートを何時間もスキャンし、ブレイクアウトをトレンド方向と通貨のモメンタムに合わせようとして、それでも動きを逃してしまうことはありませんか? Break Pullback は、1つのインジケーターでそのすべてを解決します。 Break Pullback とは何ですか? Break Pullback は、マーケットストラクチャー、ブレイクアウト、トレンド継続のセットアップを取引するトレーダー向けに特別に設計されたプロフェッショナルグレードの MetaTrader 5 インジケーターです。 リアルタイムで複数の通貨ペアにわたるブレイクとプルバックの形成を自動的に検出し、3層の確認を通じてすべてのシグナルをフィルタリングします: ストラクチャラルブレイクアウト検出 — チャート上の主要なブレイクレベルを特定 HTF 日足バイアス — エントリーを支配的な日足トレンド方向に合わせる 通貨強弱指数 —
このインジケーターを購入すると、プロ仕様のトレードマネージャーを無料で差し上げます。 まず第一に、このトレーディングシステムがノンリペイント、ノンリドロー、ノンラグのインジケーターであることを強調する価値がある。これにより、手動取引とロボット取引の両方に理想的なものになっています。 オンラインコース、マニュアル、プリセットのダウンロード。 「スマートトレンドトレーディングシステム MT5」は、新規および経験豊富なトレーダー向けにカスタマイズされた包括的なトレーディングソリューションです。10以上のプレミアムインジケーターを組み合わせ、7つ以上の堅実なトレーディング戦略を備えており、多様な市場状況に対応する多目的な選択肢となっています。 トレンドフォロー戦略:トレンドを効果的に乗り越えるための正確なエントリーとストップロス管理を提供します。 リバーサル戦略:潜在的なトレンドの反転を特定し、トレーダーがレンジ相場を活用できるようにします。 スキャルピング戦略:高速で正確なデイトレードおよび短期取引のために設計されています。 安定性:すべてのインジケーターはノンリペイント、ノンリドロー、ノ
Azimuth Pro
Ottaviano De Cicco
5 (7)
Azimuth Pro V2:MT5向けシンセティック・フラクタル構造分析と確認済みエントリー 概要 Azimuth Pro は Merkava Labs によるマルチレベルスイング構造インジケーターです。4つのネストされたスイングレイヤー、スイングアンカーVWAP、ABCパターン検出、3タイムフレーム構造フィルタリング、そして確定バーでの確認済みエントリー — 1つのチャートで、ミクロスイングからマクロサイクルまでを網羅するワークフロー。 これはブラインドシグナル製品ではありません。ロケーション、コンテキスト、タイミングを重視するトレーダーのための構造ファーストワークフローです。 V2発売記念オファー — Azimuth Pro V2をUSD 399で(次の100本)。最終価格:USD 499。 1. V2での変更点 シンセティック・マルチタイムフレームエンジン 上位タイムフレーム分析をMeridian Proと同じ独自のシンセティックアーキテクチャで一から再構築。よりクリーンなHTFコンテキスト、安定したライブ動作、従来のMTF同期問題なし。シンセティックエンジンは 固定比率タ
FX Trend NG:次世代マルチマーケット・トレンドインテリジェンス 概要 FX Trend NG は、複数の時間足に対応したプロフェッショナル向けトレンド分析およびマーケット監視ツールです。 市場全体の構造を数秒で把握することができます。 複数のチャートを切り替える必要はありません。どの銘柄がトレンド中なのか、どこでモメンタムが弱まっているのか、そしてどの時間足で強い整合性があるのかを瞬時に確認できます。 ローンチ特別オファー – FX Trend NG を $30(6ヶ月) または $80 永久ライセンス でご利用いただけます。 すでに Stein Investments のユーザーですか? -> メッセージを送信 して、プライベートグループへアクセスしてください。 セットアップや詳細情報が必要ですか? -> Stein Investments 公式ページ をご覧ください。 1. FX Trend NG が他と異なる理由 3ステート・トレンドロジック ― Buy と Sell だけではない • 多くのインジケーターは Buy または Sell の2状態のみを表示します。
Quantum TrendPulse を ご紹介します。これは、   SuperTrend   、   RSI   、および Stochastic のパワーを 1 つの包括的なインジケーターに組み合わせて、取引の可能性を最大限に引き出す究極の取引ツールです。精度と効率を求めるトレーダー向けに設計されたこのインジケーターは、市場のトレンド、勢いの変化、最適なエントリー ポイントとエグジット ポイントを自信を持って特定するのに役立ちます。 主な特徴: SuperTrend 統合: 現在の市場動向に簡単に追従し、収益性の波に乗ることができます。 RSI精度: 買われすぎと売られすぎのレベルを検出し、市場の反転のタイミングに最適で、SuperTrendのフィルターとして使用されます。 確率的精度: 確率的振動を活用して、変動の激しい市場で隠れたチャンスを見つけます。SuperTrend のフィルターとして使用されます。 マルチタイムフレーム分析:   M5 から H1 または H4 まで、さまざまなタイムフレームで市場を常に把握します。 カスタマイズ可能なアラート: カスタム取引条件が満たされ
まず第一に、この取引インジケーターは再描画されず、再描画されず、遅延しないことを強調する価値があります。これにより、手動取引とロボット取引の両方に理想的なものになります。 ユーザーマニュアル:設定、入力、戦略。 アトミックアナリストは、価格の強さとモメンタムを利用して市場でより良いエッジを見つけるためのPA価格アクションインジケーターです。ノイズや誤ったシグナルを除去し、取引ポテンシャルを高めるための高度なフィルターを備えています。複雑なインジケーターの複数のレイヤーを使用して、アトミックアナリストはチャートをスキャンし、複雑な数学的計算をシンプルなシグナルと色に変換します。これにより、どのような初心者トレーダーでも理解して使用し、一貫した取引の決定を行うことができます。 「アトミックアナリスト」は、新規および経験豊富なトレーダー向けにカスタマイズされた包括的な取引ソリューションです。プレミアムインジケーターとトップノッチの機能を1つの取引戦略に組み合わせ、すべてのタイプのトレーダーにとって汎用性のある選択肢にします。 デイリートレーディングとスキャルピング戦略:高速で正確なデイ
まず第一に、この取引ツールはノンリペイント、ノンリドロー、ノンラグの指標であり、プロの取引に理想的ですことを強調する価値があります。 オンラインコース、ユーザーマニュアル、デモ。 スマートプライスアクションコンセプトインジケーターは、新米から経験豊富なトレーダーまで、非常 に強力なツールです。Inner Circle Trader AnalysisやSmart Money Concepts Trading Strategiesなど、20以上の有用な指標を1つに組み合わせています。このインジケーターはスマートマネーコンセプトに焦点を当て、大手機関の取引方法を提供し、彼らの動きを予測するのに役立ちます。 特に、流動性分析に優れており、機関がどのように取引しているかを理解しやすくしています。市場のトレンドを予測し、価格の動きを慎重に分析するのに優れています。機関の戦略とトレードを合わせることで、市場の動向についてより正確な予測ができます。このインジケーターは多目的であり、市場構造を分析し、重要な注文ブロックを特定し、さまざまなパターンを認識するのに優れています。 このインジケーター
BTMM State Engine Pro is a MetaTrader 5 indicator for traders who use the Beat The Market Maker approach: Asian session context, kill zone timing, level progression, peak formation detection, and a multi-pair scanner from a single chart. It combines cycle state logic with a built-in scanner dashboard so you do not need the same tool on many charts at once. What it does Draws the Asian session range; session times can follow broker server offset or be set in inputs. Tracks level progression (L
まず正直に言いましょう。 どんなインジケーターも、それ単体であなたを利益化させることはできません。もしそう言う人がいるなら、それは夢を売っているだけです。完璧な売買シグナル(矢印)を表示するインジケーターは、いくらでも“完璧に見せる”ことができます。正しい過去の区間を拡大して、勝ちトレードだけを切り取ればいいだけです。私たちはそれをしません。 SMC Intraday Formula はツールです。 市場構造を読み取り、最も高い確率の価格ゾーンを特定し、今この瞬間のスマートマネーの痕跡をシンプルな言葉で正確に示します。最終判断はあなたが行います。トレードを実行するのもあなたです。しかし今は「希望」ではなく「精度」でエントリーできます。 私たちはこのインジケーターを、ゴールド(XAUUSD)および主要FX通貨ペアで約3年間、日々のスキャルピングに使用してきました。M1、M5、M15、M30の主要ツールです。これは未来を予測しようとするのではなく、今まさに形成されている高確率セットアップを示し、その理由を説明します。 他のすべてのインジケーターと何が違うのか? ほとんどのトレーディングイ
Market Structure Order Block Dashboard MT5 は、市場構造と主要な価格反応ゾーンをチャート上で直接読み取りたいトレーダー向けに設計された MT5 インジケーターです。BOS、ChoCH、オーダーブロック、Fair Value Gap (FVG)、流動性、Kill Zones、Volume Profile、そして素早い分析のためのコンパクトなダッシュボードを組み合わせています。 本インジケーターは、市場構造、ICT、Smart Money の概念を意思決定の枠組みとして使用するトレーダーを対象としています。トレンド継続、反転の可能性、価格の不均衡、流動性ターゲット、注目ゾーンをより構造的に特定する助けとなります。 購入者向けの付属リソース 購入後、MQL5 のプライベートメッセージにてご依頼いただくと、完全な PDF ユーザーガイドとパラメータ設定のヒントを提供いたします。MQL5 のプライベートメッセージによる直接的な技術サポート。 バージョン 1.20 では 2 つの重要な追加機能があります: Pending BOS / Pending Cho
多くの矢印インジケーターは、シグナルだけを表示して、その後の判断をすべてトレーダーに任せてしまいます。KT Alpha Hunter Arrows は、完整なトレードプランをチャート上に提示します。 各シグナル矢印が表示されるたびに、エントリーライン、ストップロス、4つのテイクプロフィット水準、そして現在の銘柄と時間足が今トレードに値するかどうかを示すリアルタイムのエッジ判定が、すでに描画された状態で表示されます。付属の Trade Manager EA は、あなたが手動でエントリーした後の実行管理を担当し、相場が荒れて判断がぶれやすい場面でも規律あるトレードを保ちやすくします。リペイントなし。確定足シグナルのみ。Forex、ゴールド、指数、その他あなたが取引するあらゆる銘柄に対応します。 主な機能 リペイントしない買い矢印と売り矢印を、足の確定後にのみ表示。 各シグナルに、エントリーライン、構造的ストップロス、4つのテイクプロフィット水準を表示。 Edge Dashboard が、現在のチャートで買いセットアップと売りセットアップを別々に評価。 判定システム:No Edge、Mar
優れたテクニカルインジケーター「Grabber」をご紹介します。これは、すぐに使える「オールインワン」トレーディング戦略として機能します。 ひとつのコードに、市場のテクニカル分析ツール、取引シグナル(矢印)、アラート機能、プッシュ通知が強力に統合されています。 このインジケーターを購入された方には、以下の特典を無料で提供します: Grabberユーティリティ:オープンポジションを自動で管理するツール ステップバイステップのビデオマニュアル:インジケーターのインストール、設定、取引方法を解説 カスタムセットファイル:インジケーターをすばやく自動設定し、最大限の成果を出すための設定ファイル 他の戦略はもう忘れてください!Grabberだけが、あなたを新たなトレードの高みへと導いてくれるのです。 Grabber戦略の主な特徴: 推奨タイムフレーム:M5〜H4 対応通貨ペア・資産:どれでも使用可能ですが、私が実際に検証した以下を推奨します(GBPUSD、GBPCAD、GBPCHF、AUDCAD、AUDUSD、AUDSGD、AUDCHF、NZDUSD、NZDCAD、EURCAD、EURUSD、E
これはMT5のインジケーターで、再描画なしで取引に参入するための正確なシグナルを提供します。 外国為替、暗号通貨、金属、株式、インデックスなど、あらゆる金融資産に適用できます。かなり正確な見積もりを提供し、取引を開始して終了するのに最適な時期を教えてくれます。1つのシグナルを処理しただけでインジケーターの元が取れた例の 動画 (6:22)をご覧ください。Entry PointsPro インジケーターの助けを借りたほとんどのトレーダーの最初の1週間の結果が改善しています。 Telegramグループ に登録してください。Entry Points Proインジケーターのメリットは次の通りです。 再描画のないエントリーシグナル 再描画されるインジケーターでは一度表示されたシグナルが削除されて大きな金銭的損失につながることがありますが、これと異なり、表示されて確認されたシグナルは消えることがありません。 エラーなしの取引開始 インジケーターアルゴリズムによって取引を開始する(資産を売買する)理想的な瞬間を見つけることができます。それを使用するすべてのトレーダーの成功率が向上します。 あら
Meridian Pro
Ottaviano De Cicco
5 (2)
Meridian Pro 2.00:MT5向けプロ仕様マルチタイムフレーム・トレンドマトリクス Meridian Pro 2.00 は、MetaTrader 5 向けのプロ仕様の適応型トレンドマトリクスです。オリジナルの Meridian トレンドエンジン、クリーンなチャート ribbon、確定足ベースのシグナル矢印、8時間足 dashboard、Fuel momentum、weighted consensus、synthetic HTF processing、そしてチャート上に直接表示される上位足コンテキストラインを統合します。 目的はシンプルです。現在のトレンド、マルチタイムフレーム構造、強度、momentum、EA-ready 状態を、複数チャートに無関係なインジケータを重ねるのではなく、1つの整理された workflow で読むことです。 Meridian Pro の違い 1つの適応型エンジン - 同じ volatility-aware Meridian ロジックを M1 から W1 まで適用します。 Synthetic HTF architecture - 上位足行は下位足デ
このダッシュボードは、選択されたシンボルの最新の利用可能なハーモニックパターンを表示するので、時間を節約し、より効率的に /   MT4バージョン 。 無料インジケーター:   Basic Harmonic Pattern インジケーター列 Symbol : 選択したシンボルが表示されます。 Trend :   強気または弱気 Pattern : パターンの種類(ガートレー、バタフライ、バット、カニ、サメ、サイファー、ABCD) Entry : エントリー価格 SL: ストップロス価格 TP1: 1回目の利食い価格 TP2: 2回目の利食い価格 TP3:   3回目の利食い価格 Current price :   現在値 Age (in bars):    最後に描画されたパターンの年齢 主な入力項目 Symbols:   "28 Major Currency Pairs "または "Selected Symbols "から選択。 Selected Symbols:   カンマで区切られた監視したいシンボル("EURUSD,GBPUSD,XAUUSD")。ブローカーがペアに接
FX Power: 通貨の強弱を分析して、より賢い取引を実現 概要 FX Power は主要通貨と金の実際の強弱をあらゆる市場状況で理解するための必須ツールです。強い通貨を買い、弱い通貨を売ることで、 FX Power は取引の意思決定を簡素化し、高い確率の取引機会を見出します。トレンドを追従する場合でも、極端なデルタ値を使用して反転を予測する場合でも、このツールはあなたの取引スタイルに完全に適応します。ただ取引するだけではなく、 FX Power で賢く取引をしましょう。 1. なぜ FX Power がトレーダーにとって非常に有益なのか 通貨と金のリアルタイム強弱分析 • FX Power は主要通貨と金の相対的な強弱を計算し、マーケットダイナミクスに関する明確な洞察を提供します。 • どの資産がリードしているか、または後れを取っているかを監視して、取引するペアを賢く選びましょう。 マルチタイムフレームの包括的なビュー • 短期、中期、長期のタイムフレームで通貨と金の強弱を追跡し、マーケットトレンドに基づいて取引戦略を調整できます。 • スキャルピングからスイングトレード
OrderFlux | MetaTrader 5 用フットプリント・オーダーフロー バージョン 2.0 – アクティブトレーダー向けのリアルタイム Bid/Ask 可視化 OrderFlux は MT5 用のフットプリントおよびオーダーフローインジケーターです。価格がどこに動いたかだけでなく、その動きの中で何が起きているか(各価格レベルの Bid/Ask ボリューム、デルタ、インバランス、ボリューム分布)を表示します。 多くのチャートはローソク足の最終結果しか表示しません。OrderFlux はそこに至るまでの過程を表示します。ローソク足の形状だけでなく、市場参加者の動向を読み取りたい場合にまさに役立ちます。 ライブチャートにおいて、OrderFlux は主に次の3つの質問に答えます: 現在、どこで積極的な買いまたは売りの圧力が市場に参入しているか? どの価格レベルでボリュームが吸収、または拒否されているか? 現在の動きはセッションのコンテキスト(背景)にどう適合しているか? インターフェースで得られるもの メインチャートは、Canvas ベースでフットプリントを直接レンダリングします
OmniSync Projection
Antonio-alin Teculescu
5 (1)
Chronos Fractal Engine is an innovative price projection indicator for MetaTrader 5, designed to transform your technical analysis by intelligently identifying and projecting historical price patterns. Built upon an advanced correlation algorithm and the fractal principles of the market, this powerful tool visualizes potential future price movements, giving you a unique edge in your trading decisions. What is Chronos Fractal Engine? At its core, the Chronos Fractal Engine employs a sophisticat
トレンドラインプロ   市場の真の方向転換点を理解するのに役立ちます。この指標は、真のトレンド反転と主要プレーヤーが再び参入するポイントを示します。 分かりますか     BOSライン   複雑な設定や不要なノイズなしに、より長い時間足でのトレンドの変化と重要なレベルを把握できます。シグナルは再描画されず、バーが閉じた後もチャート上に残ります。 MT4バージョン   -   RFI LEVELS PRO インジケーター と組み合わせることで、その最大限の能力を発揮します インジケーターが示す内容: 本当の変化   トレンド(BOSライン) 一度シグナルが現れたら、それは有効です!これは、リペイント機能を持つインジケーターとの重要な違いです。リペイント機能を持つインジケーターは、シグナルを発した後、それを変更し、資金の損失につながる可能性があります。これにより、より高い確率と精度で市場に参入できます。また、矢印が現れた後、目標値(利益確定)に達するか、反転シグナルが現れるまで、ローソク足の色を変更する機能もあります。 繰り返しエントリ   主要プレーヤーの補充 エントリーポイントを探す
FX Levels: あらゆる市場における非常に高精度なサポート&レジスタンス 概要 通貨ペア、株式指数、個別銘柄やコモディティなど、どのような市場でも信頼できるサポートとレジスタンスを特定したいですか? FX Levels は伝統的な “Lighthouse” メソッドと先進的な動的アプローチを融合し、ほぼ汎用的な精度を実現します。ブローカーの実務経験を活かし、自動化されたデイリー更新とリアルタイム更新を組み合わせることで、 FX Levels は反転ポイントを見つけ、利益目標を設定し、自信をもってトレードを管理するための手助けをします。今すぐ試してみて、サポート/レジスタンス分析の正確性がどれほどトレードを向上させるかを実感してください! 1. FX Levels がトレーダーにとって非常に有用な理由 非常に正確なサポート&レジスタンスゾーン • FX Levels は異なるブローカー環境でもほぼ同一のゾーンを生成するよう設計されており、データフィードの差異や時刻設定のずれによる不一致を解消します。 • つまり、どのブローカーを利用していても一貫したレベルが得られるため、戦
作者のその他のプロダクト
The  Order Block Indicator for MT5  is a powerful tool designed for traders who use smart money concepts and institutional trading strategies. It automatically detects key order blocks on the chart, helping traders identify high-probability reversal and continuation zones. Key Features: • Automatic Order Block Detection – Highlights strong buying and selling zones based on price action and volume. • Multi-Timeframe Support – Analyze order blocks across different timeframes for better market in
FREE
The  Linear Regression Candles  indicator is a powerful tool that enhances traditional candlestick analysis by incorporating linear regression techniques. It helps traders visualize market trends more clearly by smoothing price movements and reducing noise. Unlike standard candles, Linear Regression Candles are dynamically calculated based on statistical regression, providing a clearer picture of the prevailing market direction. Key Features: • Trend Identification – Highlights the overall mar
FREE
The  Nadaraya-Watson Envelope  is a non-parametric regression-based indicator that helps traders identify trends, support, and resistance levels with smooth adaptive bands. Unlike traditional moving averages or standard deviation-based envelopes, this indicator applies the Nadaraya-Watson kernel regression , which dynamically adjusts to price movements, reducing lag while maintaining responsiveness. Key Features: • Adaptive Trend Detection – Smooths price action while remaining responsive to m
FREE
The Dual MACD & Stochastic Expert Advisor (EA)  is a fully automated trading system that utilizes two  MACD (Moving Average Convergence Divergence) indicators along with the  Stochastic Oscillator  to identify high-probability trading opportunities. By combining trend confirmation from MACD with momentum analysis from Stochastic, this EA provides precise entry and exit points for optimized trading performance. Key Features: • Dual MACD Strategy – Uses two MACD indicators with different setting
FREE
The   Chandelier Exit Indicator   for MT5 is a powerful tool designed to help traders manage trades by dynamically adjusting stop-loss levels based on market volatility. It is based on the   Average True Range (ATR)   and follows the trend, placing stop-loss levels above or below price action, depending on the trend direction. This makes it an effective tool for   trend-following strategies, breakout trading, and risk management . Key Features: •   Dynamic Stop-Loss Placement   – Adjusts stop-
FREE
The  Triple MACD Scalping EA  is a fully automated trading system designed for high-frequency scalping. It utilizes three different  MACD indicators  with varying settings to confirm strong market momentum and optimize entry and exit points. This strategy is ideal for short-term traders looking for quick profits in volatile market conditions. Key Features: • Triple MACD Confirmation – Uses three MACDs with different periods to filter false signals and confirm strong trends. • High-Frequency Sc
This strategy combines Linear Regression Candles with UT Bot Alerts to identify high-probability trading opportunities. It is designed for trend-following and breakout trading , making it suitable for multiple timeframes and market conditions. How It Works: • Linear Regression Candles smooth out price action, providing a clear visualization of the trend and reducing market noise. • UT Bot Alerts generate precise entry and exit signals by detecting strong momentum shifts. • Trade Entry: • Buy:
The  Zero Lag Least Squares Moving Average (ZLSMA)  is an advanced moving average indicator designed to provide  fast and smooth trend analysis  while eliminating lag. It is based on the  Least Squares Moving Average (LSMA)  but incorporates a zero-lag calculation, making it highly responsive to price changes. This indicator helps traders identify trend direction with minimal delay, making it ideal for both short-term and long-term trading strategies. Key Features: • Zero-Lag Calculation – Red
FREE
The  Kijun-Sen Envelope  is a powerful trend-following indicator based on the  Kijun-Sen  line from the Ichimoku Kinko Hyo system. This tool creates dynamic upper and lower bands around the Kijun-Sen, forming an envelope that helps traders identify market trends, potential reversals, and overbought/oversold conditions. Key Features: • Trend Confirmation – Helps determine whether the market is in a strong uptrend, downtrend, or ranging phase. • Support & Resistance Zones – The envelope acts as
FREE
This strategy uses Bollinger Bands and the Relative Strength Index (RSI) to identify potential trade opportunities. It is designed for both mean-reversion and trend-following approaches, making it suitable for various market conditions. How It Works: Bollinger Bands assess volatility and identify overbought/oversold conditions. RSI gauges momentum and confirms potential market reversals. Trade Entry: Buy: When the price reaches or falls below the lower Bollinger Band, and the RSI is below 30 (i
FREE
The  Andean Oscillator  is a powerful momentum-based indicator designed to help traders identify trends, reversals, and market strength with high precision. Inspired by traditional oscillators like the MACD and RSI, this unique tool smooths out price fluctuations and provides clearer signals for both entry and exit points. Key Features: • Momentum & Trend Detection – Helps traders spot bullish and bearish momentum shifts early. • Smoothed Oscillator – Reduces noise and provides more reliable t
FREE
The   MAAOS Expert Advisor   is a powerful automated trading system that combines   Moving Averages (MA)   and the   Andean Oscillator (AO)   to generate high-probability trading signals. By leveraging these two indicators, MAAOS identifies trend directions and momentum shifts with precision, allowing traders to enter and exit trades at optimal points. Key Features: •   Dual Indicator Strategy   – Uses Moving Averages to determine the overall trend and the Andean Oscillator to confirm entry an
FREE
This strategy integrates the  Nadaraya-Watson Envelope , Relative Strength Index (RSI) ,and  ATR Stop Loss Finder to identify high-probability trade setups with dynamic stop-loss placement. It is suitable for both  trend-following and mean-reversion trading styles . How It Works: • Nadaraya-Watson Envelope: A non-parametric regression-based indicator that smooths price action and identifies dynamic support and resistance zones. • RSI: Measures momentum and helps detect overbought/oversold cond
FREE
The  Supertrend Indicator for MT5  is a powerful trend-following tool designed to help traders identify market direction with precision. Based on the Average True Range (ATR), it dynamically adjusts to price movements, making it suitable for various trading styles, including scalping, day trading, and swing trading. Key Features: • Accurate Trend Detection – Clearly identifies bullish and bearish trends with a color-coded trend line. • ATR-Based Volatility Adjustment – Adapts to market conditi
FREE
The  Average Force Indicator  is a technical analysis tool designed to measure the strength of price movements by analyzing both momentum and volatility. This indicator is based on the  Force Index , which combines price changes and volume data, but with a smoothing mechanism to provide a clearer and more stable reading of market dynamics. Key Features: • Momentum and Trend Strength Measurement – Helps traders identify the intensity of buying or selling pressure. • Smoothed Force Index Calcula
FREE
The  ATR Finder  indicator for MT5 is a powerful tool designed to help traders analyze market volatility using the  Average True Range (ATR) . This indicator calculates and displays ATR values dynamically, allowing traders to identify periods of high and low volatility, optimize stop-loss and take-profit levels, and refine their trading strategies. Key Features: • Real-time ATR Calculation – Continuously updates ATR values to reflect current market conditions. • Customizable Settings – Adjust
FREE
The  Box Range Indicator  for MT5 helps traders visualize key price zones by automatically detecting and highlighting market structures. It dynamically draws upper, lower, and middle levels based on price action, making it an effective tool for identifying  support and resistance zones, breakouts, and trend reversals . Key Features: • Automatic Box Detection – Identifies price ranges based on market movements. • Dynamic High and Low Updates – Adjusts in real time to reflect market conditions.
FREE
The  Momentum & EMA Expert Advisor (EA)  is a fully automated trading system that combines  two Momentum indicators  with  Exponential Moving Averages (EMA)  to identify high-probability trade opportunities. This EA leverages momentum strength and trend confirmation to execute precise entries and exits. Key Features: • Dual Momentum Strategy – Uses two Momentum indicators with different periods to confirm price acceleration. • EMA Trend Confirmation – Trades are opened only when the EMAs align
This strategy combines  three Moving Averages (MAs)  with  Williams Fractals  to identify strong trends and optimal trade entry points. It is designed for traders looking for a simple yet effective approach to follow market trends and capture profitable opportunities. How It Works: • Three Moving Averages (fast, medium, and slow) help determine the overall trend direction. • Williams Fractals identify local highs and lows, signaling potential reversals or trade entries. • Trade Entry occurs wh
This strategy integrates the   Average Force Indicator ,   Andean Oscillator , and   MACD   to identify strong trends, momentum shifts, and optimal trade entry points. It is designed for traders who seek a balanced approach between trend-following and momentum trading. How It Works: •   Average Force Indicator   measures market strength, filtering out weak trends and confirming strong movements. •   Andean Oscillator   identifies momentum shifts and trend continuation signals. •   MACD (Moving
This strategy is designed for  high-frequency scalping , utilizing the  Daily High/Low  levels and the  Andean Oscillator  to identify optimal trade opportunities. It works best in volatile market conditions where price frequently reacts to key levels. How It Works: • Daily High/Low Levels act as dynamic support and resistance zones where price often consolidates or reverses. • Andean Oscillator measures momentum shifts and trend strength, confirming entries with high precision. • Trade Entry:
Harness institutional strategies with Institutional VWAP Reversal EA: Capture reversals via VWAP deviation bands, volume spikes, and 200 EMA trend filter. Targets 5% monthly profit with 5% max daily DD, including profit caps, breakeven SL, and signal reversal options—ideal for prop-trading challenges. Customize TP/SL by percentages, RR, or candles; trade with trend or both sides. Optimized for forex majors and gold, with time-restricted execution for low-risk, reliable automation in volatile mar
フィルタ:
レビューなし
レビューに返信