Supply and Demand Multitimeframe MT5
- インディケータ
- バージョン: 1.1
- アップデート済み: 18 4月 2022
- アクティベーション: 5

Supply and Demand Multitimeframe
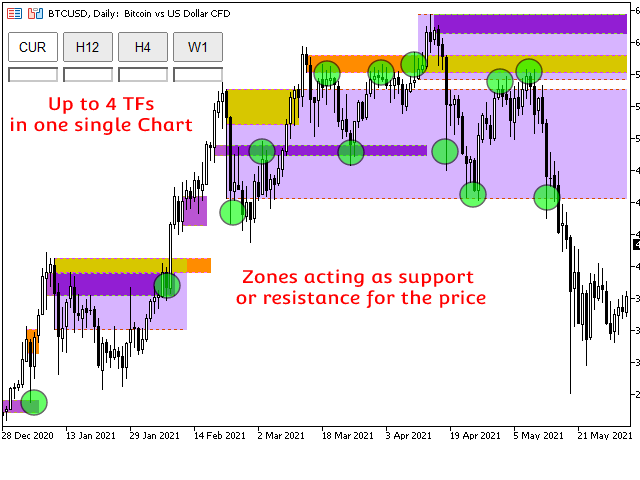
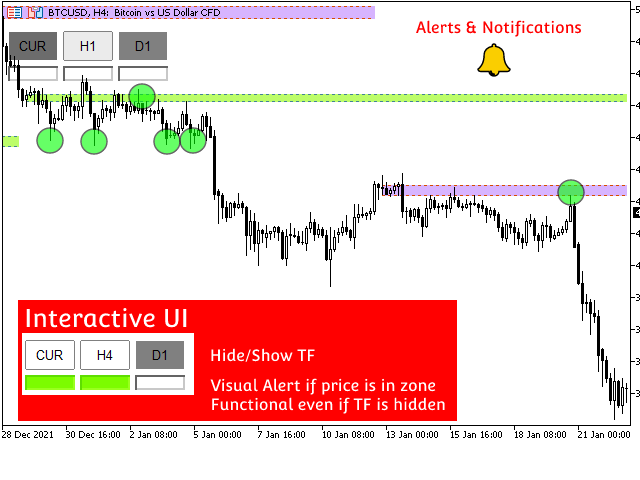
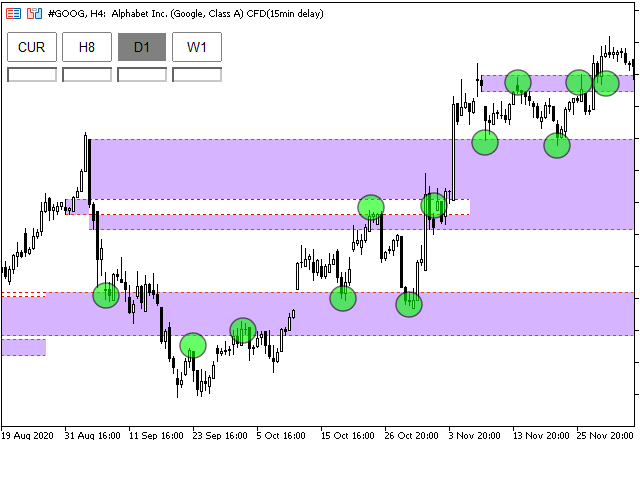
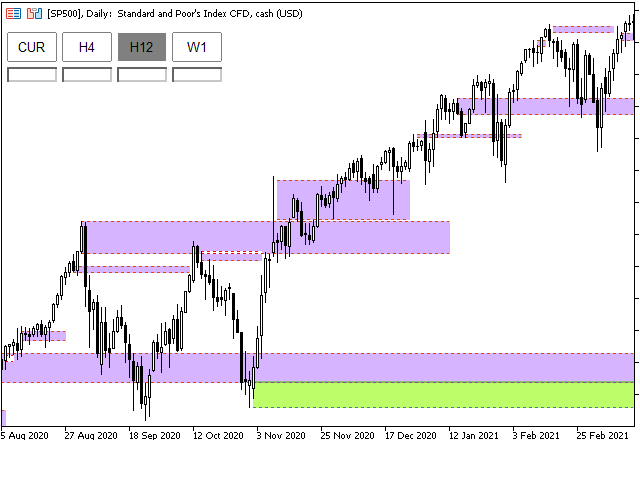
Supply and Demand Multitimeframe is the first indicator in the market that combines multiple aspects like trading volume, price structure and momentum to identify Supply and Demand zones for every asset. The Supply and Demand indicator analyzes simultaneously up to 4 different TFs and represents their information in the current graph. Its interactive UI highlights everytime the price enters a Supply or Demand zone even if the zones are not visible in your current window. You can also click on the TF buttons to change the visualization mode from Hide to Show.
Supply and Demand zones are created by banks and institutions and indicate price levels with a big ammount of unfulfilled orders. Price uses to come back to this zones and bounce out of them until all orders get fulfilled. Once all orders get fullfilled the price goes through these levels coming back at them to support the following movement.
Some of the characteristics of the indicator are the following:
- Time saving
- Highly customizable
- Plenty of information without overloading the chart
- Multi-timeframe up to 4 simultaneous TFs
- Functional on all pairs (Cryptos, Forex, Stocks, Indices, Commodities...)
- Possible reversal zones or bounces for new trends
- Sofisticated Alerts and Notifications System
Input parameters
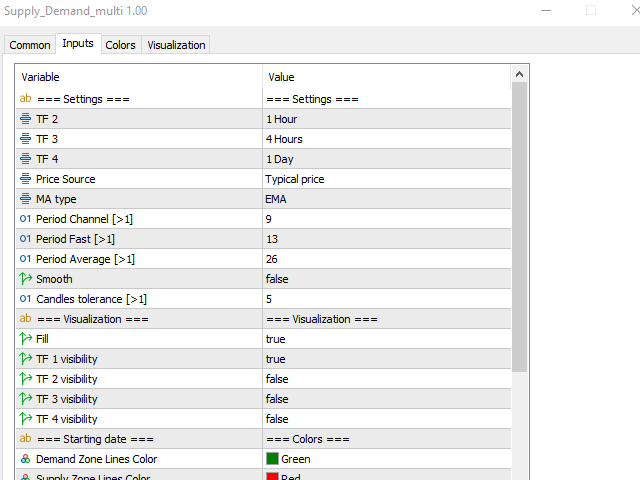
Settings
- TF 2,3,4: Timeframes to represent
- Price Source, MA type, Channel, Fast and Average Periods for the algorithm calculations
- Candles tolerance: Tolerance value. Higher values means less but more powerfull zones
Visualization
- Fill: Fill zones
- TF 1, 2, 3, 4: TFs Visibility. TF 1 is always the current TF
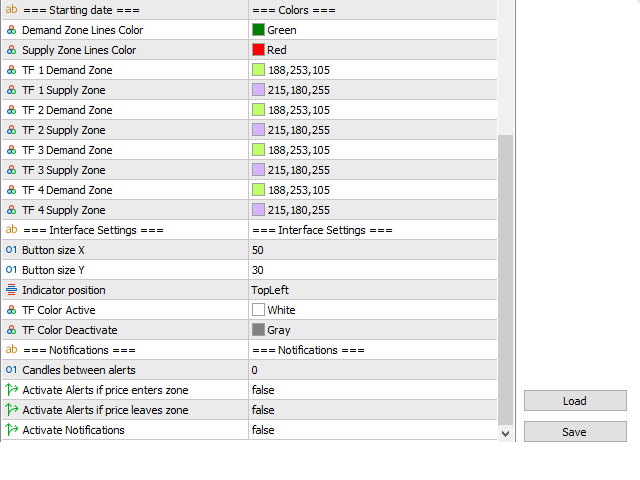
Colors
- Supply and Demand lines color
- Supply and Demand filling color for the different TFs
Interface Settings
- UI interfaces size, position and colors
Notifications
- Candle number between alerts
- Alerts and notifications if price enters or leave a zone
Author


ユーザーは評価に対して何もコメントを残しませんでした