FX Fishing
- インディケータ
- バージョン: 1.0
- アクティベーション: 5

Yasha Firooz について
Yasha は 2012 年に資産管理会社のスタッフでした。
彼はさまざまな事務および技術業務を委任され、資産管理チームの一部と創設者のニーズを橋渡しすることができました。資産管理会社はトレーディング業界に多額の投資をしていました。
FX Fishing MT4 (Meta Trader 4 インジケーター) について
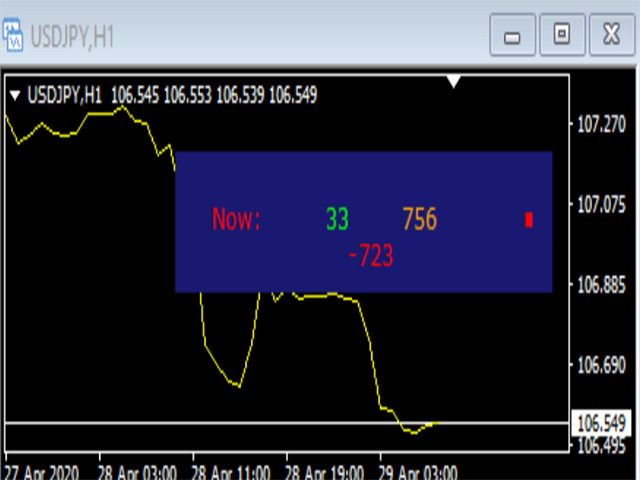
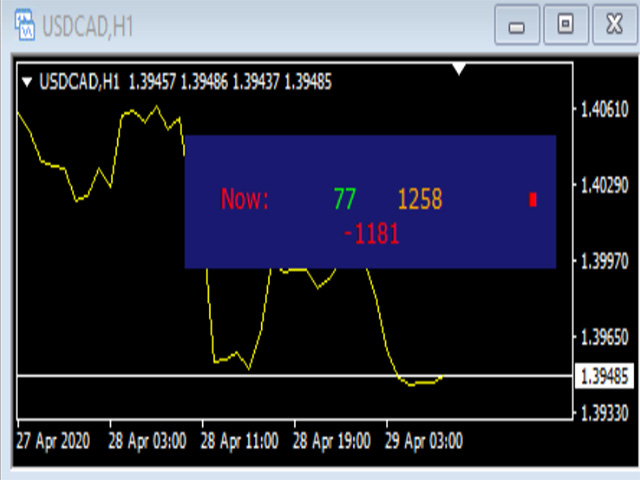
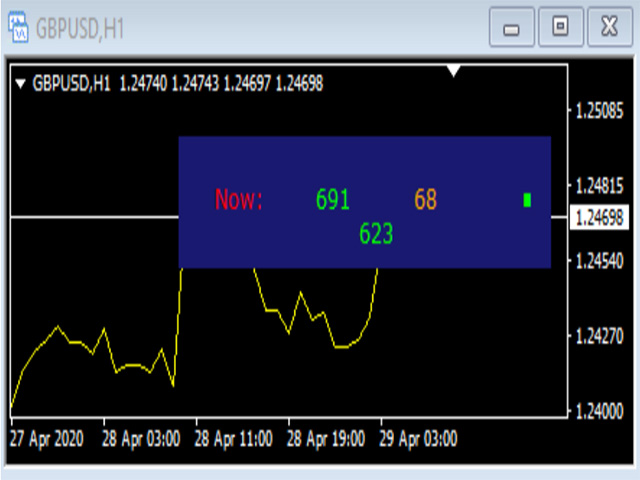
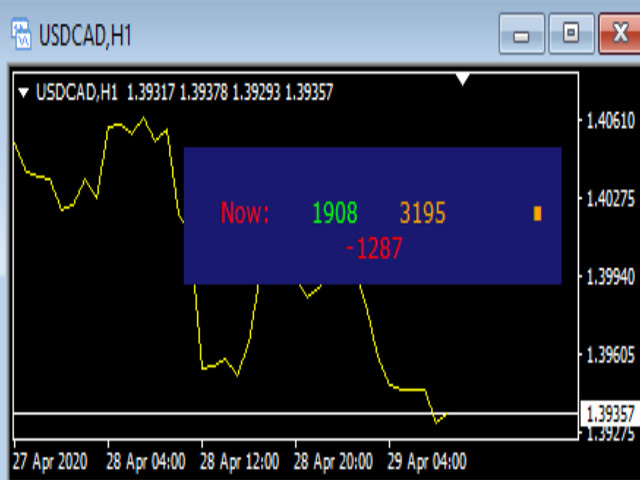
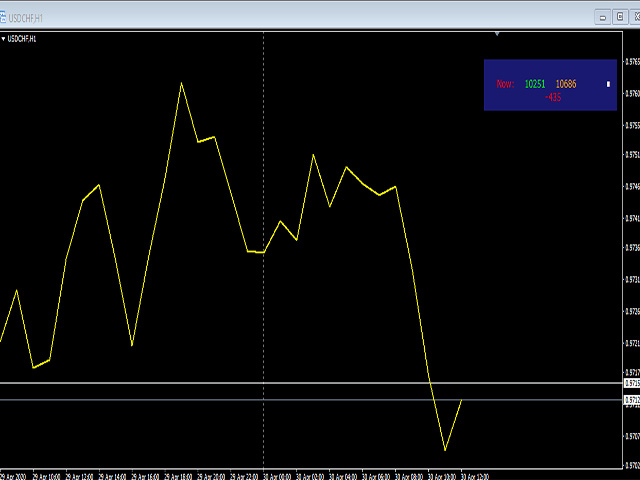
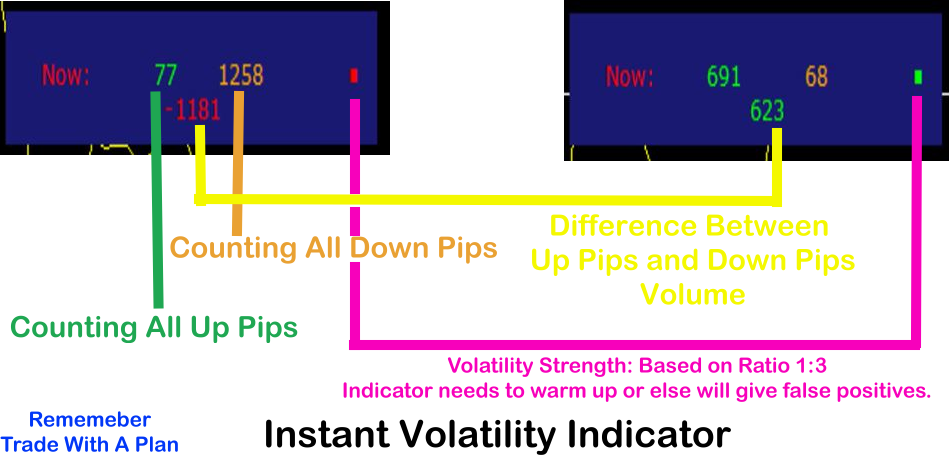
Yasha は市場のボラティリティに悩まされ、強気相場と弱気相場の間の市場の波を感じることができるかどうか考えていました。そのため、まさにそれを実現するインジケーターを考案しました。すべての上昇ピップがカウントされ、すべての下降ピップがカウントされます。これらの 2 つのティックは、以下のインジケーター画像のように表示されます。
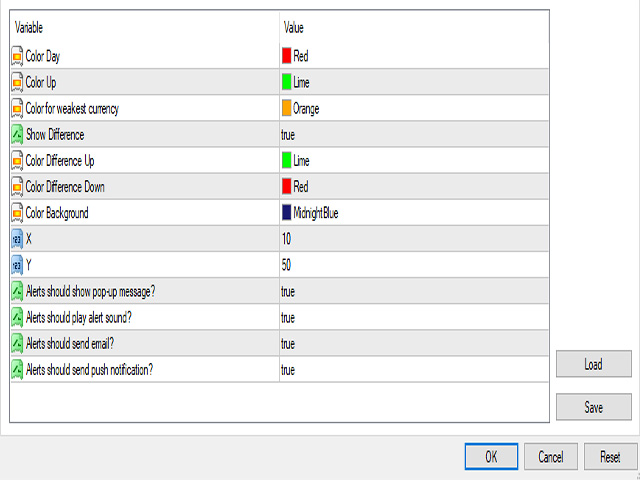
- 緑の数字 (上昇ティック/ピップ)
- オレンジ色の数字 (下降ティック/ピップ)
中央の下に表示される数字は、上昇ボラティリティと下降ボラティリティの差です。
強い強気または弱気のボリュームを示します。
フィッシング インジケーターは、右側のカラー ドットで示される 1:2 の比率で動作します。
緑 = 強気
赤 = 弱気
オレンジ = 横ばい
比率は右側のカラー ドットに表示されます。
このインジケーターは、いくつかの方法で取引に役立ちます。
デモを試して、自分のスタイルに最適なものを見つけてください。
*注: これは非常に直感的なインジケーターです。
価格を 45 ドルから 30 ドルに下げました
FX フィッシング MT5 の使用方法
(トレンド)
1. フィッシング インジケーターをチャートに挿入し、少なくとも 10 分または 30 分ほど待ちます。
ドットに 1:2 の比率の方向が表示されます。その後、取引を選択できます。
完了したら: インジケーターをチャートから取り外して再度適用し、上記の手順を繰り返します。
(スキャルピング)
2. これは私のお気に入りです。インジケーターをチャートに挿入します。
次に、そのチャートをテンプレートに保存します。たとえば、クイック フィッシュという名前を付けます。
ティック差計算機をしばらく見ます。すると、移動差が非常に明らかになります。次に、その方向に取引します。次に、マネーでクローズします。次に、クイック フィッシュ テンプレートを再度挿入します。これを繰り返します。
ゴールデン トレーダーのルールを覚えておいてください
ランダムに取引するだけではギャンブルです。
- 資金管理をしっかり行う。
- 確認をしっかり行う。
- いつ参入するかを知る。
- いつ撤退するかを知る。
- ストップ ロスの使用を恐れない。
- トレイル ストップは実装すると良い場合があります。
- 常に学習しているので、自分自身に過度に批判的にならないで、赤ちゃんでさえ歩くことを学ばなければなりませんでした。
- 歩く心理学を身につけることは必須です。
- 経済カレンダーと市場クロスオーバーはボラティリティに影響します。
Yasha のトレードアファメーションのルール
1: 恐怖でトレードしない
2: 貪欲でトレードしない
3: 復讐トレードしない
4: 取り逃がしの恐怖に影響されない (トレードをしない、またはトレードから早く抜ける)
5: トレードルールを忠実に守ります。
FX Fishing をお試しいただきありがとうございます。5 つ星のレビューを残してください。