FX Fishing
- 지표
- 버전: 1.0
- 활성화: 5

Yasha Firooz에 대한 정보
Yasha는 2012년에 자산 관리 회사의 직원이었습니다.
그는 다양한 사무 및 기술 업무를 위임받았으며, 일부 자산 관리 팀과 설립자의 요구 사항을 연결할 수 있었습니다. 자산 관리 회사는 거래 산업에 많은 투자를 했습니다.
FX Fishing MT4(Meta Trader 4 지표)에 대한 정보
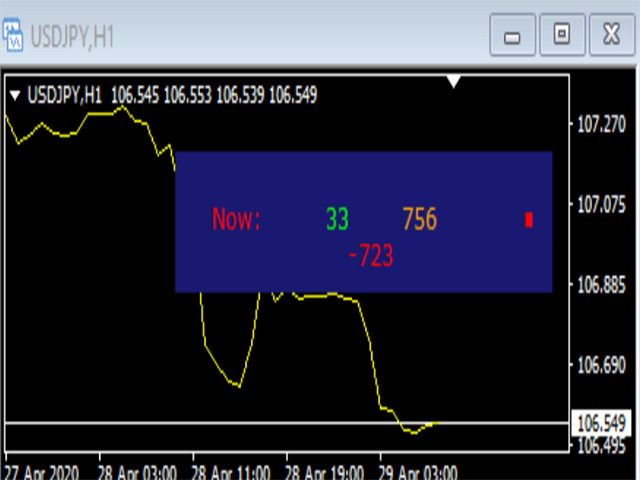
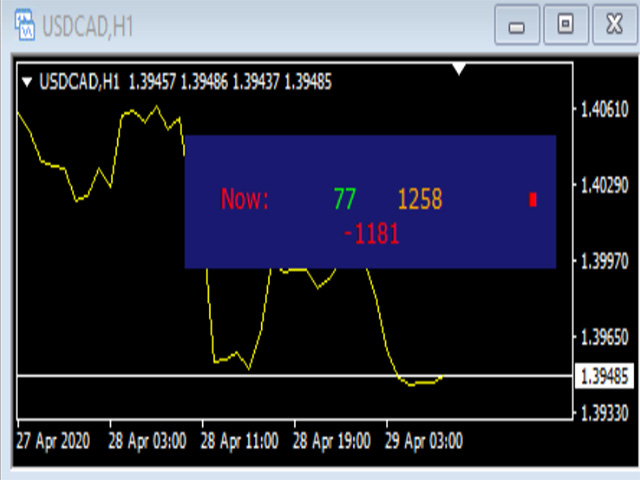
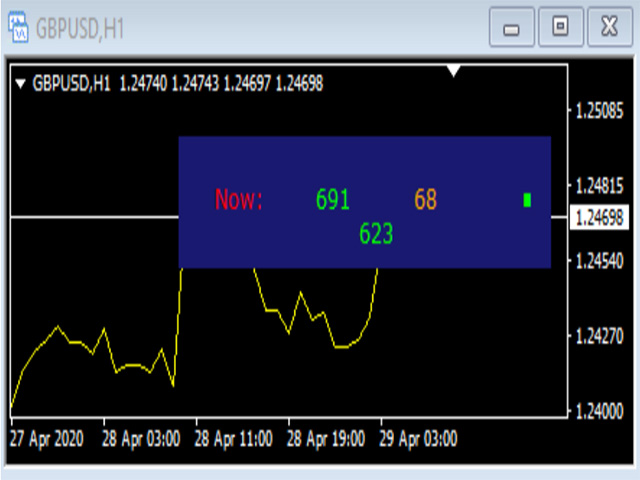
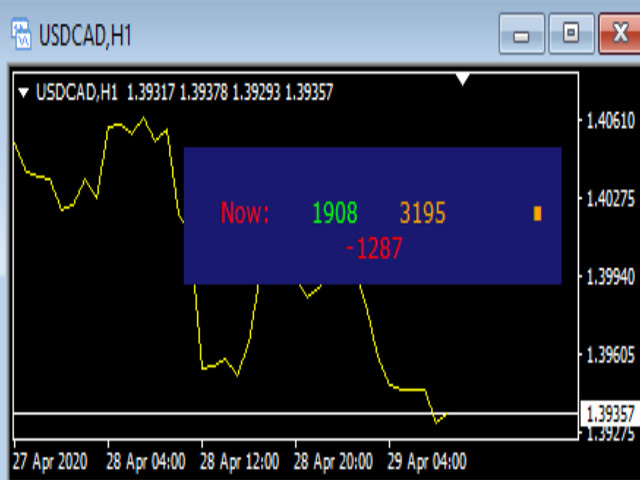
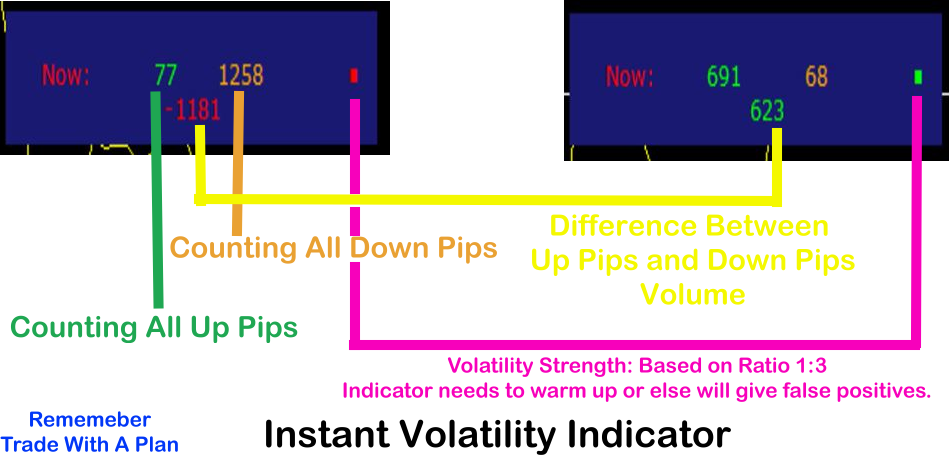
Yasha는 시장 변동성에 대해 걱정했고, 황소와 곰 사이의 시장 파동을 느낄 수 있는지 고민했습니다. 따라서 그렇게 할 수 있는 지표를 전략화했습니다. 모든 상승 핍은 계산되고 모든 하락 핍은 계산됩니다. 이 두 개의 틱은 아래에 표시된 지표 이미지와 같이 표시됩니다.
- 녹색 숫자(상승 틱/핍)
- 주황색 숫자(하락 틱/핍)
중앙 아래에 표시된 숫자는 상승 및 하락 변동성의 차이입니다.
강한 황소 또는 곰 볼륨을 나타냅니다.
낚시 지표는 1:2 비율로 작동하며, 오른쪽의 색상 점에 표시됩니다.
녹색 = 황소
빨간색 = 곰
주황색 = 측면
비율은 오른쪽에 표시되는 색상 점에 표시됩니다.
이 지표는 거래에 도움이 되는 몇 가지 방법이 있습니다.
데모를 시도해 보고 자신의 스타일에 가장 적합한 지표를 찾을 수 있습니다.
*참고: 이것은 매우 직관적인 지표입니다.
저는 가격을 $45에서 $30으로 떨어뜨렸습니다.
FX Fishing MT5를 사용한 방법
(추세)
1. 차트에 낚시 지표를 삽입하고 최소 10~30분 정도 기다립니다.
점은 방향의 1:2 비율을 표시합니다. 그런 다음 거래를 선택할 수 있습니다.
완료되면: 차트에서 지표를 제거하고 다시 적용하고 위의 지침을 반복합니다.
(스캘핑)
2. 이것은 제가 가장 좋아하는 방법입니다. 차트에 지표를 삽입합니다.
그런 다음 해당 차트를 템플릿에 저장합니다. 예를 들어, 빠른 물고기라고 이름을 지정할 수 있습니다.
저는 잠시 틱 차이 계산기를 볼 것입니다. 그러면 움직임 차이가 매우 분명해질 것입니다. 그런 다음 해당 방향으로 거래합니다. 그런 다음 돈을 마감합니다. 그런 다음 빠른 물고기 템플릿을 다시 삽입합니다. 그리고 반복합니다.
골든 트레이더의 규칙을 기억하세요
무작위로 거래하는 것은 도박입니다.
- 좋은 자금 관리를 하세요.
- 엄격한 확인을 하세요.
- 언제 들어갈지 아세요.
- 언제 나갈지 아세요.
- 손절매를 사용하는 것을 두려워하지 마세요.
- 트레일 스톱은 구현하기 좋은 방법입니다.
- 항상 배우고 있으므로 자신을 지나치게 비판하지 마세요. 아기조차도 걷는 법을 배워야 했습니다.
- 트레딩 심리학을 습득하는 것이 필수입니다.
- 경제 달력과 시장 교차는 변동성에 영향을 미칩니다.
야샤 거래 규칙 확언
1: 두려움 속에서 거래하지 않을 것입니다.
2: 탐욕 속에서 거래하지 않을 것입니다.
3: 거래에 대한 복수를 하지 않을 것입니다.
4: 미스아웃에 대한 두려움(거래를 하지 않거나 일찍 거래를 끝내는 것)에 영향을 받지 않을 것입니다.
5: 거래 규칙을 종교적으로 따릅니다.
FX Fishing을 시도해 주셔서 감사합니다. 5점 만점에 5점 리뷰를 남겨주세요.