Non Repaint Trend Bands
- インディケータ
-
Ravshan Chuliev
 Hello! I’m an MQL5 developer with over 5 years of experience, specializing in automated trading robots (EAs), custom indicators, and scripts. My goal is to create efficient and reliable tools tailored to traders’ needs. I offer fast delivery, high-quality solutions, and a personalized approach to
 - バージョン: 5.2
- アップデート済み: 12 7月 2026
- アクティベーション: 10
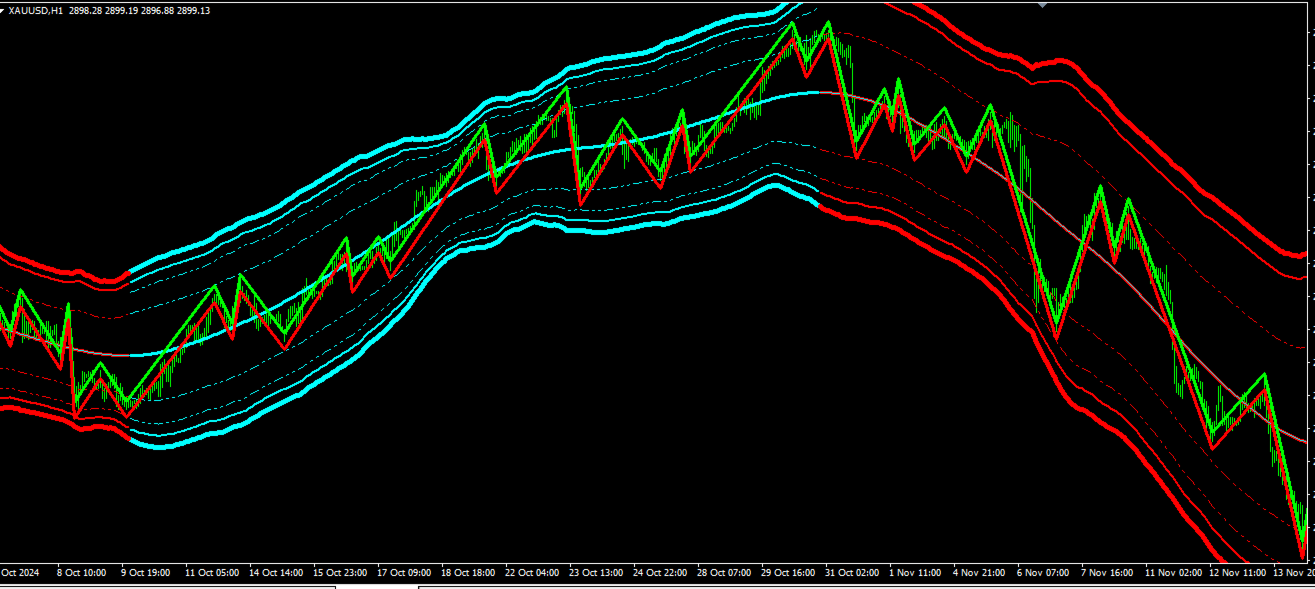
Channel Trend Bands MTF – A Comprehensive Indicator for Market Analysis
Simple to Use, Effective in Application
User-Friendly and Suitable for All Traders
This indicator stands out due to its straightforward functionality. Whether you're a beginner exploring the market or an experienced trader refining your strategy, this tool offers valuable insights. Using a Triangular Moving Average (TMA) with additional ATR-based bands, it provides structured market data to support well-informed decision-making.
Identify Market Trends with Ease
This tool helps in recognizing the market's trend direction and assessing its momentum. The Slope (Angle) value indicates whether the market is moving strongly upward or downward. A positive slope suggests an upward movement, while a negative slope points to a downward trend.
Advanced Multi-Band Calculation System
The four upper and lower bands offer a structured view of market volatility, making trend interpretation more precise. Combined with TMA, this system helps in evaluating market fluctuations effectively.
Customizable and Adaptable Settings
With flexible parameters, this indicator allows users to adjust settings such as ATR Period and Band values to align with different trading strategies and market conditions.
If you are looking for a structured, non-repainting tool to analyze market trends effectively, the "Channel Trend Bands" indicator is designed to assist in your decision-making process.
Created by: Ravshanfx


Amazing product, I use it as a trend