Netsrac Paaios Supply Demand EURCHF

5
This is the free version of the Supply&Demand + Trendline + Trend tool. This version works only with EURCHF! You find the full version here: https://www.mql5.com/en/market/product/67274


PAAIOS

stands for Price Action All In One Solution. And that is the purpose of the Indicator. It should give you a tool to improve your trading decisively because you get the crucial information at a glance. The indicator simplifies the search for strong signals. It shows trend lines, demand and supply zones from freely selectable time frames.
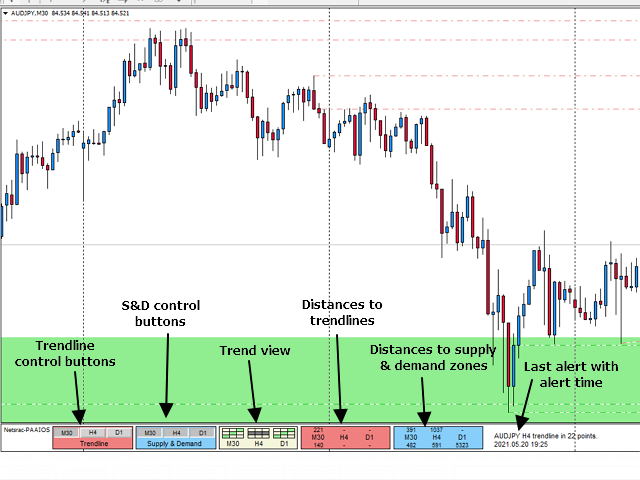
Features

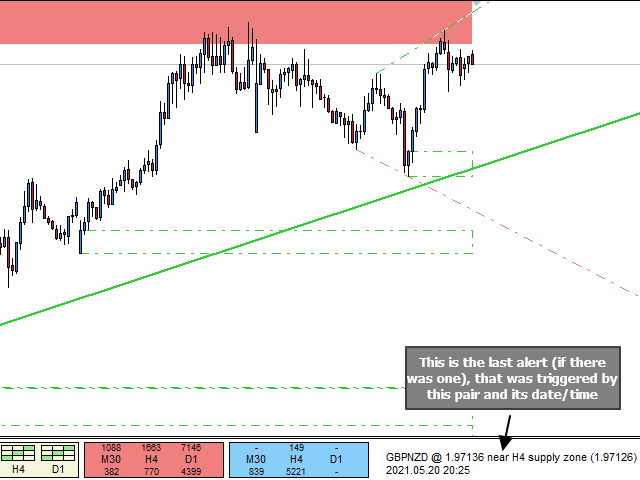
  • detects multi time frame supply & demand zones
  • detects and shows multi time frame trendlines
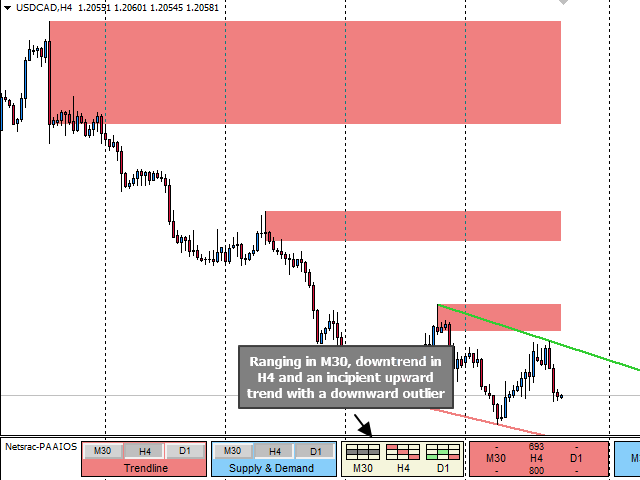
  • detects the trend behaviour in multiple time frame - the big picture at a glance
  • alerts you (screen, notification, mail), if a zone / trendline is near price
  • uses an intelligent algorithm to calculate only strong supply & demand zones

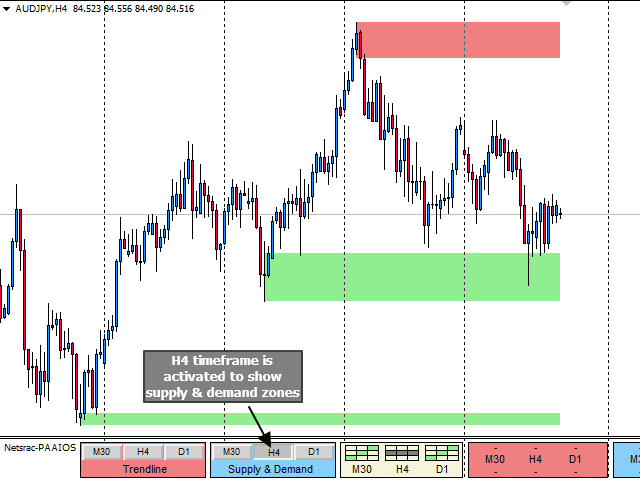
Supply & Demand - how it works

PAAIOS uses an internal zigzag to calculate multi time frame zigzags to get swings. That´s nothing special. But PAAIOS is measuring all swings and consider only the zones from which really remarkable swings started. So you get really strong buyer and seller zones from multiple time frames

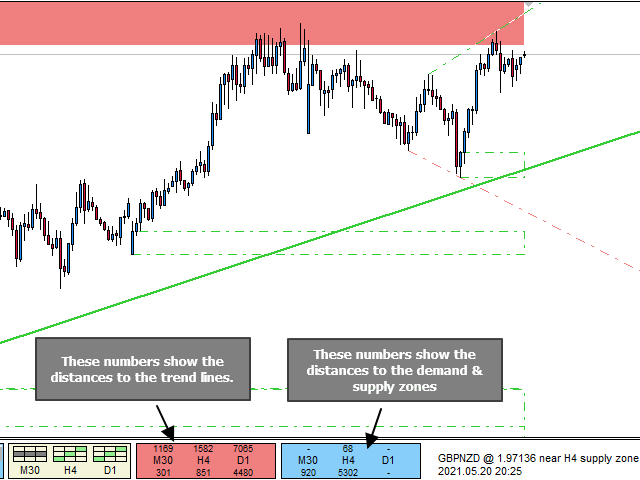
Trendlines - how it works

PAAIOS uses the internal zigzag to calculate the trendlines too. That´s nothing special. But if you use trendlines from higer timeframes and in combination with supply & demand you you get indications of really strong zones where a reaction of the price is very likely. 

Trend section - how it works

Finally, the trend section shows you what state the asset is in. Is it in an uptrend, do we have a ranging zone? The trend algorithm uses classic rules of market technique, such as higher highs, lower lows, and so on. The trend section gives you a really helpful big picture.


Please read my blog entry for a description of the functions.

!Feature Freeze - Version 2.0 is the last free version of this product! - My free products no longer get any updates. Unfortunately, I don't get any recognition for my work and I can't feed my family with it either. Sorry.


レビュー 1
wuzzy66
1008
wuzzy66 2022.10.13 17:05 
 

i was actually amazed at the performance of this indicator very unusual for me to try an indicator and buy the paid version in less than 2hrs .i have tried different indicator this truly stands out you are able to make informed decision once you place it on the chart and you are alerted when trendline touches price in either the 30mins 4hrs or daily time frame also you get alert when price is the the supply or demand zone would have given it a 7 star if possible positive instant change in my trading account and the author response fast

おすすめのプロダクト
マルチタイムフレーム対応、カスタマイズ可能なビジュアル信号、設定可能なアラートシステムを備えた相対力指数(RSI)インジケーター。 フリーランスプログラミングサービス、アップデート、その他のTrueTL製品は私の MQL5プロフィール からご利用いただけます。 フィードバックとレビューを心よりお待ちしております! RSIとは? 相対力指数(RSI)は、価格変化の速度と大きさを測定するモメンタムオシレーターです。このインジケーターは0から100の間で振動し、指定された期間にわたって最近の上昇幅と最近の下落幅の大きさを比較します。 RSIは主に買われすぎと売られすぎの状態を識別するために使用されます。高い値は買われすぎ状態を示し、低い値は売られすぎ状態を示します。トレーダーはまた、RSIと価格動作の間のダイバージェンスにも注目しており、これは潜在的なトレンド転換を示す可能性があります。 機能: 矢印と垂直線を使用したビジュアルシグナルマーカー 設定可能なトリガー付きの3つの独立したシグナルバッファ(方向変化、レベル交差、ピーク/谷、極端ゾーン) 時間帯フィルタリング付きの設定可能なア
FREE
Mirror chart
Salavat Yulamanov
4.5 (2)
このインジケーターは 1 つのチャートに 2 つの異なるペアを表示し、表示される情報を簡素化するように設計されています。   ターミナルで利用可能なほぼすべての商品(通貨ペアだけでなく、金属や原材料も)を扱うことができます。 あらゆる通貨ペアに対して視覚的な相関手法を使用する機能 サブシンボル。 通貨ペアは色付きのキャンドルで画面に表示されます。 これは同じ相関ペアです。 ミラーリング。 補助通貨。 このインジケーターは 2 種類の相関関係を反映します。 設定 サブシンボル = "USDCHF";   BullBarColor = オレンジレッド;   BearBarColor = 黄色;   color GridColor = 白;   ミラーリング = false;  The indicator displays two different pairs on one chart, designed to simplify the displayed information,   Capable of working with almost all instruments
FREE
このプロジェクトが好きなら、5つ星レビューを残してください。 このインジケータは、指定されたためのオープン、ハイ、ロー、クローズ価格を描画します 特定のタイムゾーンの期間と調整が可能です。 これらは、多くの機関や専門家によって見られた重要なレベルです トレーダーは、彼らがより多くのかもしれない場所を知るために有用であり、 アクティブ。 利用可能な期間は次のとおりです。 前の日。 前週。 前の月。 前の四半期。 前年。 または: 現在の日。 現在の週。 現在の月。 現在の四半期。 現年。
FREE
Candle Time (MT4) The Candle Time indicator shows the remaining time for the current candle on the active chart timeframe. It adapts automatically to the chart period and updates on every tick. This is a charting utility; it does not provide trading signals and does not guarantee any profit. Main functions Display the time remaining for the current candle on any timeframe (M1 to MN). Color-coded state: green when price is above the open (up), gray when unchanged, and red when below the open (do
FREE
Free automatic Fibonacci is an indicator that automatically plots a Fibonacci retracement based on the number of bars you select on the BarsToScan setting in the indicator. The Fibonacci is automatically updated in real time as new highest and lowest values appears amongst the selected bars. You can select which level values to be displayed in the indicator settings. You can also select the color of the levels thus enabling the trader to be able to attach the indicator several times with differe
FREE
QuantumAlert CCI Navigator is a free indicator available for MT4/MT5 platforms, its work is to provide "alerts" when the market is inside "overbought and oversold" regions in the form of "buy or sell" signals. This indicator comes with many customization options mentioned in the parameter section below, user can customise these parameters as needful. Join our   MQL5 group , where we share important news and updates. You are also welcome to join our private channel as well, contact me for the pri
FREE
WindFlow HTF is a useful tool suited to use in conjunction together with my WindFlow indicator. This indicator will give you a background vision about the price action trend on a higher timeframe, so when it runs with the WindFlow indicator you have an almost complete trading solution. At this point, you only need some support/resistance analysis and a bit of focus to become a consistent trader. The metaphorical "wind's ballet" Professional traders know that every timeframe is governed by its o
FREE
The indicator displays signals according to the strategy of Bill Williams on the chart. Demo version of the indicator has the same features as the paid, except that it can work only on a demo account . Signal "First Wise Man" is formed when there is a divergent bar with angulation.  Bullish divergent bar - with lower minimum and closing price in the upper half. Bearish divergent bar - higher maximum and the closing price at the bottom half. Angulation is formed when all three lines of Alligator
FREE
Follow The Line
Oliver Gideon Amofa Appiah
3.94 (16)
FOLLOW THE LINE GET THE FULL VERSION HERE: https://www.mql5.com/en/market/product/36024 This indicator obeys the popular maxim that: "THE TREND IS YOUR FRIEND" It paints a GREEN line for BUY and also paints a RED line for SELL.  It gives alarms and alerts of all kinds. IT DOES NOT REPAINT and can be used for all currency pairs and timeframes. Yes, as easy and simple as that. Even a newbie can use it to make great and reliable trades. NB: For best results, get my other premium indicators for more
FREE
Free informative Indicator-helper. It'll be usefull for traders who trade many symbols or using grid systems (Averaging or Martingale). Indicator counts drawdown as percent and currency separate. It has a number of settings: Count deposite drawdown according equity value and send e-mail or notifications to user if DD more than set; Sending e-mail when max open orders reached; Shows price and remaining pips amount before MarginCall on current chart and Account generally; Display summary trade lot
FREE
Market Profile 3
Hussien Abdeltwab Hussien Ryad
3 (2)
Market Profile 3 MetaTrader 4 indicator  — is a classic Market Profile implementation that can show the price density over time, outlining the most important price levels, value area, and control value of a given trading session. This indicator can be attached to timeframes between M1 and D1 and will show the Market Profile for daily, weekly, monthly, or even intraday sessions. Lower timeframes offer higher precision. Higher timeframes are recommended for better visibility. It is also possible t
FREE
YOU CAN NOW DOWNLOAD FREE VERSIONS OF OUR PAID INDICATORS . IT'S OUR WAY OF GIVING BACK TO THE COMMUNITY ! >>>    GO HERE TO DOWNLOAD The Volatility Ratio was developed by Jack D. Schwager to identify trading range and signal potential breakouts. The volatility ratio is defined as the current day's true range divided by the true range over a certain number of days N (i.e. N periods). The following formula is used to calculate the volatility ratio: Volatility Ratio (VR) = Today's True Range/Tru
FREE
MASi Three Screens is based on the trading strategy by Dr. Alexander Elder. This indicator is a collection of algorithms. Algorithms are based on the analysis of charts of several timeframes. You can apply any of the provided algorithms. List of versions of algorithms:     ThreeScreens v1.0 - A simple implementation, with analysis of the MACD line;     ThreeScreens v1.1 - A simple implementation, with analysis of the MACD histogram;     ThreeScreens v1.2 - Combines the first two algorithms in
FREE
The Night Scalper EA Lite is a fully automated Expert Advisor that trades at night and relies on price reversion. The EA trades using market orders and has the option to use time averaging to improve performance. This EA works best on EURUSD using the M5 timeframe, but will also work on AUDUSD, GBPUSD, NZDUSD, USDCAD, USDCHF and likely many more. A VPS is advisable when trading this system and a low spread and commission based broker is best. Check the comments for back test results and optimiz
FREE
Custom Pattern Detector Indicator This indicator lets you define your own custom pattern instead of the typical candlestick patterns. Everybody already knows about common candlestick patterns like the Doji pattern. This indicator is different though. The pattern you will define is a custom pattern based on CANDLE FORMATIONS . Once the indicator knows the pattern you want it to look for, then it will go through history on the chart and find matching patterns, make them visible to you, and calcula
FREE
Simple RSI Forex Trading Strategy
Victor Manuel Valderrama Zamora
4 (1)
Diversify the risk in your trading account by combining our Expert Advisors. Build your own custom trading system here:   Simple Forex Trading Strategies The expert advisor opens trades when RSI indicator enter in oversold or overbought areas. The Stop Loss, Take Profit, and Trailing Stop are calculated based on the ATR indicator. The recommended currency pair is EURGBP and the recommended timeframe to operate and to do backtests is H4. This Expert Advisor can be profitable in any TimeFrame an
FREE
MA 2 Histogram
Pavel Shutovskiy
4.5 (2)
The indicator is based on two Moving Averages. Its only difference from traditional indicators is that it is presented as a histogram. The histogram has four colors; each color represents a MA with its own period. In case of a descending trend, if a price is lower than a moving average, the indicator displays a value lower than the red zero level. In case of ascending trend, the indicator value is higher than the green zero level. Parameters: Period MA 1 - Period of the first moving average. MA
FREE
This indicator collects and organizes spread data. It is an organic add-on to my news robot, ExpertNews , which can be downloaded here . You can also watch a video about news trading using the ExpertNews robot. It is available on youtube . Unfortunately, it is not possible to place the robot in the mql5.com store, because the automatic validation of ExpertNews by the mql5 service ends in failure. In reality, there are no errors in the robot. Testing fails due to the fact that the advisor is
FREE
Zig Zag 123 tells us when a reversal or continuation is more likely by looking at the shift in supply and demand. When this happens a signature pattern appears known as 123 (also known ABC) will often break out in direction of higher low or lower high. Stop loss and take profit levels have been added. There is a panel that shows the overall performance of your trades for if you was to use these stop loss and take profit levels.  We get alerted if a pattern 123 appears and also if the price re
FREE
QuantumAlert RSI Navigator is a free indicator available for MT4/MT5 platforms, its work is to provide "alerts" when the market is inside "overbought and oversold" regions in the form of "buy or sell" signals. This indicator comes with many customization options mentioned in the parameter section below, user can customise these parameters as needful. Join our   MQL5 group , where we share important news and updates. You are also welcome to join our private channel as well, contact me for the pri
FREE
This indicator has been created for finding the probable reversal points of the symbol price. A small candlestick reversal pattern is used it its operation in conjunction with a filter of extremums. The indicator is not redrawn! If the extremum filter is disabled, the indicator shows all points that have a pattern. If the extremum filter is enabled, the condition works – if the history Previous bars 1 candles back contains higher candles and they are farther than the Previous bars 2 candle, such
FREE
RSI Divergence MT4を紹介します。これは、価格の動きとRSI(相対力指数)の関係を分析することでトレンドの反転を特定するために設計された強力なインジケーターです。意思決定プロセスを強化したいトレーダーに最適で、このツールはダイバージェンスパターンに基づいて潜在的な売買シグナルの洞察を提供します。 強気および弱気のダイバージェンスの両方を検出する能力を持つRSI Divergence MT4は、トレーダーがトレンドの弱まりを見つけ、エグジット戦略を最適化するのを助けます。経験豊富なトレーダーでも初心者でも、このインジケーターはトレーディングの成果を大幅に改善することができます。 MQL製品のインストールガイド | MT4で購入したMQL製品の更新 | 一般的なトラブルシューティングガイド | インジケーター設定 / ガイド 主な特徴 バッファ統合: インジケーターの値をアクセス可能なバッファとして公開し、Expert Advisorが自動取引のためにリアルタイムシグナルを利用できるようにします。 高速かつバックテスト可能: MetaTraderのネイティブOnCalcul
FREE
How would you like to instantly know what the current trend is? How about the quality of that trend? Finding the trend on a chart can be subjective. The Fractal Trend Finder indicator examines the chart for you and reveals what the current trend is based on objective criteria. Using the Fractal Trend Finder you can easily tell if you are trading with the trend or against it. It also identifies those times when the market is not trending. Theoretically, you could trade with the trend when the tre
FREE
Based on the trend-following principle of CCI, it has been improved to become an indicator that can identify the reversal of the trend and its development direction, that is, it can identify the top and bottom attenuation of the oscillating trend in the trend market. feature The red and green columns represent the trend of bullish or bearish development under the current cycle. The blue line shows the position and attenuation of the current price trend in the current cycle. The upper and lower r
FREE
Line Heiken Ashi
Andrei Gerasimenko
3.4 (5)
This is an unconventional version of the Heiken Ashi Smoothed indicator implemented as lines rather than a histogram. Unlike a usual histogram, the indicator draws the readings of the two moving averages in the form of colored lines. Example If the candle crosses two indicator lines upwards, a trend is assumed to be changing from bearish to bullish. If the candle crosses two indicator lines downwards, a trend is assumed to be changing from bullish to bearish. The indicator is good at displaying
FREE
Добрый День, Всем. Решил выложить свой индикатор, предложить на просмотр. Я трейдер, Вадим Сергеевич Лепехо. Индикатор не стандартный, сделан не по канонам. Индикатор рисует маржинальные зоны на графике, пока полет нормальный. Но строит зоны по индикатору AO(Awesom) конкретней по фрактальным зонам индикатора AO. Зоны стандартные 1/4, 1/4, и НКЗ. Пример привожу по EURUSD + в картинках. На данный момент 14.10.23 - нкз=1920 пипсов(192 пункта) предлагаю преобразить до 192пипсов(19.8пунктов). Поясняю
FREE
Railway Tracks Pattern — Reversal Pattern Indicator Railway Tracks Pattern is an indicator that automatically detects a powerful two-candle reversal pattern on the chart. It looks for two candles with opposite directions (bullish and bearish), similar in size, and with minimal wicks — a clear sign of momentum shift. How it works: The first candle is strong and directional. The second candle moves in the opposite direction and is of similar size. Both candles have small shadows (wicks). The
FREE
Mr Beast Sniper
Luis Mariano Vazquez Marcos
5 (1)
Asesor Experto "Sniper FX": Precisión Milimétrica para Tus Operaciones El asesor experto "Sniper FX" redefine la precisión en el trading automatizado al ofrecer un enfoque estratégico centrado en pocas, pero extraordinariamente precisas, entradas en el mercado. Inspirado por la agudeza de un francotirador, este asesor experto utiliza algoritmos avanzados para identificar oportunidades óptimas de compra y venta, maximizando el potencial de beneficios mientras minimiza la exposición al mercado.
FREE
Introducing Austin RSI—an innovative indicator designed to elevate your forex trading strategy by applying moving averages to the MetaTrader 4 indicator, RSI. The Relative Strength Index (RSI) is a popular momentum oscillator that measures the speed and change of price movements. It oscillates between 0 and 100 and is used to identify overbought and oversold conditions in the market. Traders often use RSI to gauge the strength of price movements and anticipate potential trend reversals. Austi
FREE
Powered by SVX Strategies Quant Team Divergences are among the most powerful signals in technical analysis, but spotting them in real-time is difficult and subjective. RSI Divergence Hunter automatically scans the market for these discrepancies between price and momentum. Eliminate Subjectivity, Automate Profit Drawing lines manually leads to errors. If you prefer a fully automated, mathematical approach to trading, copy our official institutional algorithms: Copy "Friday Pulse" (Conservative/S
FREE
このプロダクトを購入した人は以下も購入しています
Gann Made Easy は、ミスター・ギャンの理論を使用した取引の最良の原則に基づいた、プロフェッショナルで使いやすい外国為替取引システムです。 W・D・ガン。このインジケーターは、ストップロスとテイクプロフィットレベルを含む正確な買いと売りのシグナルを提供します。 PUSH通知を利用して外出先でも取引可能です。 ご購入後、取引方法の説明と優れた追加インジケーターを無料で入手するには、私にご連絡ください! おそらく、ギャンの取引手法についてはすでに何度も聞いたことがあるでしょう。通常、ギャンの理論は初心者のトレーダーだけでなく、すでにある程度の取引経験がある人にとっても非常に複雑なものです。なぜなら、ギャンの取引手法は理論的にはそれほど簡単に適用できるものではないからです。私はその知識を磨き、最良の原則を私の外国為替インジケーターに組み込むために数年を費やしました。 このインジケーターは非常に簡単に適用できます。必要なのは、それをチャートに添付し、簡単な取引推奨事項に従うだけです。このインジケーターは常に市場分析の仕事を行い、取引の機会を探します。適切なエントリーポイントを検出す
M1 SNIPER は使いやすいトレーディングインジケーターシステムです。M1時間足向けに設計された矢印インジケーターです。M1時間足でのスキャルピングのためのスタンドアロンシステムとして、また既存のトレーディングシステムの一部としても使用できます。このトレーディングシステムはM1時間足での取引に特化して設計されていますが、他の時間足でも使用できます。元々、この手法はXAUUSDとBTCUSDの取引用に設計しましたが、他の市場においても役立つと考えています。 インジケーターのシグナルは、トレンドの方向と逆方向に取引できます。インジケーターのシグナルを利用して両方向に取引するのに役立つ特別な取引テクニックをご紹介します。この手法は、特別な動的なサポートとレジスタンスの価格帯を利用することに基づいています。 ご購入後、M1 SNIPER矢印インジケーターをすぐにダウンロードできます。さらに、M1 SNIPERツールのすべてのユーザーに、以下のスクリーンショットに表示されているApollo Dynamic SRインジケーターを無料で提供しています。この2つのインジケーターを組み合わせることで
Scalper Inside PRO – Since 2020. An exclusive indicator that utilizes an innovative algorithm to swiftly and accurately determine the market trend. The indicator automatically calculates opening, closing, and profit levels, providing detailed trading statistics. With these features, you can choose the most appropriate trading instrument for the current market conditions. Additionally, you can easily integrate your own arrow indicators into Scalper Inside Pro to quickly evaluate their statistics
After purchase, contact me privately to receive 1 month of free testing with EA Forex Proton! This advanced MT4 trading robot automatically executes signals from any MT4 indicator, including Market Makers. The latest version also includes AI integration, allowing each trade signal to be analyzed using Artificial Intelligence. Live Signal with EA Forex Proton: Click here Market Makers is a powerful price action trading system designed to identify high-probability Buy and Sell opportunities based
まず第一に、この取引ツールはノンリペイント、ノンリドロー、ノンラグの指標であり、プロの取引に理想的ですことを強調する価値があります。 オンラインコース、ユーザーマニュアル、デモ。 スマートプライスアクションコンセプトインジケーターは、新米から経験豊富なトレーダーまで、非常 に強力なツールです。Inner Circle Trader AnalysisやSmart Money Concepts Trading Strategiesなど、20以上の有用な指標を1つに組み合わせています。このインジケーターはスマートマネーコンセプトに焦点を当て、大手機関の取引方法を提供し、彼らの動きを予測するのに役立ちます。 特に、流動性分析に優れており、機関がどのように取引しているかを理解しやすくしています。市場のトレンドを予測し、価格の動きを慎重に分析するのに優れています。機関の戦略とトレードを合わせることで、市場の動向についてより正確な予測ができます。このインジケーターは多目的であり、市場構造を分析し、重要な注文ブロックを特定し、さまざまなパターンを認識するのに優れています。 このインジケーターは
Ultimate Sniper Dashboard
Hispraise Chinedum Abraham
4.82 (22)
299ドルで割引中! 今後値上げの可能性あり! 下の説明を読んでください! 究極のスナイパーダッシュボードのための最高のエントリーシステム。究極のダイナミックレベル。(私の製品をチェックしてください) 究極のスナイパーダッシュボードはMT4多通貨テスト制限のため、ライブマーケットでのみ作動します。 究極のスナイパーダッシュボードをご紹介します。HA-Sniper、MA-Sniper、その他多くの特別なモードが含まれる最高の製品です。究極のスナイパーダッシュボードは絶対的な獣です! 初心者やエキスパートトレーダーにとって最高のソリューションです。もう二度と動きを見逃さない! シンプルさとピップを愛するトレーダーのために、特別な製品をご用意しました。シンプルでありながら、ダッシュボードは複数のカスタムアルゴリズムに基づき28の通貨ペアを監視し、すべての作業を行います。たった一つのチャートで、プロのように市場を読み解くことができます。もし、為替ペアが動き出したときに、その方向性を正確に特定することができれば、あなたの取引はどれほど改善されることでしょう。   当社のシステムは、高い確率
Trend Screener
STE S.S.COMPANY
4.79 (95)
トレンドインジケーター、1つのツールに組み込まれたすべての重要なトレンド機能を備えたトレンドトレーディングとフィルタリングのための画期的なユニークなソリューション! これは、すべてのシンボル/商品(外国為替、商品、暗号通貨、インデックス、株式)で使用できる100%再描画されていないマルチタイムフレームおよびマルチ通貨インジケーターです。 期間限定オファー: サポートおよびレジスタンス スクリーナー インジケーターは、たった 50 ドルで永久的にご利用いただけます。(元の価格 250 ドル) (オファー延長) トレンドスクリーナーは、チャート内のドットで矢印トレンドシグナルを提供するインジケーターに続く効率的なインジケーターです。 トレンド分析インジケーターで使用できる機能: 1.トレンドスキャナー。 2.最大利益分析を備えたトレンドライン。 3.トレンド通貨強度メーター。 4.アラート付きのトレンド反転ドット。 5.アラート付きの強いトレンドドット。 6.トレンド矢印 毎日の分析例、毎日のシグナルパフォーマンス...など、トレンドスクリーナーインジケーターを使用して、ここで見つけること
「 Dynamic Scalper System 」インジケーターは、トレンド波の中でスキャルピング取引を行う手法のために設計されています。 主要通貨ペアと金でテスト済みで、他の取引商品との互換性があります。 トレンドに沿った短期的なポジションオープンのシグナルを提供し、追加の価格変動サポートも提供します。 インジケーターの原理 大きな矢印はトレンドの方向を決定します。 トレンド波の中では、小さな矢印の形でスキャルピングシグナルを生成するアルゴリズムが機能します。 赤い矢印は強気方向、青い矢印は弱気方向です。 トレンドの方向には敏感な価格変動ラインが描かれ、小さな矢印のシグナルと連動します。 シグナルは次のように機能します。適切なタイミングでラインが現れるとエントリーシグナルが形成され、ラインが開いている間はポジションが保持され、完了すると取引が終了します。 推奨される動作時間枠はM1~H4です。 矢印は現在のローソク足に形成され、次のローソク足が開いている場合は、前のローソク足の矢印は再描画されません。 入力パラメータ Trend Wave Period - トレンド方向
まず第一に、この取引インジケーターは再描画されず、再描画されず、遅延しないことを強調する価値があります。これにより、手動取引とロボット取引の両方に理想的なものになります。 ユーザーマニュアル:設定、入力、戦略。 アトミックアナリストは、価格の強さとモメンタムを利用して市場でより良いエッジを見つけるためのPA価格アクションインジケーターです。ノイズや誤ったシグナルを除去し、取引ポテンシャルを高めるための高度なフィルターを備えています。複雑なインジケーターの複数のレイヤーを使用して、アトミックアナリストはチャートをスキャンし、複雑な数学的計算をシンプルなシグナルと色に変換します。これにより、どのような初心者トレーダーでも理解して使用し、一貫した取引の決定を行うことができます。 「アトミックアナリスト」は、新規および経験豊富なトレーダー向けにカスタマイズされた包括的な取引ソリューションです。プレミアムインジケーターとトップノッチの機能を1つの取引戦略に組み合わせ、すべてのタイプのトレーダーにとって汎用性のある選択肢にします。 デイリートレーディングとスキャルピング戦略:高速で正確な
Super Signal – Skyblade Edition プロ仕様のノンリペイント / ノーラグ・トレンドシグナルシステム。卓越した勝率を実現 | MT4 / MT5 対応 1分足、5分足、15分足などの低い時間足で最も効果を発揮します。 主な特徴: Super Signal – Skyblade Edition は、トレンド取引に特化したスマートなシグナルシステムです。マルチレイヤーのフィルターロジックを用いて、明確な方向性と実際のモメンタムに支えられた強力なトレンドのみを検出します。 このシステムは 天井や底を予測するものではありません 。次の3つの条件がすべて満たされた場合にのみシグナルを発生させます: 明確なトレンド方向 モメンタムの増加 健全なボラティリティ構造 市場セッションに基づく流動性分析と組み合わせることで、シグナルの精度とタイミングがさらに向上します。 シグナルの特性: すべての矢印シグナルは 100% 非リペイント / 遅延なし 一度出現したシグナルは固定され、点滅・消失しません チャート上の矢印、情報パネル、ポップアップ通知、音声アラート、プッシュ通知
Trend indicator AI
Ramil Minniakhmetov
4.53 (83)
Trend Ai indicatorは、トレンドの識別と実用的なエントリポイントと反転アラートを組み合わせることで、トレーダーの市場分析を強化する優れたツールです。 この指標は、ユーザーが自信と正確さで外国為替市場の複雑さをナビゲートすることを可能にします トレンドAiインジケーターは、主要なシグナル以外にも、プルバックやリトレースメント中に発生するセカンダリエントリポイントを識別し、トレーダーが確立されたトレンド内の価格修正を活用できるようにします。 重要な利点: *MT4およびMT5の仕事 *明確な買いまたは売りシグナル *再描画しません ·すべての資産で動作します 私はeaやセットをtelegram it詐欺で販売しないように注意してください。 すべての設定はここでブログで無料です。  重要! 指示とボーナスを得るために購入後すぐに私に連絡してください! 私の他のプロダクトと同様、実質操作の監視はここに見つけることができます: https://www.mql5.com/en/users/mechanic/seller&nbsp ; 設定および入力: すべての
ON Trade Waves Patterns Harmonic Elliot Wolfeをご紹介します。これは手動および自動の方法を使用して市場のさまざまなパターンを検出するために設計された高度なインジケーターです。以下はその動作方法です: ハーモニックパターン: このインジケーターは、チャートに表示されるハーモニックパターンを識別できます。これらのパターンは、Scott Carneyの「Harmonic Trading vol 1および2」で説明されているように、ハーモニックトレーディング理論を実践するトレーダーにとって重要です。手動で描画するか、自動検出に頼るかにかかわらず、ON Trade Waves Patternsがお手伝いします。 コントロールパネル: このインジケーターはユーザーフレンドリーなコントロールパネルを備えています。チャートと時間枠の設定を保存し、異なる構成間をスムーズに切り替えることができます。チャートスペースを最大限に活用するために最小化することもできます。他の分析ツールで作業することを好む場合、閉じるボタンをクリックするだけで、すべてのインジケーターデ
通貨強さウィザードは、取引を成功させるためのオールインワン ソリューションを提供する非常に強力な指標です。このインジケーターは、複数の時間枠のすべての通貨のデータを使用して、このまたはその外国為替ペアのパワーを計算します。このデータは、使いやすい通貨インデックスと通貨パワーラインの形式で表され、特定の通貨のパワーを確認するために使用できます。 必要なのは、取引したいチャートにインジケーターを接続することだけです。インジケーターは、取引する通貨の実際の強さを示します。このインジケーターは、トレンドに合わせて取引するときに有利に利用できる売買高の圧力の極値も示します。このインジケーターには、フィボナッチに基づく可能なターゲットも表示されます。 このインジケーターは、PUSH 通知を含むあらゆるタイプのアラートを提供します。 購入後ご連絡下さい。私の取引のヒントをあなたと共有し、素晴らしいボーナスインジケーターを無料で提供します! 幸せで有益な取引をお祈りします。
説明書(ロシア語)  /  説明書 (英語)  /  バージョン MT5 主な機能: 売り手と買い手のアクティブなゾーンを表示します。 このインジケーターは、買いと売りの適切な最初のインパルスレベル/ゾーンをすべて表示します。これらのレベル/ゾーンがアクティブになると、エントリーポイントの探索が始まり、レベルの色が変わり、特定の色で塗りつぶされます。状況をより直感的に把握できるように、矢印も表示されます。 LOGIC AI - テンプレートをアクティブ化するときにエントリポイントを検索するためのゾーン(円)の表示 視認性を向上させるため、人工知能を用いて進入ポイントを探索したゾーンを表示する機能が追加されました。 より高い時間枠からのレベル/ゾーンの表示(MTFモード) より長い時間間隔でレベル/ゾーンを表示する機能を追加しました。また、インジケーターに自動トレンド検出機能(   TPSproTREND PRO   )を実装しました。 取引のための個別の専門的なステップバイステップのアルゴリズム このアルゴリズムは、トレンドの方向と逆方向の両方でデイトレードを行うために設計されていま
BTMM State Engine Pro is a MetaTrader 4 indicator for traders who use the Beat The Market Maker approach: Asian session context, kill zone timing, level progression, peak formation detection, and a multi-pair scanner from a single chart. It combines cycle state logic with a built-in scanner dashboard so you do not need the same tool on many charts at once. What it does Draws the Asian session range; session times can follow broker server offset or be set in inputs. Tracks level progression (L
Linear Trend Predictor ー - エントリ ポイントと方向サポート ラインを組み合わせたトレンド インジケーター。高値/安値チャネルを突破するという原理に基づいて機能します。 インジケーターのアルゴリズムは市場のノイズをフィルタリングし、ボラティリティと市場の動向を考慮します。 インジケーターの機能  平滑化手法を使用して、市場のトレンドと、買い注文または売り注文を開くためのエントリー ポイントを表示します。  任意の時間枠のチャートを分析して、短期および長期の市場の動きを判断するのに適しています。  あらゆる市場や時間枠に適応可能な入力パラメータにより、トレーダーはインジケーターを独自にカスタマイズできます。  設定されたインジケーター信号は消えず、再描画もされません。ローソク足の終値で決定されます。  いくつかの種類の通知が矢印と組み合わされています。  このインジケーターは、独立した取引システムとして使用することも、他の取引システムへの追加として使用することもできます。  あらゆるレベルの経験を持つトレーダーが使用できます。 主なパラメータ Vol
現在40%オフ 初心者やエキスパートトレーダーに最適なソリューション! このインジケーターは、独自の機能と新しい計算式を取り入れた、ユニークで高品質、かつ手頃な価格のトレーディングツールです。たった1枚のチャートで28の為替ペアの通貨強度を読み取ることができます。新しいトレンドやスキャルピングチャンスの引き金となるポイントを正確に特定することができるので、あなたのトレードがどのように改善されるか想像してみてください。 ユーザーマニュアルはこちら  https://www.mql5.com/en/blogs/post/697384 これが最初の1本、オリジナルだ! 価値のないクローンを買わないでください。 特別な サブウィンドウの矢印で強い通貨の勢いを表示 GAPがあなたのトレードを導く! 基準通貨や気配値が売られすぎ・買われすぎのゾーン(外相フィボナッチレベル)にあるとき、個別チャートのメインウィンドウに警告表示。 通貨がレンジの外側から反落した場合、プルバック/リバーサルのアラート。 クロスパターンの特別なアラート 複数の時間枠を選択可能で、トレンドを素早く確認できます
Easy Breakout
Mohamed Hassan
4.71 (14)
After your purchase, feel free to contact me for more details on how to receive a bonus indicator called VFI, which pairs perfectly with Easy Breakout for enhanced confluence!    Easy Breakout is a powerful price action trading system built on one of the most popular and widely trusted strategies among traders: the Breakout strategy ! This indicator delivers crystal-clear Buy and Sell signals based on breakouts from key support and resistance zones. Unlike typical breakout indicators, it levera
Volatility Trend System - a trading system that gives signals for entries. The volatility system gives linear and point signals in the direction of the trend, as well as signals to exit it, without redrawing and delays. The trend indicator monitors the direction of the medium-term trend, shows the direction and its change. The signal indicator is based on changes in volatility and shows market entries. The indicator is equipped with several types of alerts. Can be applied to various trading ins
トレンドラインプロ   市場の真の方向転換点を理解するのに役立ちます。この指標は、真のトレンド反転と主要プレーヤーが再び参入するポイントを示します。 分かりますか     BOSライン   複雑な設定や不要なノイズなしに、より長い時間足でのトレンドの変化と重要なレベルを把握できます。シグナルは再描画されず、バーが閉じた後もチャート上に残ります。 VERSION MT 5     -     RFI LEVELS PRO インジケーター と組み合わせることで、その潜在能力を最大限に発揮します。 インジケーターが示す内容: 本当の変化   トレンド(BOSライン) 一度シグナルが現れたら、それは有効です!これは、リペイント機能を持つインジケーターとの重要な違いです。リペイント機能を持つインジケーターは、シグナルを発した後、それを変更し、資金の損失につながる可能性があります。これにより、より高い確率と精度で市場に参入できます。また、矢印が現れた後、目標値(利益確定)に達するか、反転シグナルが現れるまで、ローソク足の色を変更する機能もあります。 繰り返しエントリ       主要プレーヤーの
Order Block Hunter
Noha Mohamed Fathy Younes Badr
5 (10)
Order block hunter indicator is the best indicator for  hunt the order blocks that area where there has been a large concentration of limit orders waiting to be executed Order blocks are identified on a chart by observing previous price action and looking for areas where the price experienced significant movement or sudden changes in direction .This indicator does that for you by using very complicated codes and helps you to take the best areas To buy and sell because it make marks at the best a
GOLD Impulse with Alert
Bernhard Schweigert
4.67 (12)
このインディケータは、当社の2つの製品 Advanced Currency IMPULSE with ALERT  +   Currency Strength Exotics . のスーパーコンビネーションです。 このインジケーターは全ての時間枠で作動し、8つの主要通貨と1つのシンボルの強弱のインパルスをグラフで表示します。 このインジケータは、金、エキゾチックペア、商品、インデックス、先物など、あらゆるシンボルの通貨強度の加速度を表示することに特化されています。金、銀、原油、DAX、US30、MXN、TRY、CNHなどの通貨強度の加速度(インパルスまたは速度)を表示するために、任意のシンボルを9行目に追加できる、この種の最初のものです。 新しいアルゴリズムに基づいて構築され、潜在的な取引の特定と確認がさらに容易になりました。これは、通貨の強さや弱さが加速しているかどうかをグラフィカルに表示し、その加速の速度を測定するためです。加速すると物事は明らかに速く進みますが、これはFX市場でも同じです。つまり、反対方向に加速している通貨をペアリングすれば、潜在的に利益を生む取引を特定
Apollo SR Master は、サポート/レジスタンスゾーンを利用した取引をより容易かつ確実にする特別な機能を備えたサポート/レジスタンスインジケーターです。このインジケーターは、ローカル価格の高値と安値を検出することで、タイムラグなしでリアルタイムにサポート/レジスタンスゾーンを計算します。そして、新たに形成されたSRゾーンを確認するために、インジケーターは特別なシグナルを表示します。このシグナルは、SRゾーンを実際の売りまたは買いシグナルとして考慮して使用できることを示します。この場合、SRゾーンの強度が高まり、SRエリアからの取引が成功する確率も高まります。これがこのインジケーターの基本的な考え方です。 SRゾーンは、ストップロスとテイクプロフィットの設定を容易にします。シグナルの方向に応じて、SRゾーンの上または下のスペースをストップロスとして設定できます。さらに、反対側のSRゾーンは、潜在的なテイクプロフィットエリアとして設定できます。 また、Apollo SRマスターインジケーターをご利用のすべてのユーザーには、「Apollo Price Action System」
KT Gaussian Trend Filter は、ガウスフィルターと線形回帰スムージングを組み合わせることで、明確かつ正確なトレンド分析を実現します。わかりやすい買いと売りのシグナルを生成しながら、市場の長期的な方向性を効果的に示します。 機能 カスタマイズ可能なガウスフィルター: 期間やポール設定を調整してスムージング精度を高め、トレンドの明瞭さを向上。 線形回帰による強化: ガウススムージングをさらに最適化し、市場のノイズによる誤信号を最小限に抑えます。 マルチタイムフレームスキャナー: 複数の時間軸におけるガウストレンドの方向を自動検出し、わかりやすいダッシュボードに表示します。 トレーリングバンド機能: トレンド中の深い押し目でのエントリーポイントを簡単に把握可能。 カラーカスタマイズ対応: チャートの配色や取引スタイルに合わせて色を自由に設定できます。 内蔵アラート機能: ポップアップ、メール、プッシュ通知、サウンドアラートで即時通知を受け取れます。 使い方 このインジケーターは明確なシグナルを提供し、トレーダーがエントリーやエグジットのタイミングを判断しやすくします
Advanced Supply Demand
Bernhard Schweigert
4.91 (299)
現在40%オフ 初心者にもエキスパートトレーダーにも最適なソリューション このインジケーターは独自の機能と新しい公式を多数内蔵しており、ユニークで高品質かつ手頃な取引ツールです。このアップデートでは、2つの時間枠ゾーンを表示できるようになります。より長いTFだけでなく、チャートTFとより長いTF(ネストゾーンを表示)の両方を表示できます。すべてのSupply Demandトレーダーの皆さんのお気に召すはずです。:) 重要情報の公開 Advanced Supply Demandの可能性を最大化するには、 https://www.mql5.com/ja/blogs/post/720245 にアクセスしてください。   エントリーまたはターゲットの正確なトリガーポイントを正確に特定できれば取引がどのように改善されるか想像してみてください。新しい基盤となるアルゴリズムに基づいて構築されているため、買い手と売り手の間の潜在的な不均衡をさらに簡単に特定できます。これは、最も強い需要と供給のゾーンと、過去のパフォーマンス(古いゾーンを表示)がグラフィカルに表現されるためです。これらの機能は、最適な
Route Lines Prices -は、価格の方向性を予測するために設計されたインジケーターです。シンプルなインターフェースには、価格変動と将来の方向性を計算するための複数のアルゴリズムが搭載されています。これらのアルゴリズムには、使用する時間枠に基づいたボラティリティ計算と価格平滑化が含まれています。 このインジケーターには、「 Calculating price values 」値を変更するためのパラメーターが1つだけあります。デフォルト値の1は、バランスの取れた自動計算を提供し、インジケーターを手動で設定することなく使用できます。 値を2から500まで手動で変更することで、インジケーターを独自のトレーディングシステムに合わせてカスタマイズできます。 このインジケーターは、M1からH4の時間枠での使用を推奨します。あらゆる取引銘柄で使用できます。 シグナル矢印はローソク足の終値で生成され、過去の履歴には再描画されません。 メインチャートには、重複した矢印が表示されます。 複数のアラートタイプが利用可能です。内蔵のライン軌跡カウンターは、終値に基づいて動作します。これ
PRO Renko Systemは、特別にRENKOチャートを取引するために設計された高精度の取引システムです。 これは、様々な取引商品に適用することができる普遍的なシステムです。 システムは効果的に正確な逆転信号へのアクセスを与えるいわゆる市場の騒音を中和する。 表示器は非常に使いやすく、信号の生成に責任がある1つの変数だけがあります。 あなたは簡単にお好みの任意の取引ツールとレンコバーのサイズにツールを適応させることができます。 私はいつもあなたが私のソフトウェアで収益性の高い取引を支援するために余分なサポートを提供する準備ができています! 私はあなたに幸せで収益性の高い取引をしたいです! ご購入後にご連絡ください! 私はあなたに私のレンコチャートジェネレータを送信します。 私はまた、私の個人的な推奨事項やシステムの他のモジュールを無料で共有します!
- Real price is 80$ - 40% Discount (It is 49$ now) Contact me for instruction, add group and any questions! - Non-repaint - I just sell my products in Elif Kaya profile, any other websites are stolen old versions, So no any new updates or support. - Lifetime update free Related product:   Bitcoin Expert Introduction The breakout and retest strategy is traded support and resistance levels. it involves price breaking through a previous level.  The break and retest strategy is designed to help tr
これは、キャンドルの終値を予測する指標です。 このインジケータは、主にD1チャートでの使用を目的としていますが. この指標は、従来の外国為替取引とバイナリオプション取引の両方に適しています。 インジケーターは、スタンドアロンのトレーディングシステムとして使用することも、既存のトレーディングシステムへの追加として機能させることもできます。 このインジケーターは、現在のキャンドルを分析し、キャンドル自体の内部の特定の強度係数と、前のキャンドルのパラメーターを計算します。 したがって、この指標は、市場の動きのさらなる方向性と現在のキャンドルの終値を予測します。 この方法のおかげで、この指標は、短期の日中取引だけでなく、中期および長期の取引にも適しています。 インジケーターを使用すると、市場の状況の分析中にインジケーターが生成する潜在的な信号の数を設定できます。 インジケーターの設定には、このための特別なパラメーターがあります。 また、インジケーターは、チャート上のメッセージの形式で、電子メールで、およびPUSH通知の形式で、新しい信号について通知することができます。 購入後は必ず私に書いて
Miraculous Indicator – ガン・スクエア・オブ・ナインに基づく100%非リペイントのFXおよびバイナリーツール この動画では、FXおよびバイナリーオプションのトレーダー向けに特別に開発された、非常に正確で強力な取引ツールである Miraculous Indicator を紹介しています。このインジケーターがユニークなのは、伝説的な ガン・スクエア・オブ・ナイン と ガンの振動の法則 に基づいている点で、現代の取引で利用できる最も正確な予測ツールの一つとなっています。 Miraculous Indicatorは 完全に非リペイント であり、ローソク足が確定した後にシグナルが変化したり消えたりすることはありません。つまり、見たものがそのまま利用できます。これにより、トレーダーは自信を持ってエントリーおよびエグジットを行うための信頼性と一貫性のある根拠を得ることができます。 主な特徴: ガン・スクエア・オブ・ナインとガン理論に基づいて構築 100%非リペイントのシグナルシステム すべての時間枠(M1、M5、H1、H4、日足、週足)で機能 FXおよびバイナリーオプション取引
作者のその他のプロダクト
The intention of the dashboard is to provide a quick overview of the daily, weekly and monthly range of configured assets. In "single asset mode" the dashboard shows you possible reversal points directly in the chart, thus making statistics directly tradable. If a configured threshold is exceeded, the dashboard can send a screen alert, a notification (to the mobile MT4) or an email.  There are various ways of using this information. One approach is that an asset that has completed nearly 100% of
The SuPrEs indicator indicates the distance to the next horizontal line whose name begins with the configured prefix (see Options). usage Draw support & resistance in the chart and let the indicator warn you, as soon as a configured distance is undershot. Use the prefix to provide alarms for other lines as well as standard lines (see screenshot with pivot indicator). Display of the indicator The indicator displays the distance to the next line above and below the current (Bid) price. Not more
FREE
The dashboard should help to get a quick overview of the correlations of different assets to each other. For this, the value series are compared according to the Pearson method. The result is the value of the correlation (in percent). With the new single asset mode, you can immediately see which symbols have the highest positive or negative correlation. This prevents you from accidentally taking a risk on your trades with highly correlated symbols. Usage There are different methods for the corr
With the SR Dashboard, you get a powerful tool to control some of the most important information in trading. Assemble a setup according to your strategy and get informed as soon as this setup is valid. Assign scores to defined conditions and let the Dashboard find them. Choose from Trend, Average Daily Range, RSI, Moving Averages, Pivot (Daily, Weekly, Monthly), Highs and Lows, Candlestick Patterns. Note: This indicator cannot be used in the Strategy Tester. The demo version here from the marke
Netsrac Correlation Trader (NCT) is a very powerful tool to trade positive and negative correlated currency pairs with hedged orders.  1) It looks for positive and negative correlated pairs 2) It shows you a signal, if the correlated pairs are not in balance 3) It can "autotrade" some or all correlated pairs with your setting of time frames and signal-values (handle with care) 4) It can set the correct lot size to have pip value and daily range based optimal hedge trades 5) It can be your singl
The Netsrac Correlation Trade Indicator (NCTI) was created to trade correlations between different assets. NCTI offers five different strategies to do this. Five different correlation trading strategies with two or three assets Fast access your assets with one click via asset buttons Your profit/loss at a glance Configurable alerts via screen or mobile You can use the indicator with every timeframe. Higher timeframes give fewer but better signals. If you have some questions or suggestions - ple
PAAIOS stands for Price Action All In One Solution. And that is the purpose of the Indicator. It should give you a tool to improve your trading decisively because you get the crucial information at a glance. The indicator simplifies the search for strong signals. It shows trend lines, support and resistance, demand and supply zones from freely selectable time frames.    Below you will find a short description of the functions of the indicator. Please read my blog entry to learn more. Features de
Netsrac "Supply and Demand Easy" is a small but highly specialized tool for quickly finding supply & demand zones without frills. It shows the next supply and demand zone in the current timeframe. Highly efficient and fast. Works perfectly with the Netsrac "Supply and Demand Dashboard" (https://www.mql5.com/en/market/product/96511 ) Controls Variable Description (SD01) Supply color Set your color for supply zones (default is LightCoral) (SD02) Demand color Set your color for demand zones (defau
The Netsrac Supply&Demand Dashboard shows you at a glance where relevant zones are located on your favorite assets. Open your chart directly from the dashboard and trade zones that really matter. Features Finds the next relevant supply and demand zone and displays the distance to this zone (in pips) Finds and displays the zones in three different timeframes Calculates a trend indicator for the current and past candle for each configured time frame Opens a chart with your chart template directly
The Netsrac Correlation Trade Indicator (NCTI) was created to trade correlations between different assets. NCTI offers five different strategies to do this. Five different correlation trading strategies with two or three assets Fast access your assets with one click via asset buttons Your profit/loss at a glance Configurable alerts via screen or mobile You can use the indicator with every timeframe. Higher timeframes give fewer but better signals. If you have some questions or suggestions - ple
The intention of the dashboard is to provide a quick overview of the daily, weekly and monthly range of configured assets. In "single asset mode" the dashboard shows you possible reversal points directly in the chart, thus making statistics directly tradable. If a configured threshold is exceeded, the dashboard can send a screen alert, a notification (to the mobile MT5) or an email.  There are various ways of using this information. One approach is that an asset that has completed nearly 100% o
With the SR Dashboard, you get a powerful tool to control some of the most important information in trading. Assemble a setup according to your strategy and get informed as soon as this setup is valid. Assign scores to defined conditions and let the Dashboard find them. Choose from Trend, Average Daily Range, RSI, Moving Averages, Pivot (Daily, Weekly, Monthly), Highs and Lows, Candlestick Patterns. What can you do with this tool? Use the dashboard as a powerful tool for your discretionary trad
THE flexible Expert Advisor for Custom Trading Strategies in MetaTrader 5 The Netsrac TradeAid expert is a powerful tool for traders looking to develop their own trading strategies in MetaTrader 5. With this expert advisor, you can combine a variety of technical indicators and trading rules with a simple "If This (AND This...) Then That" logic to create tailored trading strategies that match your individual preferences. You don´t need any knowledge in MQL5 coding language to build your own exper
フィルタ:
wuzzy66
1008
wuzzy66 2022.10.13 17:05 
 

i was actually amazed at the performance of this indicator very unusual for me to try an indicator and buy the paid version in less than 2hrs .i have tried different indicator this truly stands out you are able to make informed decision once you place it on the chart and you are alerted when trendline touches price in either the 30mins 4hrs or daily time frame also you get alert when price is the the supply or demand zone would have given it a 7 star if possible positive instant change in my trading account and the author response fast

レビューに返信