MACD Divergence Pro MT4
- インディケータ
- バージョン: 1.4
- アップデート済み: 31 5月 2026
- アクティベーション: 10

🚀 MACD Divergence Pro MT4 (Version 1.4) 🚀
MACD Divergence Pro is a professional, high-performance trading tool designed to automatically detect and draw Classic and Hidden (Reverse) divergences directly on your charts. 🛠️ Engineered with a powerful dual-pass scanning engine and a stunning premium dashboard, it provides clear, filtered, and highly accurate reversal and trend-continuation signals! 📈📉
🌟 Key Features in Version 1.4 🌟
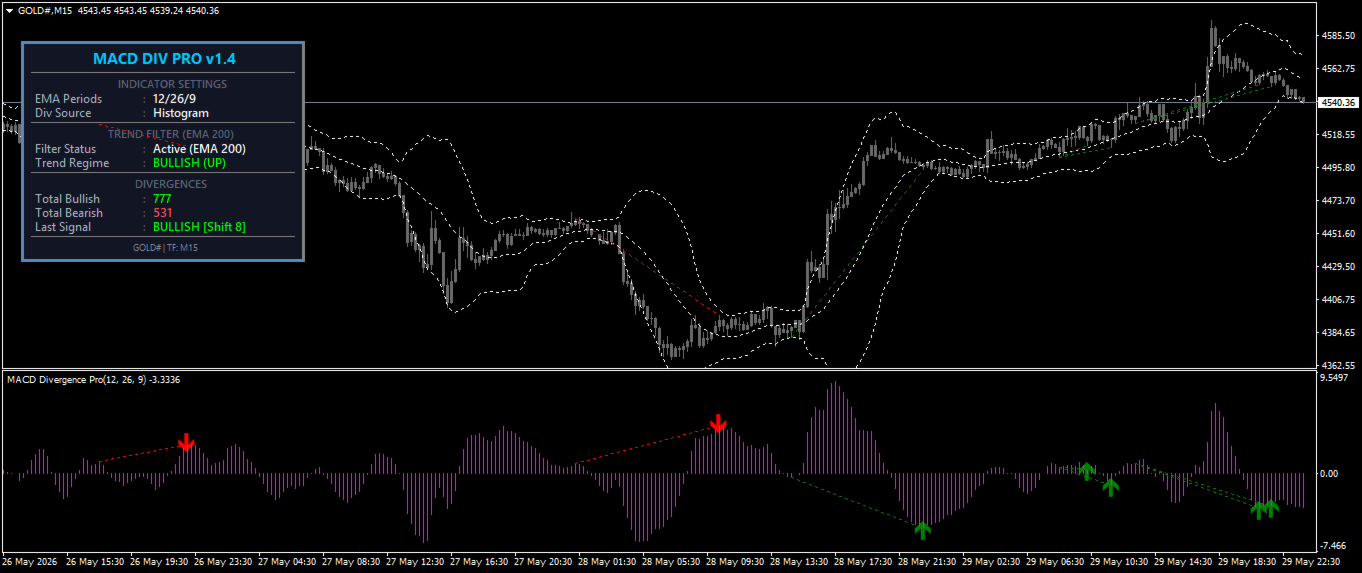
- 🖥️ [NEW] Premium Dashboard Info Panel:
- 📊 Real-time market regime display (Bullish / Bearish).
- 🔢 Dynamic divergence counters (Total Bullish & Bearish signals).
- 🔍 Last detected signal details (Type, Time, and Direction).
- ⚙️ Fully toggleable and customizable screen positioning (X/Y coordinates).
- 🛡️ [NEW] Advanced Trend Filter (EMA/SMA/SMMA/LWMA):
- 🎯 Filter out low-probability signals with a configurable Moving Average filter (e.g., 200 EMA).
- 🟢 Only buys in an uptrend (price above MA) and 🔴 only sells in a downtrend (price below MA) to keep you on the right side of the market.
- 🎛️ Clean dropdown selector input for MA methods (no manual integer typing required!).
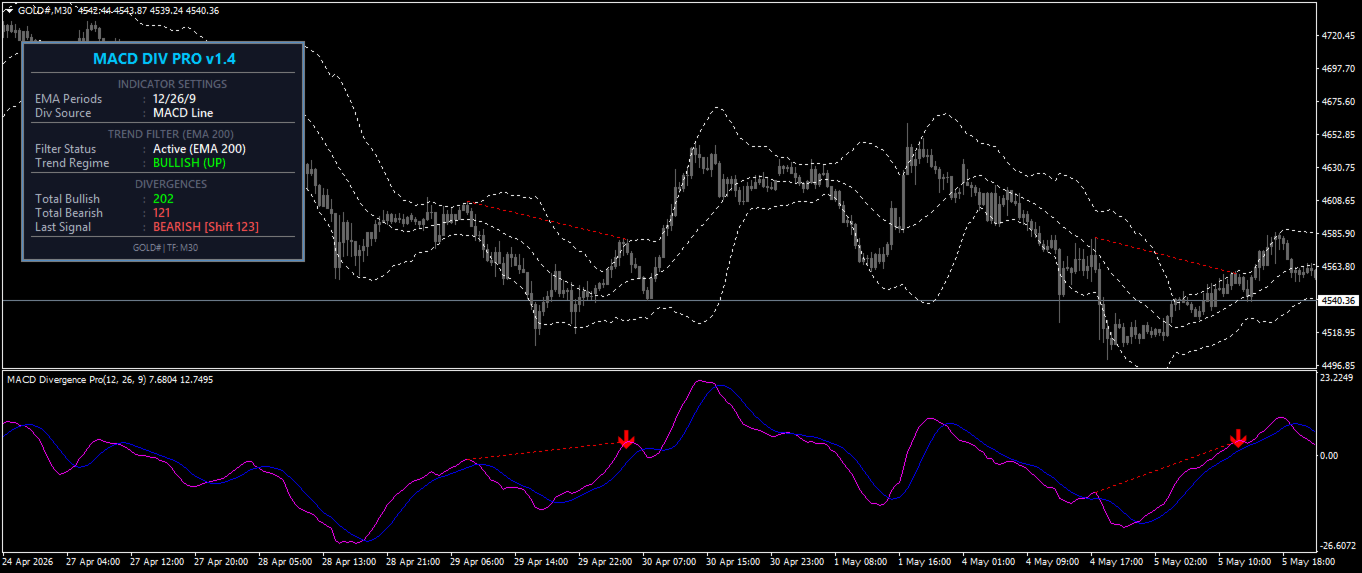
- 🔄 [NEW] Divergence Source Selection:
- ⚡ Detect divergences based on the MACD Line or the MACD Histogram.
- 🎨 Smart chart rendering: The indicator dynamically updates the subwindow styling (hides/shows the Signal Line and Histogram) automatically based on your choice.
- 🎛️ Clean dropdown selector input for source modes.
- 🎯 Classic & Hidden Divergence Detection:
- 🔄 Classic Divergences: Perfect for pinpointing high-probability trend reversals.
- ⏩ Hidden Divergences: Perfect for identifying trend-continuation points within an active trend.
- 🎨 Stunning On-Chart Visuals:
- ✍️ Automatically draws trendlines on the price chart and the indicator subwindow.
- 🌈 Differentiates Bullish and Bearish lines using fully customizable colors.
- 🚨 Robust Notification & Alert System:
- 🔊 Real-time MT4 Terminal Pop-up alerts with sound.
- 📧 Email notifications.
- 📱 Mobile push notifications (sent directly to your MetaTrader mobile app).
⚙️ Indicator Settings & Parameters ⚙️
- 📊 MACD Settings: Fast EMA, Slow EMA, Signal SMA, and Applied Price.
- 🔄 Divergence Source: Choose between MACD Line or MACD Histogram via a simple dropdown menu.
- 🛡️ Trend Filter Settings:
- Use Trend Filter : Enable/Disable the MA filter.
- MA Period : Period of the filter (default: 200).
- MA Method : Select SMA, EMA, SMMA, or LWMA via a clean dropdown menu.
- 🖥️ Dashboard Visuals:
- Show Info Panel : Enable/Disable the premium dashboard.
- Panel X Position / Panel Y Position : Move the dashboard anywhere on the chart.
- 🔔 Alert Options: Enable/Disable Pop-ups, Sound, Email, and Push Notifications.
💎 Why Choose MACD Divergence Pro? 💎
Unlike standard divergence indicators that clutter your chart and cause performance lags, this tool is built using a highly optimized dual-pass engine. ⚡ It calculates signal peaks and troughs with extreme precision and runs smoothly even during high-impact news events. Combined with the new Moving Average Filter and premium UI dashboard, it is the ultimate divergence tool for both novice and professional traders! 🏆💼
<