BOIS Trend Line Indicator
- インディケータ
- バージョン: 1.6
- アップデート済み: 17 5月 2021
- アクティベーション: 8
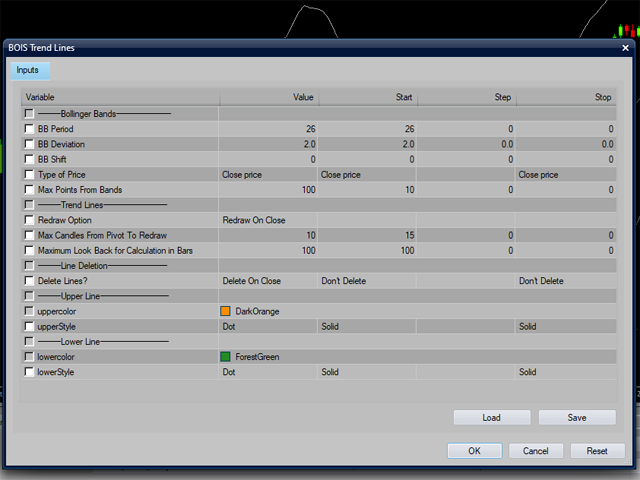
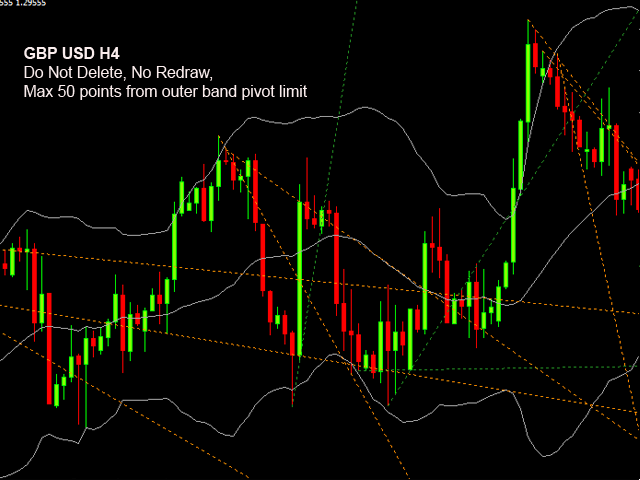
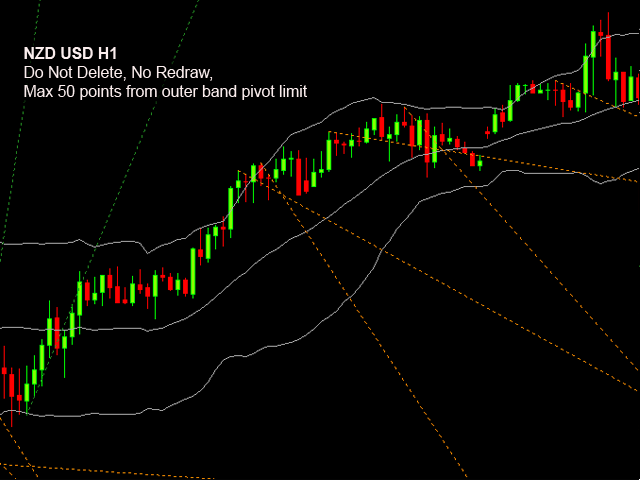
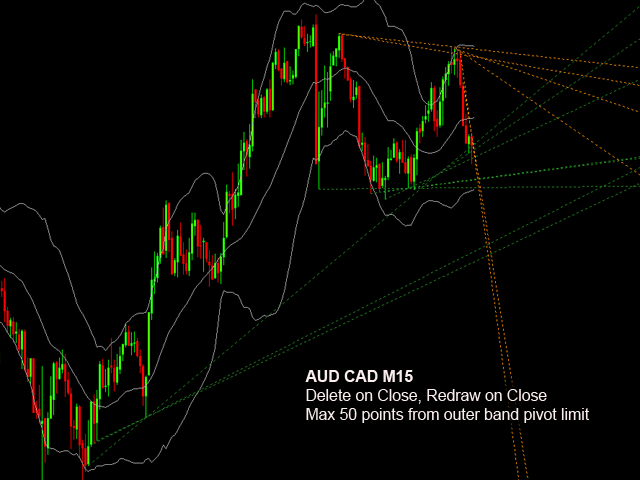
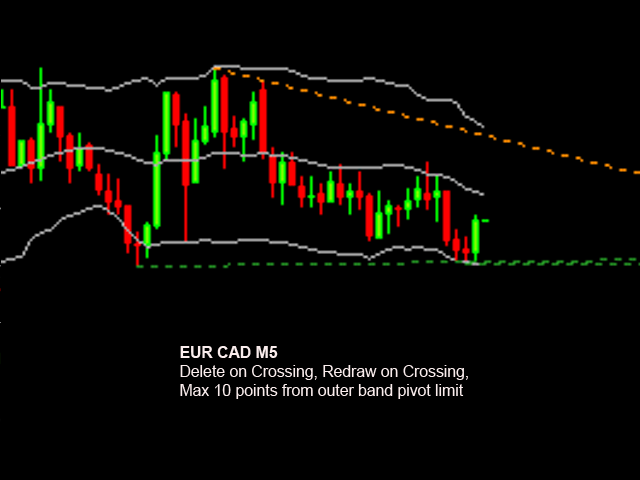
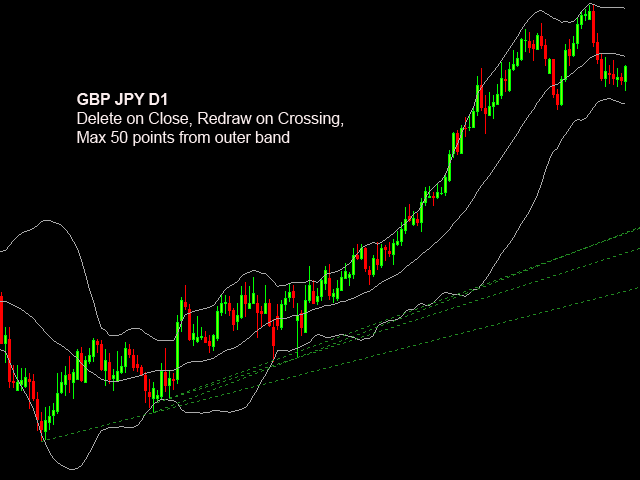
このユニークな自動トレンドラインドローイングインジケーターはすべての時間枠で機能し、短期トレンドの反転だけでなく、市場でより強い資産を示す短期トレンドブレイクアウトを簡単に取引するのに役立ちます。 それはあなたが激しいスイングのために早く入ることをユニークに可能にします。 入力には次のものが含まれます。
-マックスキャンドルはトレンドラインを振り返る
-線の種類と色
-外側のバンドまでの最大距離とバンド期間
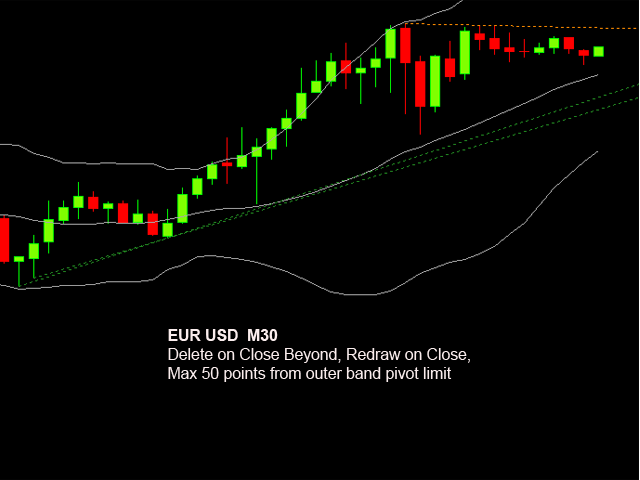
-確認キャンドルまたは価格が閉じたときにピボットからトレンドラインを自動再描画するオプション低低または高高(ダブルボトム低および高サポート)および再描画の最大キャンドル数。
-改行の4つのオプション:
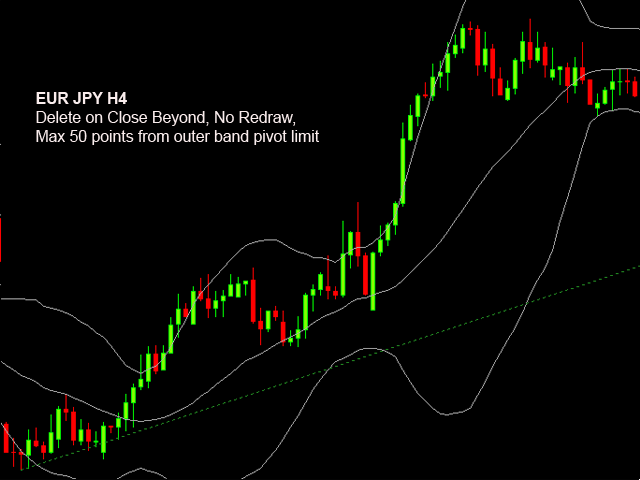
1)価格がラインを超えたときに削除する
2)削除しないでください
3)ろうそくがラインを超えて閉じたときに削除する
4)トレンドに逆らって閉じるときに削除する
-マックスキャンドルはトレンドラインを振り返る
-線の種類と色
-外側のバンドまでの最大距離とバンド期間
-確認キャンドルまたは価格が閉じたときにピボットからトレンドラインを自動再描画するオプション低低または高高(ダブルボトム低および高サポート)および再描画の最大キャンドル数。
-改行の4つのオプション:
1)価格がラインを超えたときに削除する
2)削除しないでください
3)ろうそくがラインを超えて閉じたときに削除する
4)トレンドに逆らって閉じるときに削除する