Speed Alert

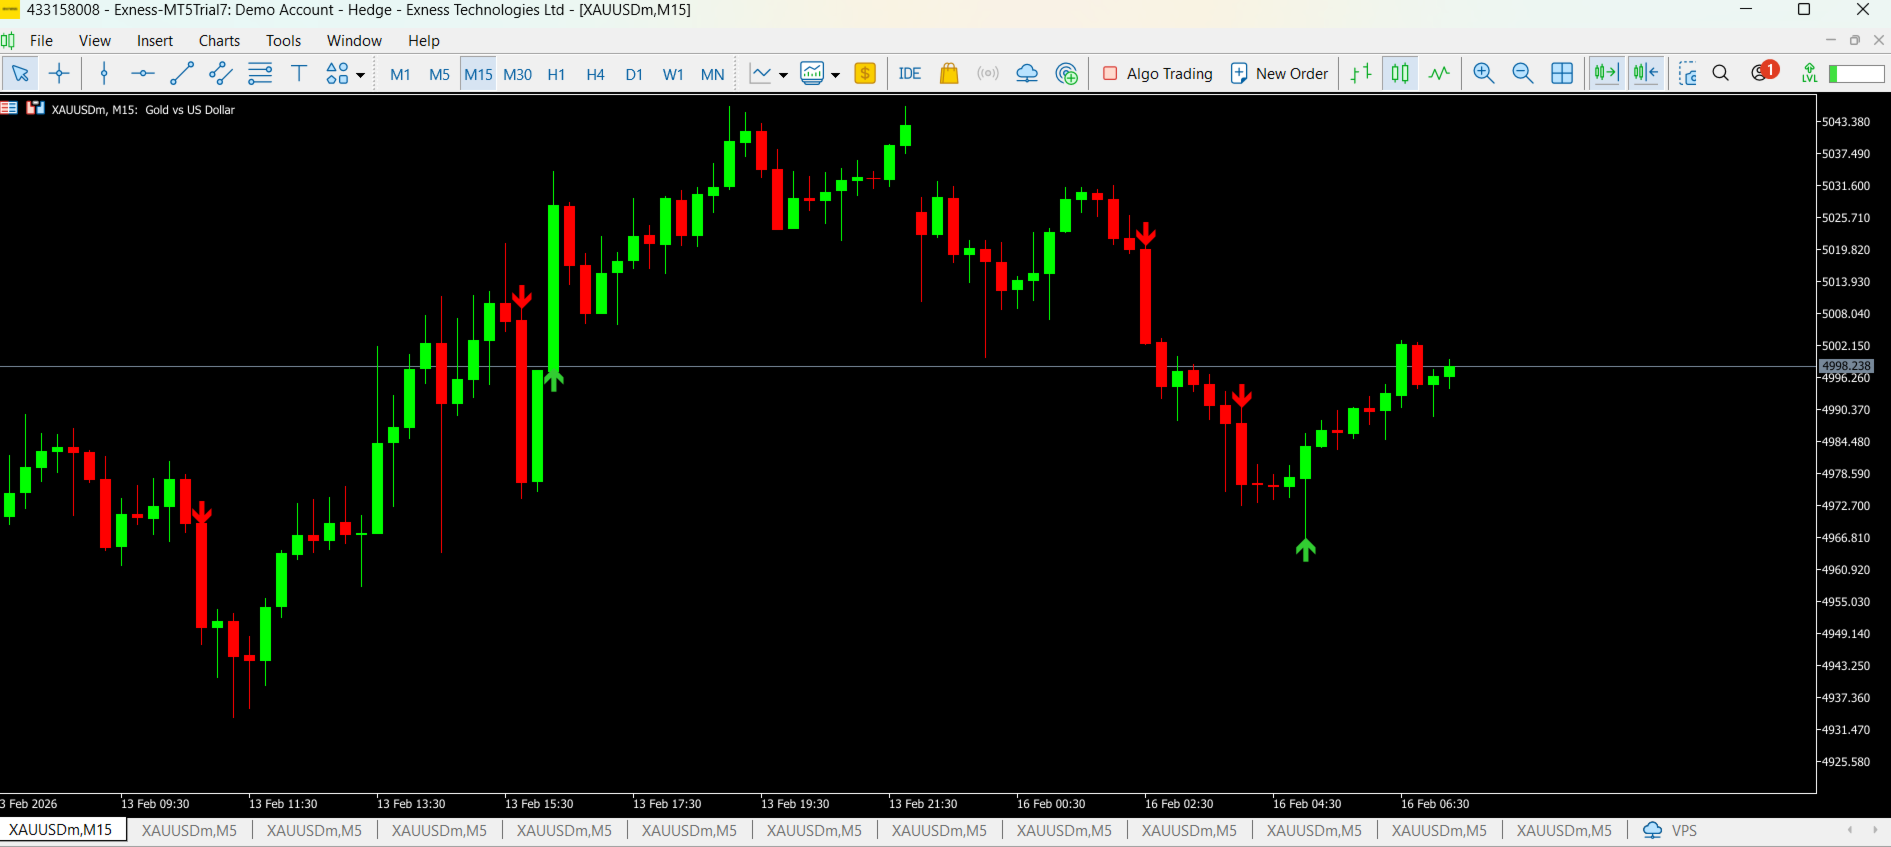
Speed Alert is a professional volatility-based indicator designed to detect fast market movements and high-speed candles in real-time. When the market suddenly accelerates and a candle moves with abnormal speed compared to recent price action, Speed Alert instantly notifies the trader.

The indicator continuously analyzes recent candles to calculate the average price speed. When the current candle exceeds the defined speed threshold, it indicates strong momentum and increased volatility, which is often seen during breakouts, news events, or aggressive market moves.

Speed Alert is strictly non-repainting and works on all timeframes and trading instruments, including Forex, Metals (Gold), Indices, and Cryptocurrencies. It is especially useful for scalping, intraday, breakout, and momentum trading strategies, where timing and fast reaction are critical.

Key Features
Volatility Detection: Instantly highlights fast-moving candles and sudden market acceleration.
Strictly Non-Repainting: The indicator does not repaint or recalculate its signals after the candle closes.
Multi-Alert System: Supports MetaTrader's native pop-up alerts, sound alerts, push notifications (mobile), and email alerts.
Fully Customizable: All sensitivity parameters can be adjusted to match different market conditions and trading styles.
How to Use
Speed Alert is an analytical tool and not an automated trade entry system. It is specifically designed to highlight moments of high speed and volatility. Traders should use these alerts as an early warning system to identify powerful market moves and confirm trade entries using their own strategy, trend analysis, or price action methods.

Default Settings & Optimization
The indicator comes with default settings highly optimized for Gold (XAUUSD) under high-volatility conditions:

Calculation Period (10): The number of recent candles used to calculate the average market speed.
Speed Multiplier (1.5): The threshold to trigger an alert. Higher values mean lower sensitivity (filters out noise), while lower values increase sensitivity.
Alerts Enabled (True): Instantly notifies you of fast market moves.
Using on Other Symbols: If you want to use this indicator on other currency pairs or instruments, the settings can easily be calibrated. Simply adjust the Calculation Period and Speed Multiplier in the indicator inputs, or use the standard MetaTrader Strategy Tester to find the optimal values based on the historical volatility of your preferred symbol.
おすすめのプロダクト
Buyer Seller Arrows – 自信を持ってトレード! すべてのタイムフレーム(M1 から MN1 まで)で、買い手と売り手の力を直感的に分析できる革新的なツールです。色分けされたパーセンテージと矢印によって、 市場のダイナミクスを瞬時に把握 できます。 主な機能: 緑の上向き矢印 = 買い手優勢 赤の下向き矢印 = 売り手優勢 各タイムフレーム (M1, M5, M15, M30, H1, H4, D1, W1, MN1) における パーセンテージ強度 カラーコード による素早い識別(鮮やかな緑と赤) 動作原理: 買い圧力と売り圧力のバランス を追跡 EMA と SMA を用いて強度を計算 リアルタイムでトレンドの優勢 を表示 理想的なエントリーとエグジットポイント を特定するサポート トレーダーに選ばれる理由: 非常に分かりやすいビジュアル – 複雑なチャート不要、純粋な市場の強さを表示 迅速な意思決定 – スキャルピングやスイングトレードに最適 完全にカスタマイズ可能 – 自分のトレードスタイルに合わせてパラメータを調整 他のインジケーターとの
インディケータは現在のクオートを作成し、これを過去のものと比較して、これに基づいて価格変動予測を行います。インジケータには、目的の日付にすばやく移動するためのテキスト フィールドがあります。 オプション: シンボル - インジケーターが表示するシンボルの選択; SymbolPeriod - 指標がデータを取る期間の選択; IndicatorColor - インジケータの色; HorisontalShift - 指定されたバー数だけインディケータによって描画されたクオートのシフト; Inverse - true は引用符を逆にします。false - 元のビュー。 ChartVerticalShiftStep - チャートを垂直方向にシフトします (キーボードの上下矢印)。 次は日付を入力できるテキストフィールドの設定で、「Enter」を押すとすぐにジャンプできます。
MA Distance Histogram
Pablo Filipe Soares De Almeida
MA Distance Histogram MA Distance Histogram は、終値(Close)と移動平均線(Moving Average)の距離をヒストグラム形式で表示する指標で、市場における買いと売りの力を明確に視覚化できます。 正の値(緑のバー)は価格が移動平均線の上にあることを示し、買い圧力(強気)を表します。 負の値(赤のバー)は価格が移動平均線の下にあることを示し、売り圧力(弱気)を表します。 この指標は ATR(Average True Range)を使用して距離を正規化し、異なるボラティリティ条件やあらゆる資産・時間足においてより正確な読み取りを可能にします。その結果、強い動きと弱い動きを比例的に比較できます。 移動平均線をヒストグラムとして使用する利点 トレンドの強さを識別しやすくなります。 価格と移動平均線の距離を明確かつ客観的に視覚化できます。 買われ過ぎ・売られ過ぎの可能性ゾーンを検出するのに役立ちます。 ヒストグラムがゼロラインをクロスするとモメンタムの変化を示します。 トレンドと強さの両方のオシレーターとして機能します。 追加機能 移動平均線の
RAD CRITICAL LEVES RAD indicator tracks “Relevant Volume” in real time, identifying accumulation and distribution processes, projecting them in the chart as SUPPORT or RESISTANCE zones. Natural   support   and resistance levels are generated by Volume Accumulation and Distribution processes. As these processes evolve, levels at which the relevant volume in the market place is positioned, become difficult areas to cross upwards or downwards. By using this information, traders can identify very s
The delta indicator is used to display the difference between the volume that passed on the exchange at the Ask price and above (market buys) and the volume that passed at the Bid price and below (market sales). This indicator shows the delta of each candle on the timeframe of your choice. The data is displayed as a colored histogram in a separate indicator window. The indicator is calculated from the tick history, therefore, to speed up the calculations and reduce the load on the system, the n
Volume Profile Pro Signals  精密な出来高分析と自動シグナル生成の統合。 機能概要 Volume Profile Pro Signals は、どの価格帯に実際の取引ボリュームが集中しているかをデータに基づきリアルタイムで可視化します。POC、VAH、VAL を強調表示し、HVN/LVN エリアも正確に識別します。これに基づき VAH/VAL のブレイクアウトをリアルタイムで検出し、ATR に基づく賢い SL/TP をプロットします。 プロファイルの解像度からアラート種別まで、すべての要素をトレードスタイルに合わせて細かく調整可能です。短期スキャルピングから複数日をまたぐポジショントレードまで対応します。 主な特徴 Price-by-Volume の視覚化:MT5 チャート上で Point of Control と Value Area を直接表示。 ブレイクアウトアラート:価格が VAH を上抜け、または VAL を下抜けた際に即時通知。 適応型リスクレベル:ATR に基づく自動 SL/TP 設定。 スマートフィルタ:EMA トレンドフィルタや POC 傾
An ICT fair value gap is a trading concept that identifies market imbalances based on a three-candle sequence. The middle candle has a large body while the adjacent candles have upper and lower wicks that do not overlap with the middle candle. This formation suggests that there is an imbalance where buying and selling powers are not equal. Settings Minimum size of FVG (pips) -> FVGs less than the indicated pips will be not be drawn Show touched FVGs Normal FVG color -> color of FVG that hasn't
FREE
Do you use volume in your reading of the market? Certainly many traders use it, and do not imagine operating without it. The Color Histogram Volume Set indicator allows the user to choose the value that he considers interesting to monitor. When you pass this you will have visual confirmation and if you want you will also have the audible alert that is given by the indicator. Of course, there are other ways to try to find a high volume, such as assessing whether the volume is above av
Volume Bubble Pro は、MetaTrader 5 用の高度な視覚化ツールであり、取引高を価格チャート上に直接表示します。画面下部の独立したヒストグラムに頼るのではなく、このインジケーターは動的な円(バブル)を使用して、各ローソク足のボリューム強度を直接示します。 なぜ Volume Bubble Pro なのか? 標準のボリューム表示は絶対的な数値を示すだけで、文脈(コンテキスト)に欠けることがよくあります。Volume Bubble Pro は、現在のボリュームを前の期間の平均と統計的に比較します。これにより、トレーダーはボリュームの急増が重要な市場参加を意味するのか、それとも単なる通常のノイズなのかを即座に判断できます。 主な特徴: インテリジェント・ポジショニング: 明確さを最大化するため、買いシグナル(緑)はローソク足の下に、売りシグナル(赤)はローソク足の上に配置されます。これにより、現在の価格アクションとの重なりを防ぎます。 アンカー表示: 各バブルは細い線(アンカー)を介してローソク足にしっかりと接続されています。これにより、急激な市場の動きやチャートのズ
Real Volume N1 – Accurate Volume Insight for Every Candle The Real Volume N1 indicator works with both real volumes and tick volumes. However, I highly recommend using real volumes only, as tick volumes cannot reliably indicate how much was actually bought or sold. To get the most accurate results, use this indicator with brokers that provide real volume data, Works on any timeframe from m1 to month On every candle, the indicator displays the exact volume, helping professional traders make i
Breakout Boxes with Volume Pressure This indicator automates the identification of key consolidation zones (Supply and Demand) based on Market Pivots and Volatility (ATR). Unlike standard support/resistance tools, this indicator provides a unique   Volume Pressure Analysis   inside every box, giving you insight into the battle between Buyers and Sellers before a breakout occurs. Key Features Automated Supply & Demand Zones:   Automatically detects significant Pivot Highs and Lows to draw dyna
WAPV Box Effort x Result
Eduardo Da Costa Custodio Santos
MT5のWA_PV_BOX_EFFORTXRESULT WAPV Box Effort x Result Indicatorは、Package Indicatorsグループ(Wyckoff Academy Wave Market)の一部です。 MT5のWAPVボックスエフォートx結果インジケーターは、価格とボリュームを読み取るのに役立ちます。その読みは、努力×結果の特定を支援することで構成されています グラフによって作成された波で。 ボックスが緑色の場合のMT5のWAPVボックスの労力x結果インジケーターは、ボリュームが需要に有利であり、ボックスが赤色の場合を意味します ボリュームは供給に有利です。 ボックスが大きいほど、価格に対するボリュームの変位が大きくなります。価格の上昇波がボックスのサイズに比例しない場合、 努力×結果。 非常に視覚的な方法で、ボリュームと価格の間のこの相違を識別できます。 MT5のWAPVBoxEffort x Result Indicatorを使用すると、インジケーターをゼロ軸の下に配置することで、視覚化を向上させることもできます。 ティックボリュームとリア
This is a   Market Depth (DOM - Depth of Market) Indicator   for MetaTrader 5 that displays real-time order book data in a visual ladder format. The DOM provides a comprehensive view of market depth with clear visual cues for volume imbalances, making it useful for both scalping and swing trading decisions This indicator provides traders with a professional-grade market depth visualization that can be customized to match individual trading preferences and strategies.  You can easily switch betwe
Deriv Synthetic HTF Candle Projection GMT2 Higher Timeframe Candle Projection & Previous Levels Tool for Deriv Synthetic Indices (MT5) Overview Deriv Synthetic HTF Candle Projection GMT2 is a professional MetaTrader 5 indicator built specifically for Deriv Synthetic indices . It projects the current forming Higher Timeframe (HTF) candle onto the chart and automatically draws key reference levels from previous candles. This indicator is designed to help traders maintain higher timeframe context
FREE
Was: $299  Now: $99  Supply Demand uses previous price action to identify potential imbalances between buyers and sellers. The key is to identify the better odds zones, not just the untouched ones. Blahtech Supply Demand indicator delivers functionality previously unavailable on any trading platform. This 4-in-1 indicator not only highlights the higher probability zones using a multi-criteria strength engine, but also combines it with multi-timeframe trend analysis, previously confirmed swings a
The market is unfair if only because 10% of participants manage 90% of funds. An ordinary trader has slim changes to stand against these "vultures". This problem can be solved. You just need to be among these 10%, learn to predict their intentions and move with them. Volume is the only preemptive factor that faultlessly works on any timeframe and symbol. First, the volume appears and is accumulated, and only then the price moves. The price moves from one volume to another. Areas of volume accumu
The "MR Volume Profile 5" indicator is a charting tool that displays trading volume at different price levels rather than time intervals. A key concept in volume profile is the point of control (POC)—the price level with the highest volume traded during the session or time range. While tools like VWAP or OBV provide volume trends, the "MR Volume Profile 5" indicator offers granular detail about where the most market activity occurs at specific price levels. This makes it a more precise tool for
Was: $249  Now: $99   Market Profile defines a number of day types that can help the trader to determine market behaviour. A key feature is the Value Area, representing the range of price action where 70% of trading took place. Understanding the Value Area can give traders valuable insight into market direction and establish the higher odds trade. It is an excellent addition to any system you may be using. Inspired by Jim Dalton’s book “Mind Over Markets”, this indicator is designed to suit the
Version for MetaTrader 5. The indicator is based on point and figure chart, but their period is equal to ATR indicator values. Displays in the form of steps. Steps above zero indicate an uptrend. Below zero on a downtrend. Parameters: ATRPeriod - ATR period for calculation of steps. Note: The indicator uses closes price, thus it is recommended to consider completed bars.
This product is designed for the MT5 platform and offers two key features: VWAP (Volume Weighted Average Price) calculation and Volume Profile analysis. Advantages: VWAP Calculation: The product calculates the VWAP, which is a popular indicator used by traders to determine the average price of a security based on its trading volume. It helps identify potential buying or selling opportunities by comparing the current price to the average price weighted by volume. Volume Profile Analysis: The prod
KT Volume Profile は、取引量の蓄積データをY軸上にヒストグラムとして表示するインジケーターです。指定された時間範囲や価格帯におけるトレーディングアクティビティを視覚的に把握することが可能です。 Volume Profile における POC(ポイント・オブ・コントロール) POC は、プロファイル全体の中で最も取引量が多かった価格レベルを示します。この価格帯はサポートやレジスタンスとして、また価格が方向転換前に再度試す重要なレベルとして使われることが多いです。 特徴 非常に簡単に使えます。チャート上で四角形をドラッグ&ドロップするだけで、リアルタイムでボリュームプロファイルが更新されます。 価格がPOCを越えたときにアラートを出すことが可能です。 ゼロから設計され、CPUとメモリの使用を最小限に抑えています。 入力パラメーター ボリュームソース:   ティックボリューム / 実際の取引量。 プロファイルの色:   ヒストグラムの表示色。 ボックスの幅:   四角形の横幅。 ボックスの色:   四角形の色。 POC を表示:   true/false POCの色:
Market Profile Heat indicator  — is a classic Market Profile implementation that can show the price density over time, outlining the most important price levels, value area, and control value of a given trading session. This indicator can be attached to timeframes between M1 and D1 and will show the Market Profile for daily, weekly, monthly, or even intraday sessions. Lower timeframes offer higher precision. Higher timeframes are recommended for better visibility. It is also possible to use a fr
Trade Like an Institution. Protect Like a Professional. Early Sniper Access: Limited Launch Offer! Get ready to elevate your trading precision. We are offering an exclusive, highly limited launch price for the first Dynamic Trend Sniper users. Our Unbeatable Launch Offer: First 10 Snipers Only: $69 (Full lifetime access + all v1.x updates) Standard Retail Price (After 10 Purchases): $129 Why Act Now? This is not just a discount; it's a strategic entry point. We are committed to rewarding
Candle Time Phases Et Indicator - Split any candle into three time-based phases and control the sequential development of the candle in real time. Candle Time Phases is a precision timing indicator that divides the current candle into three time-based phases as a percentage of its total duration. The indicator determines and clearly separates the initial uncertainty phase, the main movement, and the completion phase, while also analyzing the structure and sequential development of the candle in
FREE
FVG Volume Profile (Institutional Price Action) Unlock the hidden liquidity inside Market Imbalances. The   FVG Volume Profile   is an advanced Price Action indicator that goes beyond standard Fair Value Gap detection. It looks inside the gap using lower timeframe data to construct a   Volume Profile   specifically for that imbalance. This helps you identify exactly where the "Smart Money" is defending positions. Key Features:   Internal Volume Profile:   Automatically scans lower timeframes
The Volume+ and VSA Signals indicator for MT5 is based on the Volume Spread Analysis (VSA) methodology to provide the signals. The signals are displayed at closing of bars on the main window or subwindow in the form of symbols. The symbols are not repainting.  The indicator produces a signal on an individual bar and this signal is not buy or sell signal. When a minor trend goes in the opposite direction of a major trend, there are sequences of major trend-following signals that give a higher pro
This indicator is a conventional analytical tool for tick volumes changes. It calculates tick volumes for buys and sells separately, and their delta on every bar, and displays volumes by price clusters (cells) within a specified bar (usually the latest one). The algorithm used internally is the same as in the indicator VolumeDeltaMT5 , but results are shown as cumulative volume delta bars (candlesticks). Analogous indicator for MetaTrader 4 exists - CumulativeDeltaBars . This is a limited substi
Bookmap pro
Ahmed Mohammed Bakr Bakr
FREE Bookmap Volume Heatmap Indicator Overview The   Bookmap Volume Heatmap   is a custom MetaTrader 5 (MQL5) indicator that creates a visual heatmap of trading volume distribution across price levels, similar to professional trading platforms like Bookmap. It provides traders with a clear visualization of where significant trading activity has occurred within a specified price range. Key Features 1.   Volume Distribution Visualization Creates color-coded rectangles on the chart representing vol
FREE
Visual Book
Gustavo Barbeiro Alonso
A visual Order Book is a powerful tool used in the financial market to provide a detailed view of buy and sell orders in a given financial instrument in real time. This visual representation allows traders to observe the liquidity available in the market, identify the supply and demand levels at different prices and follow the evolution of orders as they are placed, modified or withdrawn. By analyzing the visual Order Book, traders can identify trading patterns, detect possible reversal point
The Mirror Chart MT5 is a overlay indicator specifically designed to project a second financial instrument directly onto the main chart window. This tool is invaluable for traders who rely on correlation analysis, as it visualizes the price movements of two different instruments in real time. Unlike traditional overlays, this indicator utilizes intelligent, dynamic centering and scaling logic. It continuously analyzes the visible price range in the current window for both symbols and calculates
FREE
このプロダクトを購入した人は以下も購入しています
SuperScalp Pro
Van Minh Nguyen
4.57 (21)
SuperScalp Pro – 高度なマルチフィルタースキャルピングインジケーターシステム SuperScalp Pro は、クラシックな Supertrend と複数のインテリジェント確認フィルターを組み合わせた高度なスキャルピングインジケーターです。M1 から H4 まで複数の時間足で効率的に動作し、XAUUSD、BTCUSD、主要 Forex 通貨ペア向けに最適化されています。 このインジケーターは明確な Buy / Sell シグナルを提供し、ATR に基づいてエントリー価格、Stop Loss、Take Profit を自動計算します。Fibonacci Take Profit 機能により、重要な価格帯で早期決済し、到達時に通知を送信します。 初期設定では Fibonacci Take Profit が有効化されており、より安定した取引体験を重視しています。チャートに適用するだけですぐ利用可能です。上級者向けに、すべてのパラメータは自由にカスタマイズできます。 EMA、RSI、ADX、Volume、VWAP、Bollinger Bands、MACD Divergence な
このインジケーターを購入された方には、以下の特典を 無料 で提供しています: 各トレードを自動で管理し、ストップロスとテイクプロフィットを設定し、戦略ルールに基づいてポジションを決済する補助ツール 「Bomber Utility」 様々な銘柄に合わせたインジケーターの設定ファイル(セットファイル) 「最小リスク」、「バランスリスク」、「待機戦略」 の3つのモードで使用できる Bomber Utility 用の設定ファイル このトレーディング戦略をすぐに導入・設定・開始できる ステップバイステップのビデオマニュアル ご注意: 上記の特典を受け取るには、MQL5のプライベートメッセージシステムを通じて販売者にご連絡ください。 オリジナルのカスタムインジケーター 「Divergence Bomber(ダイバージェンス・ボンバー)」 をご紹介します。これは、MACDのダイバージェンス(乖離)戦略に基づいた 「オールインワン」型のトレーディングシステム です。 このテクニカルインジケーターの主な目的は、価格とMACDインジケーターの間に発生するダイバージェンスを検出 し、将来の価格の動きを示す
Entry In The Zone and SMC Multi Timeframe is a real-time 2-in-1 market analysis tool that combines market structure analysis and a No Repaint BUY / SELL signal system into a single indicator, built on Smart Money Concepts (SMC) — a widely adopted framework used by professional traders to understand market structure. This indicator helps you see the market more clearly, make decisions based on structure rather than guesswork, and focus on high-probability zones where price is more likely to react
Azimuth Pro
Ottaviano De Cicco
5 (6)
Azimuth Pro V2:MT5向けシンセティック・フラクタル構造分析と確認済みエントリー 概要 Azimuth Pro は Merkava Labs によるマルチレベルスイング構造インジケーターです。4つのネストされたスイングレイヤー、スイングアンカーVWAP、ABCパターン検出、3タイムフレーム構造フィルタリング、そして確定バーでの確認済みエントリー — 1つのチャートで、ミクロスイングからマクロサイクルまでを網羅するワークフロー。 これはブラインドシグナル製品ではありません。ロケーション、コンテキスト、タイミングを重視するトレーダーのための構造ファーストワークフローです。 V2発売記念オファー — Azimuth Pro V2をUSD 399で(次の100本)。最終価格:USD 499。 1. V2での変更点 シンセティック・マルチタイムフレームエンジン 上位タイムフレーム分析をMeridian Proと同じ独自のシンセティックアーキテクチャで一から再構築。よりクリーンなHTFコンテキスト、安定したライブ動作、従来のMTF同期問題なし。シンセティックエンジンは 固定比率タ
Quantum TrendPulse を ご紹介します。これは、   SuperTrend   、   RSI   、および Stochastic のパワーを 1 つの包括的なインジケーターに組み合わせて、取引の可能性を最大限に引き出す究極の取引ツールです。精度と効率を求めるトレーダー向けに設計されたこのインジケーターは、市場のトレンド、勢いの変化、最適なエントリー ポイントとエグジット ポイントを自信を持って特定するのに役立ちます。 主な特徴: SuperTrend 統合: 現在の市場動向に簡単に追従し、収益性の波に乗ることができます。 RSI精度: 買われすぎと売られすぎのレベルを検出し、市場の反転のタイミングに最適で、SuperTrendのフィルターとして使用されます。 確率的精度: 確率的振動を活用して、変動の激しい市場で隠れたチャンスを見つけます。SuperTrend のフィルターとして使用されます。 マルチタイムフレーム分析:   M5 から H1 または H4 まで、さまざまなタイムフレームで市場を常に把握します。 カスタマイズ可能なアラート: カスタム取引条件が満たされ
Power Candles – あらゆる市場に対応した強度ベースのエントリーシグナル Power Candles は、Stein Investments が長年培ってきた強度分析を価格チャート上に直接反映します。価格だけに反応するのではなく、各ローソク足は実際の市場の強さに基づいて色分けされ、モメンタムの蓄積、強度の加速、明確なトレンド転換を瞬時に把握できます。 すべての市場に共通する単一ロジック Power Candles は すべての取引シンボル で自動的に動作します。現在のシンボルが Forex か非 Forex 市場かを自動判別し、内部で適切な強度モデルを適用します。 Forex および Gold :FX Power のデルタ値を使用(絶対値レンジ最大 100) 指数、暗号資産、CFD :IX Power の強度値を使用(絶対値レンジ最大 50) 必要な強度計算は Power Candles に直接組み込まれています。ローソク足のカラーリングやシグナルロジックに、追加のインジケーターは不要です。 価格ノイズではなく「強度状態」 各ローソク足は、以下の 9 つの明確に定義された強
Gann Made Easy   は、ミスター・ギャンの理論を使用した取引の最良の原則に基づいた、プロフェッショナルで使いやすい外国為替取引システムです。 W・D・ガン。このインジケーターは、ストップロスとテイクプロフィットレベルを含む正確な買いと売りのシグナルを提供します。 PUSH通知を利用して外出先でも取引可能です。 ご購入後、取引方法の説明と優れた追加インジケーターを無料で入手するには、私にご連絡ください! おそらく、ギャンの取引手法についてはすでに何度も聞いたことがあるでしょう。通常、ギャンの理論は初心者のトレーダーだけでなく、すでにある程度の取引経験がある人にとっても非常に複雑なものです。なぜなら、ギャンの取引手法は理論的にはそれほど簡単に適用できるものではないからです。私はその知識を磨き、最良の原則を私の外国為替インジケーターに組み込むために数年を費やしました。 このインジケーターは非常に簡単に適用できます。必要なのは、それをチャートに添付し、簡単な取引推奨事項に従うだけです。このインジケーターは常に市場分析の仕事を行い、取引の機会を探します。適切なエントリーポイントを検
OmniSync Projection
Antonio-alin Teculescu
5 (1)
Chronos Fractal Engine is an innovative price projection indicator for MetaTrader 5, designed to transform your technical analysis by intelligently identifying and projecting historical price patterns. Built upon an advanced correlation algorithm and the fractal principles of the market, this powerful tool visualizes potential future price movements, giving you a unique edge in your trading decisions. What is Chronos Fractal Engine? At its core, the Chronos Fractal Engine employs a sophisticat
このインジケーターを購入すると、プロ仕様のトレードマネージャーを無料で差し上げます。 まず第一に、このトレーディングシステムがノンリペイント、ノンリドロー、ノンラグのインジケーターであることを強調する価値がある。これにより、手動取引とロボット取引の両方に理想的なものになっています。 オンラインコース、マニュアル、プリセットのダウンロード。 「スマートトレンドトレーディングシステム MT5」は、新規および経験豊富なトレーダー向けにカスタマイズされた包括的なトレーディングソリューションです。10以上のプレミアムインジケーターを組み合わせ、7つ以上の堅実なトレーディング戦略を備えており、多様な市場状況に対応する多目的な選択肢となっています。 トレンドフォロー戦略:トレンドを効果的に乗り越えるための正確なエントリーとストップロス管理を提供します。 リバーサル戦略:潜在的なトレンドの反転を特定し、トレーダーがレンジ相場を活用できるようにします。 スキャルピング戦略:高速で正確なデイトレードおよび短期取引のために設計されています。 安定性:すべてのインジケーターはノンリペイント、ノンリドロー、ノ
ご紹介     Quantum Breakout PRO は 、ブレイクアウト ゾーンの取引方法を変革する画期的な MQL5 インジケーターです。 13年以上の取引経験を持つ経験豊富なトレーダーのチームによって開発されました。     クォンタム ブレイクアウト プロ   は、革新的でダイナミックなブレイクアウト ゾーン戦略により、あなたのトレーディングの旅を新たな高みに押し上げるように設計されています。 クォンタム ブレイクアウト インジケーターは、5 つの利益ターゲット ゾーンを備えたブレイクアウト ゾーン上のシグナル矢印と、ブレイクアウト ボックスに基づいたストップロスの提案を提供します。 初心者トレーダーにもプロのトレーダーにも適しています。 量子EAチャネル:       ここをクリック 重要!購入後、インストールマニュアルを受け取るためにプライベートメッセージを送ってください。 推奨事項: 時間枠: M15 通貨ペア: GBPJPY、EURJPY、USDJPY、NZDUSD、XAUUSD アカウントの種類: ECN、Raw、またはスプレッドが非常に低い R
優れたテクニカルインジケーター「Grabber」をご紹介します。これは、すぐに使える「オールインワン」トレーディング戦略として機能します。 ひとつのコードに、市場のテクニカル分析ツール、取引シグナル(矢印)、アラート機能、プッシュ通知が強力に統合されています。 このインジケーターを購入された方には、以下の特典を無料で提供します: Grabberユーティリティ:オープンポジションを自動で管理するツール ステップバイステップのビデオマニュアル:インジケーターのインストール、設定、取引方法を解説 カスタムセットファイル:インジケーターをすばやく自動設定し、最大限の成果を出すための設定ファイル 他の戦略はもう忘れてください!Grabberだけが、あなたを新たなトレードの高みへと導いてくれるのです。 Grabber戦略の主な特徴: 推奨タイムフレーム:M5〜H4 対応通貨ペア・資産:どれでも使用可能ですが、私が実際に検証した以下を推奨します(GBPUSD、GBPCAD、GBPCHF、AUDCAD、AUDUSD、AUDSGD、AUDCHF、NZDUSD、NZDCAD、EURCAD、EURUSD、E
FX Trend NG:次世代マルチマーケット・トレンドインテリジェンス 概要 FX Trend NG は、複数の時間足に対応したプロフェッショナル向けトレンド分析およびマーケット監視ツールです。 市場全体の構造を数秒で把握することができます。 複数のチャートを切り替える必要はありません。どの銘柄がトレンド中なのか、どこでモメンタムが弱まっているのか、そしてどの時間足で強い整合性があるのかを瞬時に確認できます。 ローンチ特別オファー – FX Trend NG を $30(6ヶ月) または $80 永久ライセンス でご利用いただけます。 すでに Stein Investments のユーザーですか? -> メッセージを送信 して、プライベートグループへアクセスしてください。 セットアップや詳細情報が必要ですか? -> Stein Investments 公式ページ をご覧ください。 1. FX Trend NG が他と異なる理由 3ステート・トレンドロジック ― Buy と Sell だけではない • 多くのインジケーターは Buy または Sell の2状態のみを表示します。
まず正直に言いましょう。 どんなインジケーターも、それ単体であなたを利益化させることはできません。もしそう言う人がいるなら、それは夢を売っているだけです。完璧な売買シグナル(矢印)を表示するインジケーターは、いくらでも“完璧に見せる”ことができます。正しい過去の区間を拡大して、勝ちトレードだけを切り取ればいいだけです。私たちはそれをしません。 SMC Intraday Formula はツールです。 市場構造を読み取り、最も高い確率の価格ゾーンを特定し、今この瞬間のスマートマネーの痕跡をシンプルな言葉で正確に示します。最終判断はあなたが行います。トレードを実行するのもあなたです。しかし今は「希望」ではなく「精度」でエントリーできます。 私たちはこのインジケーターを、ゴールド(XAUUSD)および主要FX通貨ペアで約3年間、日々のスキャルピングに使用してきました。M1、M5、M15、M30の主要ツールです。これは未来を予測しようとするのではなく、今まさに形成されている高確率セットアップを示し、その理由を説明します。 他のすべてのインジケーターと何が違うのか? ほとんどのトレーディングイ
あなたのシンボルでどの戦略が実際に機能するか確認しましょう - リアルマネーをリスクにさらす前に。 Power Barは、あらゆるシンボルとあらゆるタイムフレームで 極端な価格バー を検出し、3つの異なるトレード戦略を即座にバックテストします。勝率、プロフィットファクター、損益を並べて比較できます。すべてが1つのインタラクティブなパネルに集約されています。 推測なし。カーブフィッティングなし。データだけです。 Power Barが特別な理由 ほとんどのインジケーターはシグナルを出すだけで、それが機能するかどうかは推測に任されます。Power Barはさらに先を行きます - すべてのシグナルを 3つの戦略 に対してテストし、統計を表示します。FlipFlop、Momentum、Reversalをワンクリックで切り替え、数値が即座に変化するのを確認できます。 FlipFlop - 常にポジションを保有。シグナルでエントリーし、反対シグナルでイグジット。当社のリサーチでは、US30、US500、DAXなどのトレンドのあるインデックスで最も効果的です。 Momentum - シグナルの方向に
CGE Trading Suite
Carl Gustav Johan Ekstrom
5 (2)
Institutional-Grade Analytics for MT5 C GE Trading Suite delivers the analytical edge typically reserved for professional trading desks. The platform integrates a full suite of analytical tools into one seamless workflow: dynamic grid mapping, liquidity behavior analysis, ECM, trend lines, MIDAS, trade cycles, and directional channel projections. Together, these provide a unified view of market structure and momentum. Directional clarity is further enhanced by the capital flow index, which meas
まず第一に、この取引インジケーターは再描画されず、再描画されず、遅延しないことを強調する価値があります。これにより、手動取引とロボット取引の両方に理想的なものになります。 ユーザーマニュアル:設定、入力、戦略。 アトミックアナリストは、価格の強さとモメンタムを利用して市場でより良いエッジを見つけるためのPA価格アクションインジケーターです。ノイズや誤ったシグナルを除去し、取引ポテンシャルを高めるための高度なフィルターを備えています。複雑なインジケーターの複数のレイヤーを使用して、アトミックアナリストはチャートをスキャンし、複雑な数学的計算をシンプルなシグナルと色に変換します。これにより、どのような初心者トレーダーでも理解して使用し、一貫した取引の決定を行うことができます。 「アトミックアナリスト」は、新規および経験豊富なトレーダー向けにカスタマイズされた包括的な取引ソリューションです。プレミアムインジケーターとトップノッチの機能を1つの取引戦略に組み合わせ、すべてのタイプのトレーダーにとって汎用性のある選択肢にします。 デイリートレーディングとスキャルピング戦略:高速で正確なデイ
トレンド スクリーナー インジケーターでトレンド取引の力を解き放ちます。ファジー ロジックと複数通貨システムを活用した究極のトレンド取引ソリューションです。 ファジー ロジックを活用した革新的なトレンド インジケーターである Trend Screener を使用して、トレンド取引を向上させます。 これは、13 を超えるプレミアム ツールと機能、および 3 つの取引戦略を組み合わせた強力なトレンド追跡インジケーターであり、Metatrader をトレンド アナライザーにする多用途の選択肢となります。 期間限定オファー : トレンド スクリーナー インジケーターは、わずか 100 ドルで生涯ご利用いただけます。 (元の価格 50$ ) (オファー延長) Trend Screener の 100% 非再描画精度の揺るぎない精度を体験して、取引の決定が過去の価格変動の影響を受けないようにしてください。 マルチタイムフレームおよびマルチ通貨機能の多用途性を解放し、比類のない自信を持って外国為替、商品、暗号通貨、インデックスの世界を取引できるようにします。 Trend Screener の包括的な
FX Power: 通貨の強弱を分析して、より賢い取引を実現 概要 FX Power は主要通貨と金の実際の強弱をあらゆる市場状況で理解するための必須ツールです。強い通貨を買い、弱い通貨を売ることで、 FX Power は取引の意思決定を簡素化し、高い確率の取引機会を見出します。トレンドを追従する場合でも、極端なデルタ値を使用して反転を予測する場合でも、このツールはあなたの取引スタイルに完全に適応します。ただ取引するだけではなく、 FX Power で賢く取引をしましょう。 1. なぜ FX Power がトレーダーにとって非常に有益なのか 通貨と金のリアルタイム強弱分析 • FX Power は主要通貨と金の相対的な強弱を計算し、マーケットダイナミクスに関する明確な洞察を提供します。 • どの資産がリードしているか、または後れを取っているかを監視して、取引するペアを賢く選びましょう。 マルチタイムフレームの包括的なビュー • 短期、中期、長期のタイムフレームで通貨と金の強弱を追跡し、マーケットトレンドに基づいて取引戦略を調整できます。 • スキャルピングからスイングトレード
BTMM State Engine Pro is a MetaTrader 5 indicator for traders who use the Beat The Market Maker approach: Asian session context, kill zone timing, level progression, peak formation detection, and a multi-pair scanner from a single chart. It combines cycle state logic with a built-in scanner dashboard so you do not need the same tool on many charts at once. What it does Draws the Asian session range; session times can follow broker server offset or be set in inputs. Tracks level progression (L
Crystal Heikin Ashi Signals - Professional Trend & Signal Detection Indicator Advanced Heikin Ashi Visualization with Intelligent Signal System for Manual & Automated Trading Final Price: $149 ---------> Price goes up $10 after every 10 sales . Limited slots available — act fast . Overview Crystal Heikin Ashi Signals is a professional-grade MetaTrader 5 indicator that combines pure Heikin Ashi candle visualization with an advanced momentum-shift detection system. Designed for both manual traders
Berma Bands
Muhammad Elbermawi
5 (8)
Berma Bands (BBs) インジケーターは、市場のトレンドを特定して活用したいトレーダーにとって貴重なツールです。価格と BBs の関係を分析することで、トレーダーは市場がトレンド段階にあるか、レンジ段階にあるかを判断できます。 詳細については、[ Berma Home Blog ] をご覧ください。 バーマ バンドは、上部バーマ バンド、中部バーマ バンド、下部バーマ バンドの 3 つの異なる線で構成されています。これらの線は価格の周りにプロットされ、全体的な傾向に対する価格の動きを視覚的に表します。これらのバンド間の距離から、ボラティリティや潜在的な傾向の反転についての洞察を得ることができます。 バーマ バンドの線がそれぞれ離れると、市場が横ばいまたはレンジ相場の期間に入っていることを示すことがよくあります。これは、明確な方向性の偏りがないことを示しています。トレーダーは、これらの期間中にトレンドを特定するのが難しいと感じる可能性があり、より明確なトレンドが出現するまで待つ場合があります。 バーマ バンドの線が 1 本の線に収束すると、強いトレンド環境の兆候となること
Meridian Pro
Ottaviano De Cicco
5 (1)
Meridian Pro:MT5用プロフェッショナル・マルチタイムフレーム・トレンドマトリックス 概要 Meridian Pro は Merkava Labs が開発したマルチタイムフレーム・トレンドマトリックスで、方向性の状態、強度、モメンタムの状況、マトリックスの合意をひとつのコンパクトなパネルに集約します。ひとつのアダプティブエンジンがM1からW1まで一貫して適用されます。シンボルごとの調整は不要。インジケーターの積み重ねも不要。すべてのアセットとすべてのタイムフレームをカバーするひとつの構造化された読み取りです。 発売キャンペーン — Meridian Proを USD 99 (導入価格)で入手。通常価格:USD 149 。 1. Meridian Proが他と異なる理由 ひとつのエンジン、バラバラなインジケーターのダッシュボードではない 多くのMTFダッシュボードは、タイムフレームごとに生のインジケーター値を繰り返すだけです。Meridian Proはマトリックス全体でひとつのアダプティブ・トレンドエンジンを使用するため、パネルの各行が同じ構造化フレームワークから導出されます
Bill Williams Advanced is designed for automatic chart analysis using Bill Williams' "Profitunity" system. The indicator analyzes four timeframes at once. Manual (Be sure to read before purchasing) Advantages 1. Analyzes the chart using Bill Williams' "Profitunity" system. Signals are displayed in a table in the corner of the screen and on the price chart. 2. Finds all known AO and AC signals, as well as zone signals. Equipped with a trend filter based on the Alligator. 3. Finds "Divergence Bar
Auto Optimized Parabolic RSI: 高度な3Dモメンタムエンジン ほとんどのリテール向けインジケーターは、市場のボラティリティが変化した瞬間に破綻する静的な入力値に依存しているため、失敗に終わります。Auto Optimized Parabolic RSIは、自らの数学的優位性を継続的に再計算することで「インジケーターの陳腐化」問題を解決し、機関投資家レベルの定量的適応力をMT5ターミナルに直接もたらします。 最大の強み: カスタムインメモリ3D最適化 標準的な自動最適化ツールは、インジケーターの呼び出しで端末に過負荷をかけるため、頻繁にMT5プラットフォームをフリーズさせます。本ツールは、このボトルネックを完全に回避しています。RAMベースのカスタムネイティブ計算機を内蔵した内部エンジンは、チャートを読み込んだりタイムフレームを変更したりするたびに、超高速の3Dグリッド探索を実行します。RSI期間(頻度)、SARステップ(加速度)、SAR最大値(制限速度)を同時にスイープし、プラットフォームを遅延させることなく、数万通りものパラメーターの組み合わせを絶対的なミ
Market Structure Order Block Dashboard MT5 は、チャート上でマーケットストラクチャーと主要な価格反応ゾーンを直接読み取りたいトレーダー向けに設計された MT5 インジケーターです。BOS、ChoCH、Order Blocks、Fair Value Gaps (FVG)、Liquidity、Kill Zones、Volume Profile、そして高速分析のためのコンパクトな dashboard を組み合わせています。 このインジケーターは、マーケットストラクチャー、ICT コンセプト、Smart Money コンセプトを意思決定の基準として使うトレーダー向けに作られています。トレンド継続、反転の可能性、価格の不均衡、流動性ターゲット、重要な注目ゾーンを、より構造的に把握するのに役立ちます。 Version 1.19 では重要な機能が追加されました。 Pending BOS / Pending ChoCH detection です。ローソク足が前回の swing を超えてクローズすると、標準的な swing 確認を待たずに、インジケーターが pe
ARICoin is a powerful trading companion designed to generate high-probability entry signals with dynamic TP/SL/DP levels based on volatility. Built-in performance tracking shows win/loss stats, PP1/PP2 hits, and success rates all updated live. Key Features: Buy/Sell signals with adaptive volatility bands Real-time TP/SL/DP levels based on ATR Built-in MA Filter with optional ATR/StdDev volatility Performance stats panel (Success, Profit/Loss, PP1/PP2) Alerts via popup, sound, push, or email Cust
SignalTech MT5 is a trading system for EURUSD, USDCHF, USDJPY, AUDUSD, NZDUSD, EURJPY, AUDJPY, NZDJPY, CADJPY H2 and H3 Timeframe.  It can generate signals with Buy/Sell Arrows and Pop-Up/Sound Alerts. Each signal has clear Entry and Stop Loss levels, which should be automatically flagged on the chart, as well as potential Targets 1, 2, and 3. The Entry and TP levels are fixed after the trade is taken. The exit level is dynamic. If there are signs of a potential short-term trend reversal, the
Smart Stop Indicator – チャート上で実現するインテリジェントなストップロス精度 概要 Smart Stop Indicator は、ストップロスを勘や感情ではなく、明確で体系的に設定したいトレーダーのために設計されています。本ツールは、クラシックなプライスアクション(高値更新・安値切り下げ)と最新のブレイクアウト認識ロジックを組み合わせ、次に来るべき論理的なストップレベルを正確に特定します。トレンド相場、レンジ、急速なブレイクアウト局面のいずれであっても、最適な SL ゾーンとその状態(“new”、“broken”、“valid”)をチャート上に直接表示します。さらに今回、SL 距離の %ADR 表示も新たに追加されています。 主な特徴 マーケット構造に基づく自動ストップ配置 • 市場構造とリアルタイムの値動きに基づき、意味のあるストップロスレベルを自動検出します。 スマートなブレイクアウト感知 • 急激な方向転換やブレイクアウトにも柔軟に対応し、早すぎるストップ調整を避けます。 SL %ADR の表示 • ストップロスまでの距離を ADR(Averag
Market Structure Patterns
Samuel Manoel De Souza
4.47 (19)
Available for   MT4   and   MT5 . Join the Market Structure Patterns channel to download materials available for study and/or additional informations. Related posts: Market Structure Patterns - Introduction Beyond Fancy Order Blocks: Using True Volumetric Analysis with Market Structure Patterns & Timeless Charts Market Structure Patterns – Complete SMC Indicator Guide (Concepts + Settings) Market Structure Patterns   is an indicator based on   smart money concepts   that displays   SMC/ICT   e
MERAVITH SCANNERは、MetaTrader 5用のプロフェッショナルな金融市場インジケーターで、複数の分析ツールを一つの統合システムにまとめています。独自の出来高加重平均価格(VWAP)手法を使用してすべての計算を自動で行い、主観的な解釈を完全に排除します。 このインジケーターは、すべての資産クラス(FX、株式、指数、商品、暗号通貨)およびM1から月足までのすべての時間軸で動作します。基本原理は「価格は出来高に従う」というものです。MERAVITHは機関投資家の出来高が集中するポイントを特定し、その集中から数学的に正確な価格レベルを導き出します。予測や投機は行わず、計算のみを行います。 MERAVITH SCANNERを使用すると、28の主要FX通貨ペアをすべての時間軸でわずか2~3分でスキャンできます。また、任意の市場をスキャンすることも可能です。例えば、約100銘柄の株式を約10分でスキャンできます。 インジケーターは、消耗レベル、均衡線、偏差、統計レベル、およびターゲット予測を算出します。 チャート要素 Origin Point :すべての計算が始まる起点です。イン
作者のその他のプロダクト
Black Bull Gold – Your Edge in the XAUUSDm or XAUUSD Markets Introducing Black Bull Gold, an advanced technical analysis-based Expert Advisor (EA) specifically crafted for high-frequency trading (HFT) on XAUUSD and DE30. This EA leverages sophisticated algorithms and real-time market data to enhance trading outcomes, making it an ideal tool for navigating the high volatility of these markets. Key Features Optimized for Volatile Assets: Black Bull  is built to handle the unique dynamics of XAUUS
FREE
Golden Vulture EA Expert Advisor for XAUUSD (Gold), DE30 (German DAX Index), and US30  Golden Vulture EA is a trading algorithm designed to automate trading strategies for XAUUSD (Gold), DE30 (German DAX Index), and US30. This Expert Advisor utilizes specific market conditions to generate entry and exit signals, manage risk through automatic stop-loss placement, and implement a trailing stop mechanism. Important: This EA is optimized for RAW SPREAD accounts with selected brokers. It may not fu
ADBIN BAND – Adaptive Channel Indicator for XAUUSD and DE30 Description: The ADBIN BAND is a trading indicator designed for analysis of   XAUUSD (Gold)   and   DE30 (German Stock Index) . It generates dynamic price channels using an   Adaptive Moving Average (AMA)   to reflect market volatility. Functionality: Dynamic Channels : Plots upper and lower bands around price, adjusting to volatility via AMA. Signal Generation : A   green arrow   appears when price closes above the upper band. A   r
Super Trend Indicator – Trend Following Tool Description: The Super Trend Indicator is a trend-following tool designed to assist traders in identifying market trends. Utilizing the Average True Range (ATR), it dynamically adjusts to market volatility and generates visual signals. The indicator plots lines directly on the chart, changing color based on trend direction. Crosses between the price and indicator line may suggest potential trend shifts. Key Features: Dynamic trend detection using ATR.
Product Name:   Quantum Core MT5 - Swing Trading EA for XAUUSD Description:   A swing trading expert advisor designed to execute 15-30 trades per month with built-in risk management parameters. Key Features: Algorithmic Strategy: Combines technical algorithms with market analysis for trade execution. Auto-Lot Sizing: Adjusts position sizes based on account equity (configurable). Risk Control: Options for manual SL/TP or dynamic risk parameters. Equity Limits: Built-in safety stop feature allows
SideZone: Trend Intensity Oscillator – Filter the Noise, Ride the Trend Overview SideZone is a specialized oscillator engineered to solve a common trader's dilemma: distinguishing between a true trend and a ranging market. By clearly visualizing trend direction and sideways consolidation, SideZone helps you stay on the right side of the move while avoiding the whipsaw of low-volatility environments. Its core function is to provide a clear, color-coded visual representation of market sentiment
The Advance Sideways Detector is a specialized technical indicator designed for the MetaTrader 5 platform with a single, focused purpose to accurately identify and filter out sideways range-bound markets. By isolating periods of low volatility and price consolidation, this tool helps traders avoid the whipsaws and false signals that often lead to losses, allowing them to focus on capturing strong directional moves. Unlike traditional oscillators that provide buy or sell signals, this detector ac
Important Note on Trading Restrictions In compliance with MQL5 Market rules, this Expert Advisor does not restrict trading to specific symbols. It can be attached to any chart. However, it is   optimized and recommended   exclusively for   XAUUSD (Gold)   and   XAGUSD (Silver)   . Using it on other instruments may result in poor performance. Overview Xiyana Zoka is a professional-grade scalping Expert Advisor designed for the MetaTrader 5 platform. Unlike conventional scalpers that enter the ma
Вот точно такой же чистый и готовый к копированию текст на японском языке: 高度なアルゴリズムソリューションに基づいて開発されたプロフェッショナルなエキスパートアドバイザー(EA)、「Oracle Stone」をご紹介します。 私は開発者であり、現役のトレーダーでもあります。このEAのベースにあるのは、厳密な数学的およびトレードのロジックです。私は非現実的な約束はしません。トレードに「聖杯」は存在せず、100%の利益を保証できるアルゴリズムもありません。しかし、体系的かつ洗練されたアプローチは確かな結果をもたらします。過去のデータを用いた1ヶ月間のテストでは、アルゴリズムが約150%の利益を示した期間もありました。これは厳密なアルゴリズムが実際の市場データ上で機能した結果です。とはいえ、常に適切なリスク管理を怠らないようにしてください。 私の主な目的は、意識の高いトレーダーに本当に役立つ高品質なツールを提供することです。現在の価格は、これまでに費やされたコードと時間、そして経験の価値を反映したものです。私
Spike Alert Pro - Advanced Volatility & Market Spike Detector Stay ahead of sudden market movements with   Spike Alert Pro , a powerful, highly responsive, and meticulously coded indicator designed to detect high-volatility market spikes in real time. Whether you are trading Forex or Gold (XAUUSD), catching rapid price expansions is crucial for successful trading.   Spike Alert Pro   acts as your personal market monitor, ensuring you never miss a critical trading opportunity by delivering instan
MQL5 Market Listing: Bollinger Pro Bollinger Pro   is an advanced signal-based indicator designed to simplify market analysis by identifying high-probability entry points. Unlike standard Bollinger Band indicators that only show volatility channels, Bollinger Pro utilizes a proprietary algorithm to detect market conditions—whether the market is trending or sideways—and prints direct Buy/Sell signals on the chart. The indicator is designed for traders who seek a "clean chart" experience while mai
Gold Zone Pro Headline:   Advanced Adaptive Expert Advisor for XAUUSD and Major Pairs Description: Welcome to   Gold Zone Pro , a sophisticated and highly versatile Expert Advisor designed to navigate the complexities of dynamic markets. Engineered with a highly adaptive algorithm, Gold Zone Pro specializes in identifying and trading within sideways (ranging) market conditions, while simultaneously employing intelligent logic to capture substantial movements during trending phases. While the cor
フィルタ:
レビューなし
レビューに返信