Gold Squeeze Momentum Indicator

# MT5用スクイーズ・モメンタム・インジケーター

MetaTrader 5向けにプロが開発した強力な**スクイーズ・モメンタム・インジケーター**で、爆発的な市場チャンスを掴みましょう。

この高度なボラティリティ・モメンタム・インジケーターは、トレーダーが大きな市場変動が起こる前の低ボラティリティ期間を特定するのに役立ちます。ボリンジャーバンドとケルトナーチャネルの強みを組み合わせたこのインジケーターは、市場が「スクイーズ」状態にあり、ブレイクアウトの準備をしているタイミングを明らかにします。

内蔵のモメンタム・ヒストグラムにより、トレンドの方向とモメンタムの変化を容易に把握でき、トレーダーは自信と精度を持ってトレードを行うことができます。


## 機能

* 高度なスクイーズ検出システム
* プロフェッショナルなMT5実装
* 急激なブレイクアウト前にボラティリティスクイーズを検出
* 動的な色変化を伴うモメンタムヒストグラム
* 市場状況を容易に把握できるスクイーズステータスドット
* 以下の指標を組み合わせ:

* ボリンジャーバンド

* ケルトナーチャネル
* 線形回帰モメンタム
* トレンド転換の早期検出
* クリーンでレスポンスの良い別ウィンドウ表示
* 設定の完全カスタマイズが可能
* 軽量でスムーズなパフォーマンスを実現

## モメンタムヒストグラムの色

* 明るい緑 → 上昇モメンタム
* 暗い緑 → 下降モメンタム
* 明るい赤 → 下降モメンタムの上昇
* 暗い赤 → 下降モメンタムの弱化

## スクイーズドットの色

* 白 → スクイーズON(低ボラティリティ/ブレイクアウト準備)
* 金色 → スクイーズ解除(ブレイクアウトの可能性あり)
* 赤 → なしスクイーズコンディション

## 最適なトレーダー

* ブレイクアウトトレーダー
* スキャルパー
* スイングトレーダー
* モメンタムトレーダー
* ICTおよびスマートマネートレーダー
* ボラティリティトレーダー
* 外国為替、金、仮想通貨、指数、株式

## トレーダーに人気の理由

市場はしばしば低ボラティリティから高ボラティリティへと変動します。このインジケーターは、トレーダーがこうした急激な動きを事前に予測するのに役立ちます。

市場を追いかけるのではなく、トレーダーは早めに準備を整え、モメンタムが拡大する前にポジションを取ることができます。

## 対応プラットフォーム

* MetaTrader 5 (MT5)
* あらゆるブローカー
* あらゆる時間足
* あらゆる取引商品

現代のトレーダーのために開発された、強力なボラティリティブレイクアウトおよびモメンタム分析ツールで、よりスマートなトレードを実現しましょう。


おすすめのプロダクト
FlatOut Movings Robot: フラットを完全制御。トレンドを確実にナビゲート。 移動平均線(ムービング)ベースのインジケーター戦略には、一つの一大悪夢があります。市場がフェーズを変えた瞬間、あなたのデポジットは容赦なく溶け始めます。古典的なムービングはフラット相場で数十回もの偽のクロスシグナルを発生させ、標準的なフィルターは無慈悲に遅延します。あなたは夜な夜なストレスを抱えてターミナルの前に座り込み、値動きのまさに終盤の出尽くした局面でエントリーしてしまうのです。 このソフトウェアは、まさにその具体的な課題を解決するために開発されました。ロボットは絶え間なくチャートをスキャンし、板情報(オーダーブック)のインサイド情報かの如く市場構造を読み解きます。完全に膠着した横ばい相場(ボコウィク)でも、強烈なトレンドの勢い(インパルス)でも、同様に圧倒的な効率で取引を牽引します。システムはまるでメスの如き精度で、真のブレイクアウトと取引レンジ内での偽のダマシ(偽の出入り口)を完璧に切り分けます。 相場混沌の時代を生き抜く時間による証明 このソフトの数学的コアは、次々と押
Quantum Frequency Indicator MT5 Universal Market Frequency Analyzer for MT5 Trade Forex, Crypto, Stocks & Indices With Advanced Frequency-Based Signals Overview The Quantum Frequency Indicator (QFI) MT5 Version is a next-generation analytical tool designed to detect the hidden frequency structures within financial markets. Based on 14 years of research into market vibrations, price cycles and energy flow patterns, QFI provides traders with highly refined Buy and Sell zones across all major
Please feel free to join this Telegram group where users can share their strategies and settings that work for them using this indicator --> t.me/MTFMACS ALSO AVAILABLE ON TRADINGVIEW The MTFMACS family is now available on TradingView for users who prefer charting on that platform. Contact me via the Telegram group for direct access. ————————————————————————————————— BEFORE YOU PURCHASE — PLEASE READ A free version of this indicator is available. Please purchase this paid version only if you
OTC Trend Radar Clean on-chart signals with an entry zone, stop-loss and profit targets, controlled from a compact panel. What you get - Buy and Sell arrows on the M1 and M5 charts - A "Buy Zone" / "Sell Zone" box for each signal - Automatic stop-loss and up to seven profit-target levels, each with its price; the lines follow price until the move ends - Follow-up arrows for additional opportunities in the direction of the trade - Direction tags above the panel showing the current M1 and M5 sta
CISD Levels Pro automatically draws CISD Buy and Sell levels directly on your chart. It highlights pending levels while they are forming, then marks confirmed levels after the confirmation candle closes. Optional confirmation arrows help you spot the signal quickly. This tool is designed for traders who want clean, simple CISD level visualization without extra indicators or clutter. Key Features Draws Bullish (BUY) CISD levels and Bearish (SELL) CISD levels Shows Pending levels (dashed) and
The Plasma Trend indicator is a simple technical indication that is used to determine the current trend direction in the market. The Plasma Trend indicator is a powerful tool for determining the direction of the trend in the Forex market. It is based on both standard technical indicators and proprietary mathematical calculations, which provides a more accurate and reliable trend determination. Its implementation in the form of lines of two colors simplifies the visual determination of a change
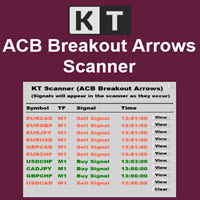
これは当社のインジケーター ACB Breakout Arrows 用に開発されたマルチシンボル・マルチタイムフレームのスキャナーです。デフォルト設定では、 28種類の通貨ペアと9つの時間足 を同時にスキャンして売買シグナルを検出します。  機能 1つのチャートから 252* のシンボルと時間足の組み合わせをスキャン可能です。 ワンクリックでシグナルのチャートを開き、事前に設定されたテンプレートを自動で適用します。  チャート上のどこにでも簡単にドラッグ&ドロップで配置できます。 ポップアップ、音声、プッシュ通知、メールによるリアルタイムアラート機能を搭載しています。  入力パラメーター ACB Breakout Arrows のシグナル感度設定。 スキャンするシンボルを入力してください。  履歴の更新:履歴データが不足または壊れている場合は、再ダウンロードして更新できます。  スキャンする時間足を選択してください。 アラート設定 パネルの色やフォントサイズを調整可能です。 
Manyal trading system, CovEchoTrend Robot, focuses on reliability and flexibility. By employing statistical analysis methods to study the relationships between the base indicator and market patterns, the system enables a deeper understanding of market processes. Intelligent pattern analysis: The application of statistical data processing helps identify key trend reversal points more accurately, signaling significant market shifts. Informed decision-making is based on the intersection of indicato
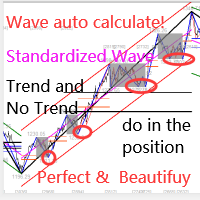
このインジケーターは実践的なトレードに最適な自動波動分析のインジケーターです! 場合... 注:   Tang Lun (Tang Zhong Shuo Zen) の命名規則の影響で、私は波のグレーディングに西洋の名前を使用することに慣れていません。基本的な波を ペン 、二次波のバンドを セグメント と名付けました。同時に、 セグメント にはトレンドの方向が指定されます (この命名方法は将来のノートで使用されます。最初に言っておきます)。ただし、アルゴリズムは曲がりくねった理論とはほとんど関係がないため、付けるべきではありません。これは、私の市場分析 によって要約された、絶えず変化する複雑な運用ルール を反映しています。 バンドは標準化され、人によって異なることがないよう定義されており、市場参入を厳密に分析する上で重要な役割を果たす人為的な干渉の描画方法が排除されています。 このインジケーターを使用することは、取引インターフェイスの美しさを改善することと同等であり、元の K ライン取引を放棄し、取引の新しいレベルに連れて行きます。また、宣伝の観点から顧客の認識も向上します。 イ
Relative Volume (RVOL) Indicator See When Volume Really Matters Not all volume is equal. The Relative Volume (RVOL) Indicator helps you quickly identify when the market is experiencing unusually high trading activity compared with its recent average. Instead of simply showing how much volume is trading, RVOL puts current volume into context—making it easier to spot moments when buyers or sellers may be becoming more active. Key Features Identify High-Volume Bullish Moves Quickly spot candles
Avez-vous toujours rêvé de pouvoir entrer sur le marché juste après la clôture d'une bougie… et de voir le marché évoluer immédiatement dans votre sens ? Avez-vous toujours souhaité détecter les retournements de tendance plus tôt, éviter les faux signaux et, surtout, saisir les tendances longues avant la majorité des traders ? Aujourd'hui, je vais vous présenter mon nouvel indicateur : Prophète du retournement intelligent. Contrairement aux indicateurs traditionnels qui réagissent avec un certa
️ **This document and indicator do not constitute investment advice. Past performance is no guarantee of future results.** 1. Product Introduction **ATR Fibonacci Trend Envelopes** combines three proven concepts into a single tool: * **Volatility-sensitive trend engine** — Dynamic bands that expand and contract with the ATR around a selectable moving average baseline (SMA/EMA/WMA/HMA/RMA). If the price breaks above the upper band on a candle close, a **BULL** regime begins; if it breaks bel
FXLAND Smart Reversal Indicator (MT5) FXLAND Smart Reversal Indicator is a professional technical analysis tool designed to help traders identify potential price reversal zones and key market turning points with clarity and precision. The best reversal indicator and price return by choosing only one ceiling or floor in each time frame A masterpiece of combining mathematics and Gann, fractal matrix, Fibonacci, movement angle and time. Completely intelligent Key Features Detects potenti
LazyTrader Market Intelligence Multi-Market Trend & Level Analysis See the Bigger Picture. Understand the Market Context. Discover a more structured approach to chart analysis with LazyTrader Market Intelligence — a visual trading indicator designed to bring trend direction, technical conditions, key price levels, market structure and economic-calendar information together in one organized dashboard. Built for traders who want a broader view of market conditions, LazyTrader Market Intelligence h
Xtrade Trend Detector is an indicator capable of finding the best opportunities to take a position in any stock market. Indeed, it is a great tool for scalpers but also for Daytraders. You could therefore use it to identify areas to trade, it fits easily on a chart. I use it to detect trends on Big timeframes and take positions on Small timeframes. Don't hesitate to give me a feedback if you test it.
RubdFx Perfect Reversal , The reversal indicator is used to determine areas of support and resistance by Drawing an arrow with a level of supply and demand ( ReversalZones ). - You will catch more swings by reducing the period, and less swings if you increase period - Mobile, computer and email alerts available . it is not pushed by price which means the arrow will stay in one place,suitable for scalping and long term trading  Also Compatible with all forex paris , BUY RULES;  open a buy positio
The indicator scans for TD Combo signals in multiple timeframes for the all markets filtered and shows the results on Dashboard. Key Features Dashboard can be used for all markets It can scan for signals on MN1, W1, D1, H4, H1, M30, M15 ,M5, M1 timeframes Parameters UseMarketWatch: Set true to copy all symbols available in market watch MarketWatchCount : Set the number of symbols that you want to copy from the market watch list. CustomSymbols: Enter the custom symbols that you want to be availa
Gann Made Easy   は、ミスター・ギャンの理論を使用した取引の最良の原則に基づいた、プロフェッショナルで使いやすい外国為替取引システムです。 W・D・ガン。このインジケーターは、ストップロスとテイクプロフィットレベルを含む正確な買いと売りのシグナルを提供します。 PUSH通知を利用して外出先でも取引可能です。 ご購入後、取引方法の説明と優れた追加インジケーターを無料で入手するには、私にご連絡ください! おそらく、ギャンの取引手法についてはすでに何度も聞いたことがあるでしょう。通常、ギャンの理論は初心者のトレーダーだけでなく、すでにある程度の取引経験がある人にとっても非常に複雑なものです。なぜなら、ギャンの取引手法は理論的にはそれほど簡単に適用できるものではないからです。私はその知識を磨き、最良の原則を私の外国為替インジケーターに組み込むために数年を費やしました。 このインジケーターは非常に簡単に適用できます。必要なのは、それをチャートに添付し、簡単な取引推奨事項に従うだけです。このインジケーターは常に市場分析の仕事を行い、取引の機会を探します。適切なエントリーポイントを検
BTMM State Engine Pro by G-Labs — Beat The Market Maker indicator for MetaTrader 5. Asian session range, London and New York kill zones, level progression (L1/L2/L3), peak formation detection (PFH/PFL), entry signals, and a multi-pair scanner from one chart. Stop scanning charts one pair at a time. The State Engine tracks the BTMM daily cycle automatically — Asian box, room boundaries, level blocks, peak formations, and filtered entries — while the scanner dashboard shows level, peak status, d
DuhokTrend
Ismael Nayif Ismael Ismael
How to Add a Product Description (MetaTrader Market) To add the product description effectively in MetaTrader's Market, follow these steps: 1. Log into the MetaTrader Market: Go to your MQL5 account . Navigate to the "Seller's Dashboard" or "Products" section. Select your product, DuhokTrend . 2. Writing the Description: To enhance the product's rating, write a detailed and structured description : Template for Product Description: DuhokTrend - Advanced Indicator for Trend Analysis Overview:
MTF Parabolic SAR Maximize your trading efficiency with the Multi-Timeframe Parabolic SAR Trend and Momentum Dashboard. Designed for serious traders who value clarity over clutter, this tool aggregates price action across six timeframes into a single, sleek visual interface.  By combining that reliable classic Parabolic SAR logic with advanced momentum scoring and risk assessment, this indicator transforms raw data into actionable trade signals.  The Strategic Edge: Why This Indicator? Most tra
. . is designed for traders who want a clean and practical way to identify bullish and bearish trend changes directly on the MT5 chart. The indicator uses a dual high/low smoothing engine to detect market direction and show a clear active trend line. When the market confirms a bullish or bearish flip
AURUM MID-QUANT PRO v5.60 Quantitative Excellence for Gold (XAU/USD) & Volatility Trading Gain a professional edge over institutional markets with AURUM MID-QUANT PRO , an advanced Price Action Pattern Detection and Breakout Engine designed exclusively for MetaTrader 5 . Built specifically to capture the unique volatility of Gold (XAU/USD) and other major financial instruments, this powerful indicator combines high-precision algorithmic pattern recognition with real-time dynamic accumulation z
TrendMorph — エントリー矢印付きの適応型トレンドインジケーター 概要 TrendMorph は色付きのラインでトレンドの方向を示し、転換点を Buy/Sell の矢印で表示し、各シグナルに信頼度スコアと Stop/Target レベルを提供します。現在の相場状態に合わせてラインの感度を自動で調整できるため、同じ設定で落ち着いた相場でも変動の大きい相場でも使えます。チャート上には情報パネルが表示され、重要な値はすべて EA 用のバッファから取得できます。 MT4-version:  https://www.mql5.com/en/market/product/202707 仕組み トレンドラインは価格に追従します。青は上昇トレンド、赤は下降トレンドです。 トレンドが転換し、シグナルが各フィルター(RSI、出来高、レベルの質、シグナル間隔)を通過すると矢印が表示されます。矢印はバーの確定後に描画され、その後は移動も消去もされません。 Auto-Tune を有効にすると、ラインの感度(Band Width と Smoothing Period)が相場に合わせて適応します。 各
FREE
Yawabeh SD Pro –  Professional Supply and Demand Indicator Trade Smarter with Volume-Confirmed Supply/Demand Zones Our institutional-grade algorithm identifies high-probability reversal zones before price reacts, giving you the edge in Forex, Crypto, and Stocks. Key Features Multi-Timeframe Confirmation – View trend strength across multiple timeframes simultaneously – Align your trades with higher timeframe momentum Smart Alert System – Real-time notifications for: – Strong demand/supply zone
ICT TWENTY TWO MODEL Unlock institutional-grade price action trading with our precision MetaTrader 5 port of the renowned ICT Model 2022 framework . Whether you are trading major Forex pairs or high-volatility Synthetic Crash Indices that spike, this algorithm automates complex concepts so you can catch high-probability entries effortlessly. Core Features & AdvantagesNon-Repaint Guarantee: Structure and signals are strictly confirmed on closed bars only, ensuring your historical backtests and li
Man Trend uses at its core the process of identifying the rate of change in price growth and allows you to find entry and exit points from the market. The indicator was created on the basis of the original indicators for searching for extreme points, the indicator is well suited for determining a reversal or a large sharp jerk to one of the sides, thanks to it you will know when this happens, it will notify you with the appearance of a blue dot to buy red to sell. This is a fundamental techni
A professional MT5 trading panel designed for decision support, risk management, and trade planning — not automated execution. Helps traders plan entries, manage positions, and control risk with clarity and consistency. Overview Real-time trading decision panel that analyzes trend, momentum, and market quality directly on the chart. It provides ATR-based TP/SL levels and clear buy/sell conditions to support faster and more consistent trading decisions. This is a decision support tool only —
G2 Entry Signal
Ida Bagus Putu Mahardika
G2 ENTRY SIGNAL by Ida Bagus Putu Mahardika STRATEGY DESCRIPTION G2 Entry Signal is a professional multi-strategy entry dashboard that combines top-down analysis with 3 proven trading strategies in one powerful indicator. Designed for traders who demand clarity, accuracy, and actionable signals, this tool filters market noise and delivers high-probability entry opportunities directly on your chart. KEY ADVANTAGES 1. 3 STRATEGIES IN ONE DASHBOARD Strategy 1 – London Session Breakout:   Capt
FREE
このプロダクトを購入した人は以下も購入しています
Boba Analysis Suite
Trade Ready Solutions LLC
5 (1)
Boba Analysis Suite Boba Analysis Suite は、MetaTrader 5 向けの分析インジケーターです。市場構造、重要な価格帯、相場全体の状況を、一つのチャート画面にまとめて表示します。 トレーダーおよびトレーディング指導者としての実務経験をもとに開発され、市場の方向性の評価、重要な価格水準の特定、複数の時間足を組み合わせた分析など、体系的な分析プロセスを支援します。 相場の背景を踏まえた分析 個々のシグナルの意味は、相場の状況によって変わります。Boba Analysis Suite は、現在のチャート状況をより大きな市場構造と関連付け、あらかじめ定めたルールに沿って取引アイデアを検討するための分析を支援します。 主な分析機能: トレンドと市場構造: 市場の方向性と、その背景にある構造を評価します。 重要な価格帯と価格水準: さらに分析すべき重要な領域を視覚的に表示します。 複数の時間足: 異なる時間足の情報を組み合わせ、相場全体の状況を評価します。 視覚的な分析プロセス: 分析情報をチャート上で直接確認できます。 自主的な取引判断を支援 Boba
ARIPoint
Temirlan Kdyrkhan
1 (4)
ARIPoint is a powerful trading companion designed to generate high-probability entry signals with dynamic TP/SL/DP levels based on volatility. Built-in performance tracking shows win/loss stats, PP1/PP2 hits, and success rates all updated live. Key Features: Buy/Sell signals with adaptive volatility bands Real-time TP/SL/DP levels based on ATR Built-in MA Filter with optional ATR/StdDev volatility Performance stats panel (Success, Profit/Loss, PP1/PP2) Alerts via popup, sound, push, or email Cu
AriFocus - Non-Repainting Buy/Sell Signals AriFocus - one clear signal. AriFocus marks buy and sell signals directly on the chart and suggests a stop-loss level for each one. Every signal is confirmed on bar close and never repaints. - Buy/sell arrows, confirmed on bar close - Suggested stop-loss level for every signal - Trend band and candle coloring to show direction at a glance - 10 ready-made presets, or your own settings (14 calculation methods) - Pop-up, push and email alerts with entr
ARICoin is a powerful trading companion designed to generate high-probability entry signals with dynamic TP/SL/DP levels based on volatility. Built-in performance tracking shows win/loss stats, PP1/PP2 hits, and success rates all updated live. Key Features: Buy/Sell signals with adaptive volatility bands Real-time TP/SL/DP levels based on ATR Built-in MA Filter with optional ATR/StdDev volatility Performance stats panel (Success, Profit/Loss, PP1/PP2) Alerts via popup, sound, push, or email Cust
MERAVITH SCANNERは、MetaTrader 5用のプロフェッショナルな金融市場インジケーターで、複数の分析ツールを一つの統合システムにまとめています。独自の出来高加重平均価格(VWAP)手法を使用してすべての計算を自動で行い、主観的な解釈を完全に排除します。 このインジケーターは、すべての資産クラス(FX、株式、指数、商品、暗号通貨)およびM1から月足までのすべての時間軸で動作します。基本原理は「価格は出来高に従う」というものです。MERAVITHは機関投資家の出来高が集中するポイントを特定し、その集中から数学的に正確な価格レベルを導き出します。予測や投機は行わず、計算のみを行います。 MERAVITH SCANNERを使用すると、28の主要FX通貨ペアをすべての時間軸でわずか2~3分でスキャンできます。また、任意の市場をスキャンすることも可能です。例えば、約100銘柄の株式を約10分でスキャンできます。 インジケーターは、消耗レベル、均衡線、偏差、統計レベル、およびターゲット予測を算出します。 チャート要素 Origin Point :すべての計算が始まる起点です。イン
note: this indicator is for METATRADER4, if you want the version for METATRADER5 this is the link:  https://www.mql5.com/it/market/product/108106 TRENDMAESTRO ver 2.5 TRENDMAESTRO recognizes a new TREND from the start, he never makes mistakes. The certainty of identifying a new TREND is priceless. DESCRIPTION TRENDMAESTRO identifies a new TREND in the bud, this indicator examines the volatility, volumes and momentum to identify the moment in which there is an explosion of one or more of these da
AriX
Temirlan Kdyrkhan
1 (4)
AriX Indicator for MT5 A powerful trend-following and signal-evaluation tool AriX is a custom MT5 indicator that combines Moving Averages and ATR-based risk/reward logic to generate clear buy/sell signals. It visualizes dynamic SL/TP levels, evaluates past trade outcomes, and displays win/loss statistics in a clean on-chart panel. Key features include: Buy/Sell signals based on MA crossovers ATR-based SL/TP1/TP2/TP3 levels with visual lines and labels Signal outcome tracking with real-time stat
相場が本当は何をしているのかを見抜く。   3つの市場フェーズ(収縮・拡張・トレンド)を目の前でライブに捉え、トレンド・フェーズの初期段階でより優れたエントリーを取りましょう   。      当て推量はもう終わり。機関投資家やスマートマネーのように相場を読み始めましょう。   Apex Market Structure Pro(MT5版)は、ノイズを取り除き、あらゆるローソク足の下にある真の構造を見せる高精度のスマートマネー分析ツ   ールです。流動性、構造転換、蓄積ゾーン、トレンドバイアスを、ひとつのクリーンでプロフェッショナルなオーバーレイに集約します。遅行   指標に見切りをつけ、明晰さをもってトレードする準備のできた本気のトレーダーのために作られました。   重要:本インジケーターは Heikin Ashi(平均足)ローソク足での動作を前提に設計されています。使用前にチャートを Heikin Ashi   に設定し、その真価を解き放ってください。分析のすべては Heikin Ashi の価格の流れを軸に構築されています。Apex Market Structure Pr
Title:FX-AIEA Supply and Demand Zone Indicator (MT5) — Technical Overview Version: 2.51 | Platform: MetaTrader 5 Introduction Supply and demand zones are considered a core manifestation of institutional order flow, providing a more direct reflection of buying and selling pressure than traditional support/resistance levels. This indicator attempts to automate the identification of high-probability supply and demand zones using an adaptive ZigZag algorithm, reducing the subjectivity and time asso
ORB Seeker MT5
Marcela Goncalves De Oliveira
数量限定で特別価格!希少性を維持するための特別価格です! たったの599ドル! ご購入後、ボーナスとしてORB Seeker EAと個人最適化セットファイルをお受け取りいただくため、私にご連絡ください。 クリーンなセッションブレイクアウトを自信を持ってキャッチしましょう! ORB Seeker MT5は、正確性、シンプルさ、柔軟性、そして明確なチャート構造を求めるトレーダー向けに開発された、プロ仕様のオープニングレンジブレイクアウト(ORB)インジケーターです。 このシステムは、あらゆる銘柄のプレマーケットまたはカスタムセッションのレンジを自動的にプロットし、エントリー、ストップロス、テイクプロフィット、およびオプションの50%部分TPレベルを含む明確なブレイクアウトシグナルを提供します。すべての計算結果はリアルタイムでチャート上に表示されます。 ロンドンオープン、ニューヨークセッション、アジアセッション、または独自のカスタム市場時間帯で取引できます。ORB Seeker MT5は選択したセッション時間帯に合わせて調整されるため、市場レンジ、ブレイクアウトレベル、トレードレベルの位
Volume Arrow Signal Product Description Volume Arrow Signal is a smart trading indicator designed to help traders identify potential buy and sell opportunities using price action, volume behavior, and directional arrow signals. The indicator places clear arrows directly on the chart, making it easy to spot possible market reversals, trend continuations, and entry opportunities without spending hours analyzing charts manually. Whether you are trading Gold (XAUUSD) , Forex pairs, Indices, or Crypt
KenKem Master Volume Profiler - Brief Introduction A Display-only volume-profile cockpit for XAUUSD, BTCUSD and other liquid symbols. Draws profile structure, multi-timeframe flow, EMA trend and study-only setup markers. Places no orders. Not a signal service.  It maps where the market has actually traded and reads recent order flow, so you can see structure and lean at a glance.  What it shows: Master and local volume profiles (POC and value-area high/low) - the price shelves that matter. A liv
VTrende Pro
Andrii Diachenko
5 (1)
VTrende Pro - MTF indicator for trend trading with a display panel for MT5 *** Videos can be translated into any language using subtitles (video language - Russian) Although the signals of the VTrende Pro indicator can be used as signals of a full-fledged trading system, it is recommended to use them in conjunction with the Bill Williams TS. VTrende Pro is an extended version of the VTrende indicator. Difference between Pro version and VTrende: - Time zones - Signal V - signal 1-2 waves -    S
一言でいうと このインジケーターは RSI と MACD という2人の専門家を1つにまとめたもの です。2つのチャートを別々に見て判断する代わりに、両方が同意したときだけ「買い」または「売り」の矢印を表示します。 矢印は再描画されません 。一度出現すれば、そのまま固定されます。 「コンボ」の意味 通常、トレーダーは RSI(値動きの勢い)と MACD(トレンドの方向)を別々に見ます。しかし両者が矛盾することも多いです。 このインジケーターでは、 両方が同時に同意したときのみシグナル を出します。これにより、多くの偽シグナルが排除されます。 画面で見えるもの 価格チャートとは別のインジケーターウィンドウ 青と赤の矢印 —— そのまま使えるシグナル 拡大表示された MACD ヒストグラム(見やすく強調されている) RSI と MACD のラインも表示されるが、注目すべきは矢印 こんな人におすすめ 初心者 —— 2つのインジケーターを別々に解釈し、矛盾に対処する必要がない 経験者 —— シグナルの高速フィルタリングと、再描画しないクリアなロジック 迷いたくない人 —— 「買い」「売り」「待て
MasterTrend Indicator for MT5 A powerful trend-following and signal-evaluation tool MasterTrend   is a custom MT5 indicator that combines Moving Averages and ATR-based risk/reward logic to generate clear buy/sell signals. It visualizes dynamic SL/TP levels, evaluates past trade outcomes, and displays win/loss statistics in a clean on-chart panel. Key features include: Buy/Sell signals based on MA crossovers ATR-based SL/TP1/TP2/TP3 levels with visual lines and labels Signal outcome tracking wit
SMC Sweep Fvg MT5 — スマートマネーと同じ目線で、チャート上に市場を映す こんな経験はありませんか。価格がストップを巻き取り、反転し、まさに想定どおりの方向へ進む。方向は正しかった。間違えたのはエントリーだけです。 このインジケーターは、そうした場面を減らすために作られています。分析で最も重い部分——チャートのマークアップ——を引き受け、本当に重要な「判断」をあなたに残します。 チャートに表示されるもの マーケットストラクチャー — 実際の構造的高値・安値に HH / HL / LH / LL ラベルとレベルライン。トレンドが一目で分かり、推測は不要です。 インバランスゾーン(FVG) — 価格が急ぎ過ぎて通過し、後で戻りやすい領域。未埋めと既埋めのゾーンは別色で表示されます。 流動性の動き — 反転前に市場がレベルを巻き取る瞬間を追跡します。 トレード設計の完成形 — エントリー矢印、ストップロス、利益目標。すべて描画済みで、頭の中で計算する必要はありません。 トレンドフィルター — 上位足のラインで、主戦場の動きの側に立ち続けられます。 インジケーターは
PrimeScalping is a powerful trading companion designed to generate high-probability entry signals with dynamic TP/SL/DP levels based on volatility. Built-in performance tracking shows win/loss stats, PP1/PP2 hits, and success rates — all updated live. Key Features: Buy/Sell signals with adaptive volatility bands Real-time TP/SL/DP levels based on ATR Built-in MA Filter with optional ATR/StdDev volatility Performance stats panel (Success, Profit/Loss, PP1/PP2) Alerts via popup, sound, push, or e
The Expert Advisor and the video are attached in the Discussion tab . The robot applies only one order and strictly follows the signals to evaluate the indicator efficiency. Pan PrizMA CD Phase is an option based on the Pan PrizMA indicator. Details (in Russian). Averaging by a quadric-quartic polynomial increases the smoothness of lines, adds momentum and rhythm. Extrapolation by the sinusoid function near a constant allows adjusting the delay or lead of signals. The value of the phase - wave s
Классификатор силы тренда. Показания на истории не меняет. Изменяется классификация только незакрытого бара. По идее подобен полной системе ASCTrend, сигнальный модуль которой, точнее его аппроксимация в несколько "урезанном" виде, есть в свободном доступе, а также в терминале как сигнальный индикатор SilverTrend . Точной копией системы ASCTrend не является. Работает на всех инструментах и всех временных диапазонах. Индикатор использует несколько некоррелируемых между собой алгоритмов для класси
FFx Universal Strength Meter PRO is more than a basic strength meter. Instead of limiting the calculation to price, it can be based on any of the 19 integrated strength modes + 9 timeframes. With the FFx USM, you are able to define any period for any combination of timeframes. For example, you can set the dashboard for the last 10 candles for M15-H1-H4… Full flexibility! Very easy to interpret... It gives a great idea about which currency is weak and which is strong, so you can find the best pai
The FFx Universal MTF alerter shows on a single chart all the timeframes (M1 to Monthly) with their own status for the chosen indicator. 9 indicators mode (MACD-RSI-Stochastic-MA-ADX-Ichimoku-Candles-CCI-PSAR). Each can be applied multiple times on the same chart with different settings. Very easy to interpret. Confirm your BUY entries when most of the timeframes are showing green color. And confirm your SELL entries when most of the timeframes are showing red color. 2 Alert Options : input to s
The FFx Watcher PRO is a dashboard displaying on a single chart the current direction of up to 15 standard indicators and up to 21 timeframes. It has 2 different modes: Watcher mode: Multi Indicators User is able to select up to 15 indicators to be displayed User is able to select up to 21 timeframes to be displayed Watcher mode: Multi Pairs User is able to select any number of pairs/symbols User is able to select up to 21 timeframes to be displayed This mode uses one of the standard indicators
FFx Patterns Alerter gives trade suggestions with Entry, Target 1, Target 2 and StopLoss .... for any of the selected patterns (PinBar, Engulfing, InsideBar, OutsideBar) Below are the different options available: Multiple instances can be applied on the same chart to monitor different patterns Entry suggestion - pips to be added over the break for the entry 3 different options to calculate the SL - by pips, by ATR multiplier or at the pattern High/Low 3 different options to calculate the 2 TPs -
MetaTrader 4 version available here : https://www.mql5.com/en/market/product/24881 FFx Basket Scanner is a global tool scanning all pairs and all timeframes over up to five indicators among the 16 available. You will clearly see which currencies to avoid trading and which ones to focus on. Once a currency goes into an extreme zone (e.g. 20/80%), you can trade the whole basket with great confidence. Another way to use it is to look at two currencies (weak vs strong) to find the best single pairs
MetaTrader 4 version available here: https://www.mql5.com/en/market/product/25793 FFx Pivot SR Suite PRO is a complete suite for support and resistance levels. Support and Resistance are the most used levels in all kinds of trading. Can be used to find reversal trend, to set targets and stop, etc. The indicator is fully flexible directly from the chart 4 periods to choose for the calculation: 4Hours, Daily, Weekly and Monthly 4 formulas to choose for the calculation: Classic, Camarilla, Fibonac
ClassicSBA
Umri Azkia Zulkarnaen
this indicator very simple and easy if you understand and agree with setup and rule basic teknical sba you can cek in link : please cek my youtube channel for detail chanel : an for detail info  contact me  basicly setup buy (long) for this indicator is Magenta- blue and green candle or magenta - green  and green candlestik and for setup sell (short) is Black - yellow - and red candle or black - red  and red candlestik
A scalping indicator based on mathematical patterns, which on average gives signals with relatively small SL, and also occasionally helps to catch big moves in the markets (more information in the video) This indicator has three main types of notifications: The first type warns of a possible/upcoming signal on the next bar The second type indicates the presence of a ready signal to enter the market/open a position The third type is for SL and TP levels - you will be notified every time price re
Индикатор Coefficient Of Determination (COD) представляет собой значение коэффициента детерминации или квадрат коэффициента корреляции между зависимой переменной — ценой и объясняющей переменной — тиковым объемом. Что это дает нам на практике? COD отлично распознает кульминацию трендовых движений, что позволяет подбирать оптимальные точки и ловить развороты рынка. Как использовать индикатор: Наиболее популярная торговая стратегия строится совместно с трендовым индикатором Moving Average (MA), пе
Recommended TimeFrame >= H1. 100% Non Repainted at any moment.  Use it carefully, only with Trend Direction. Trading Usage: 2 Variants: as Range System or as BreakOut System (Both Only With Trend Direction)::: (Always use StopLoss for minimise Risk); [1] as Range System: (Recommended) in UP TREND:  - BUY in Blue Line , then if price goes down by 50 points (on H1) open Second BUY.   Close in any Profit you wish: TrailingStop(45 points) or Close when Price touches upper Gold Line. in DOWN TREND
this indicator is a Spike detector indicator, it is specially designed to trade Boom 1000, Boom 500, Crash 1000 and Crash 500 We recommend using it on Deriv Boom and Crash indices only Its setting is intuitive, familiar, easy to use it has notification functions; audible notifications and push notifications. this tool is simple to use, easy to handle This update is based on different strategies for spikes
作者のその他のプロダクト
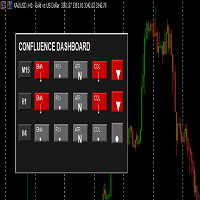
概要 このMT5インジケーターは、3つの時間枠(M15、H1、H4)にわたる4つの主要テクニカル指標を同時に分析し、合流分析によって高確率の取引機会を特定するプロフェッショナルな取引ダッシュボードを作成します。 1. EMA(指数移動平均)トレンド分析 2. RSI(相対力指数)モメンタム分析 3. ATR(平均真範囲)ボラティリティ分析 4. CDL(ローソク足パターン分析) モバイルフレンドリー設計 コアコンセプト: 合流取引 合流とは、異なる時間枠の複数のテクニカル指標が同じ方向性を示唆する形で一致した時に発生します。これにより、単一の指標または単一の時間枠の分析と比較して、取引の可能性が大幅に高まります。 強い強気の合流点の例: M15:EMA↑、RSI↑、高ボラティリティ、強気のローソク足=強気バイアス H1:EMA↑、RSI↑、標準ボラティリティ、中立のローソク足=強気バイアス H4:EMA↑、RSI↑、低ボラティリティ、弱気のローソク足=中立バイアス 結果:2/3の時間枠で強気=高確率ロングポジション 分析対象テクニカル指標 1. EMA(指数移動平均線)トレンド
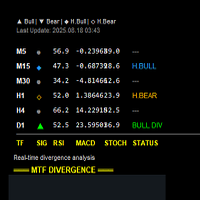
マルチダイバージェンスMTFインジケーター (MT5) 強力な反転を事前に特定 マルチダイバージェンスMTFは、複数の時間枠での確認とリアルタイムアラートを求めるプロのトレーダー向けに設計された、高度なダイバージェンス検出ツールです。 1つのオシレーターのみで動作する標準的なダイバージェンスインジケーターとは異なり、このツールはRSI、MACD、ストキャスティクスを同時にスキャンし、最大6つのより長い時間枠でシグナルを確認します。その結果、スキャルピング、デイトレード、スイングトレードにおいて、より強力で、より明確で、より信頼性の高いダイバージェンス設定が可能になります。 主な機能 マルチ時間枠での確認 最大6つのより長い時間枠(M5/M15/M30/H1/H4/D1)で動作します。 ノイズを除去し、より大きなトレンドに沿ったダイバージェンスのみを取引します。 通常のダイバージェンスと隠れたダイバージェンス 通常のダイバージェンス → トレンドの反転を予測します。 隠れたダイバージェンス → トレンドの継続を予測します。 チャート上に明確な矢印で表示されます。
ゴールド マルチタイム マルチダイバージェンス EA (7ヶ月で200米ドルから1000米ドルへ) ゴールド マルチタイム マルチダイバージェンス EAは、MT5向けのプロフェッショナルグレードの取引システムで、高確率の反転とトレンド継続を正確に捉えるために構築されています。 ゴールド(XAUUSD)に最適化されていますが、FX、指数、仮想通貨にもシームレスに連携します。 戦略概要 このEAは、複数の時間枠におけるプライスアクションとRSIおよびMACDのダイバージェンスを組み合わせ、市場の転換点を早期に検知します。両方の指標がダイバージェンスを示唆すると、EAは規律あるリスク管理アプローチに基づき、自動的に取引を開始します。 主な機能 マルチ時間枠ダイバージェンスエンジン – 5分足、15分足、30分足、1時間足、4時間足、1日足のダイバージェンスを同時にスキャンします。 デュアルインジケーター確認 – RSIとMACDの乖離が一致した場合にのみエントリーします。 ゴールド(XAUUSD)に最適化 – ゴールドのボラティリティの高い利益確定の動きを捉
週足・日足OHLCレベル ― 重要な価格帯を見逃すことはもうありません 市場の​​反応を推測する必要はもうありません。このインジケーターは、機関投資家、銀行、そしてスマートマネーが毎日注目する最も重要な価格帯を、チャート上に自動的に表示します。手動操作は一切不要です。 機能 チャートを開くたびに、以下の情報がすぐに表示されます。 4つの週足レベル ― 前週の始値、終値、高値、安値 4つの日足レベル ― 前日の始値、終値、高値、安値 色分けによる分かりやすさ ― 週足は青、日足は白で表示されるため、常に何を見ているのかが一目でわかります。 明確な価格ラベル ― 各レベルには、チャート上に正確な価格が表示されます。 これらのレベルが重要な理由 前週と前日のOHLCレベルは、プロのトレーダーが最も注目する価格帯の一つです。銀行や機関投資家は、これらのレベル付近で注文を出します。価格は頻繁に以下のパターンを示します。 前週/前日の高値と安値で反転する 前日の始値と終値付近で横ばいになる これらの水準を突破し、再びテストしてから上昇を続ける FX、金、指数、仮想通貨など、どの市場を取
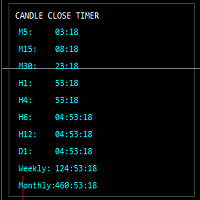
# MT5用マルチタイムフレーム・ローソク足終値タイマー **マルチタイムフレーム・ローソク足終値タイマー**で市場の一歩先を行きましょう。ローソク足のタイミングと正確なエントリーを重視するトレーダーのために設計された、洗練された強力なMetaTrader 5インジケーターです。 このインジケーターは、複数のタイムフレームのリアルタイムカウントダウンタイマーを同時に表示し、チャートを切り替えることなく各ローソク足の終値を正確に追跡できます。 ## 機能 * ローソク足の終値カウントダウンをリアルタイムで表示 * 複数の時間足に対応: * M5 * M15 * M30 * H1 * H4 * H6 * H12 * 日足 * 週足 * 月足 * シンプルで軽量なチャート表示 * 色分けされた警告システム: * 通常カウントダウン * 警告モード * 重要な最終秒 * ローソク足の終値前にプッシュ通知とポップアップアラートを表示 * 完全カスタマイズ可能: * 色 * フォント * パネルの位置 * アラートのタイミング * CPU使用率を低く抑えるよう最
MT5用ボラティリティメーター ― 高度なリアルタイム市場ボラティリティダッシュボード MetaTrader 5向けに、生のATRデータを強力なビジュアルボラティリティ分析システムに変換します。 MT5用ボラティリティメーターは、取引開始前に市場の静穏、活発、高リスク、そして急激な変動といった状況を瞬時に把握したいトレーダーのために設計された、プロ仕様のボラティリティ分析インジケーターです。 高度なATR比較ロジック、過去のボラティリティ分析、そしてインテリジェントなアラートシステムを搭載したこのツールは、トレーダーにチャート上で市場の動向をリアルタイムで表示します。 主な機能 リアルタイムボラティリティダッシュボード 洗練されたモダンなチャートパネルには、以下の情報が表示されます。 現在のATRボラティリティ 長期ベースラインATR ボラティリティ比率比較 過去の最大ATR リアルタイム市場状況 すべての情報はリアルタイムで自動的に更新されます。 スマートなボラティリティ検出 このインジケーターは、短期ATRと長期ATRの平均値を比較し、以下の状態を検出します。
MT5用Standard Deviation Channel 4x MetaTrader 5用Standard Deviation Channel 4xで、チャートをプロの機関投資家向けトレーディングワークスペースへと変革しましょう。 この高度なインジケーターは、ダイナミック回帰チャネル、マルチレベルボラティリティゾーン、カスタマイズ可能な移動平均線、そして強力な上位時間足のサポート/レジスタンスレベルを、すべて1つの洗練されたカスタマイズ可能なツールに統合しています。 トレンドの方向性、ボラティリティの拡大、プレミアム/ディスカウントゾーン、そして高確率の反転エリアを正確に特定したいトレーダーに最適です。 主な機能 高度な標準偏差チャネル スマートな線形回帰トレンドチャネルを自動的にプロット 価格の上下最大4段階の偏差レベルを設定 ボラティリティの拡大と過熱した市場状況を検出 将来予測のためのチャネルの左右拡張オプション リアルタイムのトレンド傾斜分析 マルチレベルボラティリティゾーン +1 / -1偏差 +2 / -2偏差 +3 / -3偏差 +4 / -4偏差 以下の項
フィルタ:
レビューなし
レビューに返信