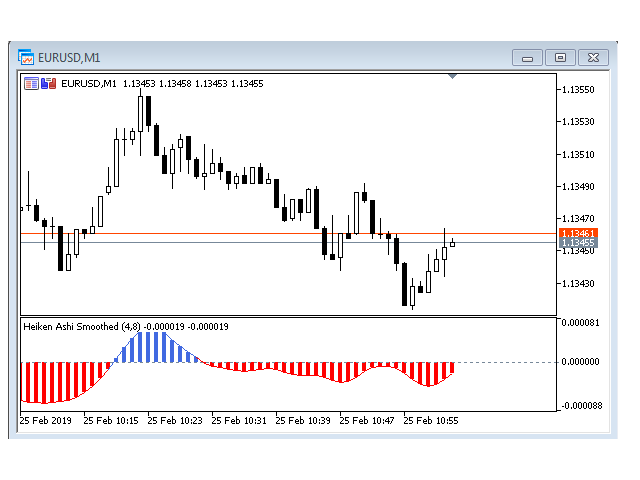
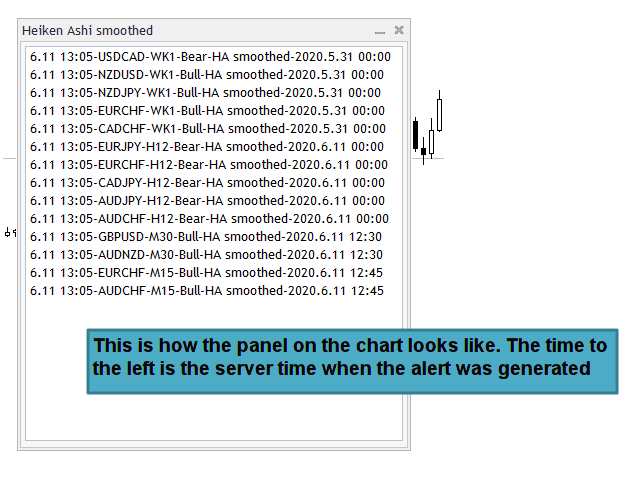
Heiken Ashi Smoothed Scanner MT5

5
レビュー 2
tunck
1239
tunck 2023.07.27 22:31 
 

One of the best and cheapest on the market!

おすすめのプロダクト
Improved version of the free HMA Trend indicator (for MetaTrader 4) with statistical analysis. HMA Trend is a trend indicator based on the Hull Moving Average (HMA) with two periods. HMA with a slow period identifies the trend, while HMA with a fast period determines the short-term movements and signals in the trend direction. The main differences from the free version: Ability to predict the probability of a trend reversal using analysis of history data. Plotting statistical charts for analyzi
DAILY OH/OL SDEV QUANT MODEL - STATISTICAL TRADING WITH PRECISION RISK MANAGEMENT TRADE WITH MATHEMATICAL CERTAINTY - KNOW YOUR EXACT STOP-LOSS AND TAKE-PROFIT BEFORE YOU ENTER This indicator analyzes 5,000+ days of price history to give you: Exact entry levels (sigma bands locked at daily open) Exact stop-loss distance (from M
Heiken Ashi Smoothed Strategy is a very simple but powerful system to get forex market trend direction. This indicator is actually 2 indicators in 1 pack, Heiken Ashi and Heiken Ashi Smoothed Moving Average both included. Because HA (Heiken Ashi) and HAS (Heiken Ashi Smoothed) are calculated in the same one system event with necessary buffers and loop only, so it is the FAST, OPTIMIZED and EFFICIENT HA having the combined indicator of MetaTrader 5. You can choose to display HA and HAS in the sam
Noize Absorption Index - is the manual trading system that measures the difference of pressure between bears forces and bulls forces. Green line - is a noize free index that showing curent situation. Zero value of index shows totally choppy/flat market.Values above zero level shows how powerfull bullish wave is and values below zero measures bearish forces.Up arrow appears on bearish market when it's ready to reverse, dn arrow appears on weak bullish market, as a result of reverse expectation.
This indicator is the same as the popular Heiken Ashi Smoothed. The Heikin Ashi indicator for MetaTrader 5 already exists, but it has two disadvantages: It paints the candles not accurate. It's not possible to change the candle width. See also Heikin Ashi in MQL5 Code Base . In this version there are no such disadvantages.
TRI Visualizer Enhanced - 熱力学的市場分析の革命 概要 TRI(Thermal Range Indicator)Visualizer Enhanced は、従来のテクニカル分析を超越した、物理学の熱力学理論を応用した革新的なマーケット分析インジケーターです。市場の価格変動を「熱力学的エネルギー」として捉え、これまで見落とされていた市場の微細な変化を高精度で検出します。 革新的な仕組み 1. デュアル計算エンジン クラシックTRIモード 基本公式: |終値-始値| + (高値-安値) ローソク足の実体とヒゲを統合した純粋なボラティリティ測定 シンプルで直感的、あらゆる市場環境で安定動作 熱力学的TRIモード(独自開発) 価格加速度 :2次微分による価格変化の勢いを測定 出来高変化率 :相対的な出来高の変化を動的に評価 ポジションエネルギー :正規化された価格変動エネルギーを計算 熱力学的係数 :物理学の熱力学法則を市場分析に応用 2. 高度な平滑化システム SMA(単純移動平均) :基本的なノイズ除去 EMA(指数移動平均) :最新データ重視の平滑化
Was: $249  Now: $99   Market Profile defines a number of day types that can help the trader to determine market behaviour. A key feature is the Value Area, representing the range of price action where 70% of trading took place. Understanding the Value Area can give traders valuable insight into market direction and establish the higher odds trade. It is an excellent addition to any system you may be using. Inspired by Jim Dalton’s book “Mind Over Markets”, this indicator is designed to suit the
Max Min Delta Indicator - Market Volume Imbalance Analysis Gain Deeper Insights into Market Volume Imbalance with Delta Analysis What is the Max Min Delta Indicator? The Max Min Delta Indicator is a powerful market volume analysis tool that visually represents maximum and minimum delta values using a histogram. It helps traders identify market strength, weakness, absorption, and aggressive buying/selling activity with precision. Key Features Histogram Visualization: Displays Max Delta (Green) an
This tool monitors MACD indicators on all time frames in the selected markets. Displays a table with signals to open a BUY trade (green) or SELL trade (red). You can set the conditions for the signal. You can easily add or delete market names / symbols. If the conditions for opening a trade on multiple time frames are met, you can be notified by e-mail or phone message (according to the settings in MT5 menu Tools - Options…) You can also set the conditions for sending notifications. The list of
RBreaker Gold Indicatorsは、金先物の短期日内取引戦略であり、トレンドフォローと日内反転の2つの取引手法を組み合わせたものです。トレンド相場での利益を捉えるだけでなく、相場が反転した際には迅速に利確し、その流れに沿ってポジションを反転させることができます。 この戦略は、アメリカの雑誌『Futures Truth』において、15年連続で最も収益性の高い取引戦略トップ10に選ばれた実績を持ち、非常に長いライフサイクルを誇り、現在も国内外で広く使用・研究されています。 本インディケーターは、2026年の金先物の値動きに対応し、14日間のATR指標に基づいて、ブレイクアウト係数A、観察係数B、リバーサル係数Rをより合理的な値で定義しています。非常に優れたインディケーターであり、安定的な年間収益を実現しています。ぜひおすすめします〜
US30NinjaMT5
Satyaseelan Shankarananda Moodley
US30 Ninja is a 5 minute scalping indicator that will let know you when there is a trade set up (buy or sell). Once the indicator gives the trade direction, you can open a trade and use a 30 pip stop loss and a 30 pip to 50 pip take profit. Please trade at own own risk. This indicator has been created solely for the US30 market and may not yield positive results on any other pair. 
MACD Pro Master
Itumeleng Mohlouwa Kgotso Tladi
MACD Pro Master The MACD Pro Master is your ultimate trading companion, designed to revolutionize your financial journey and unlock the doors to wealth. Here's why it's the next best thing since sliced bread: Advantages Precision Trading : The MACD Pro Master leverages the powerful Moving Average Convergence Divergence (MACD) indicator to provide accurate buy and sell trades,  ensuring you capitalize on every market opportunity. Customizable Settings : Tailor the trading strategy to your unique
PipFinite Trend PRO MT5
Karlo Wilson Vendiola
4.84 (557)
Breakthrough Solution For Trend Trading And Filtering With All Important Features Built Inside One Tool! Trend PRO's smart algorithm detects the trend, filters out market noise and gives entry signals with exit levels. The new features with enhanced rules for statistical calculation improved the overall performance of this indicator. Important Information Revealed Maximize the potential of Trend Pro, please visit www.mql5.com/en/blogs/post/713938 The Powerful Expert Advisor Version Automatin
Be notified of every color change of Heiken Ashi (HA) candles. The indicator will trigger past and new signals every time that HA candles change their colors. ( Note : this tool is based on the code of Heiken Ashi indicator developed by MetaQuotes Software Corp.) Features The signals are triggered at closing of last bar/opening of a new bar; Any kind of alerts can be enabled: Dialog Box, Email message, SMS notifications for smartphones and tablets, and Sound alerts; By default, up arrows are pl
This Volume Delta Profile is an advanced MetaTrader 5 indicator that visualizes   volume delta (order flow imbalance)   using a volume profile-style histogram. It shows the difference between buying and selling pressure at specific price levels, helping traders identify supply and demand zones. This indicator provides a unique perspective on market dynamics by visualizing the imbalance between buying and selling pressure, offering insights beyond traditional volume analysis. Core Concept Positiv
**   All Symbols   x   All Timeframes   scan just by pressing scanner button ** Discount: The price is $50$, But now it is just $39, Limited time offer is active. *** Contact me  to send you instruction and add you in "Trend Reversal group" for sharing or seeing experiences with other users. Introduction: Trendlines are the most famous technical analysis in trading . Trendlines continually form on the charts of markets across all the different timeframes providing huge opportunities for traders
What Is Trend Master Pro? Trend Master Pro   is a professional-grade trend trading indicator built for MetaTrader 5. It was designed with one goal in mind — to keep you on the right side of the market at all times by combining three powerful technical tools into a single, clean, easy-to-read display directly on your price chart. Instead of cluttering your screen with multiple separate indicators, Trend Master Pro fuses an   EMA Ribbon trend filter , a   ZigZag swing point engine , and a   breako
Delta + CVD & CVD Candles Order-flow indicator combining Delta (Ask–Bid), Cumulative Volume Delta (CVD), and a unique CVD-based synthetic candle system. Shows buy/sell pressure, volume aggressiveness, and momentum shifts with optional Delta histogram, CVD line, and CVD+Delta combined candles. Useful for scalping, intraday trading, divergence detection, and understanding buyer/seller dominance. Overview The Delta + CVD & CVD Candles Indicator combines multiple order-flow tools into one clean
This indicator is used to compare the relative strength of the trade on the chart against the other several selected symbols. By comparing the price movement of each traded variety based on the same base day, several trend lines of different directions can be seen, reflecting the strong and weak relationship between the several different traded varieties, so that we can have a clearer understanding of the market trend. For example, you can apply this indicator on a EurUSD chart and compare it w
GannZigZagMACDインジケーター詳細説明 目的とコンセプト GannZigZagMACD は、MetaTrader 5プラットフォーム用のハイブリッド技術指標で、従来のMACD指標とギャンのジグザグ要素を組み合わせたものです。この指標は、極値パターンに基づいてトレンド転換を識別し、取引シグナルを生成するために設計されています。 この指標の主なアイデアは、ギャンの方法を使用して重要な高値と安値を検出し、その後MACDヒストグラムにシグナルを投影することです。 動作原理 主な構成要素: 従来のMACD - 短期(12期間)と長期(26期間)の指数移動平均線の差を計算 シグナルライン - MACDヒストグラムの平滑化移動平均線(デフォルト:9期間EMA) ギャンのアルゴリズム - 指定されたバー範囲(GSv_range)に基づいて重要な極値を決定 シグナル矢印 - MACDヒストグラム上の反転矢印で、潜在的なエントリーポイントを示す シグナル生成メカニズム: この指標は 反転ロジック を使用します: 緑色の上向き矢印(233) → 売りシグナル 赤色の下向き矢印(234) → 買
STRICTLY FOR BOOM INDEX ONLY!!!!! Here I bring the Maximum Trend Arrows OT1.0 MT5 indicator. This indicator is made up of a combination of different trend indicators for entries and exits, for entries an orange arrow will paint on the chart below the current market and a red flag for closing of trades and it produces buy arrows only. When the orange arrow appears, it will appear along with it's sound to notify you. The 1H timeframe is recommended, don't use it anywhere else than on the 1H timefr
MarketPredict Pro – 高度な多層型マーケット分析システム   仕組み MarketPredict Pro は、6つの独立した分析レイヤーを組み合わせ、次のローソク足を高精度で予測します。   6つの分析レイヤー Buyers/Sellers Pressure   – 買い手と売り手の強さを測定 Trend Strength   – SMA(20) によるトレンド強度計算 Volatility   – ATR に類似した14期間のボラティリティモデル Market Pressure   – 直近5本のローソク足の累積市場圧力 Prediction Engine   – 多因子による次のローソク足予測 Real‑time Panel   – リアルタイム市場統計パネル   技術アルゴリズム   圧力計算モデル 出来高、方向性、価格変動を組み合わせた加重圧力分析。   統計的精度 STRONG シグナル:   82–87% NORMAL シグナル:   73–78% SIDEWAYS / UNCERTAIN:   65–70%  
The Rainbow Dragon Indicator by Quant Atlas Creator:  https://www.quant-atlas.com/ The Rainbow Dragon is a composite signal engine that aggregates the seven Rainbow indicators — Blue, Green, Indigo, Red, Violet, Yellow, and Orange — into a single confluence-based reading. Rather than relying on any one model, it treats each Rainbow component as an independent voter and fires only when enough of them agree, giving you a diversified, multi-method read on the market instead of a single point of vie
The Riko Trend indicator is a revolutionary trend trading and filtering solution with all the important features of a trend tool built into one tool! The Riko Trend indicator is good for any trader, suitable for any trader for both forex and binary options. You don’t need to configure anything, everything is perfected by time and experience, it works great during a flat and in a trend. The Riko Trend indicator is a technical analysis tool for financial markets that reflects the current price f
ADVANCED FUNCTIONALITIES: Trend Score (0-100) with visual bar Intelligent signals with adjustable strength (1-10) Risk management with automatic TP/SL Audible and visual alerts Price zones with smooth filling Multi-indicator analysis (RSI, ATR, BB, EMAs) DESIGN FEATURES Modern Visual: Smooth and well-spaced lines (EMA with 2-3px width) Vibrant and professional colors (Sky Blue, Orange, Gold) Modern arrows (code 233/234) for buy/sell signals Configurable dark/light theme Adjustable transparency f
Crypto_Forex インジケーター   PINBAR パターン MT5用。リペイントなし、遅延なし。 - インジケーター「PINBARパターン」は、プライスアクション取引に非常に強力なインジケーターです。 - インジケーターはチャート上のピンバーを検出します。 - 強気のピンバー - チャート上に青い矢印シグナルを表示します(画像参照)。 - 弱気のピンバー - チャート上に赤い矢印シグナルを表示します(画像参照)。 -   PC およびモバイルのアラート付き 。 - インジケーター「PINBARパターン」は、サポート/レジスタンスレベルと組み合わせるのに最適です。 高品質のトレーディングロボットとインジケーターをご覧になるにはここをクリックしてください! これは、このMQL5ウェブサイトでのみ提供されるオリジナル製品です。
Crash 1000 Scalping Indicator for the Crash 1000 Deriv Synthetic Index. Introduction The Crash 1000 Scalping Indicator is a specialized tool designed for the Crash 1000 index on the Deriv Synthetic market. This indicator is particularly useful for scalping on the M1 timeframe, helping traders to identify precise entry and exit points for buy positions. It is designed to be non-repainting, providing clear signals with audible alerts and push notifications, and is compatible with mobile devices th
Introduction The "Two Moving Average Crossover" indicator for MetaTrader 5 (MT5) is a technical analysis tool that displays two moving averages and notifies when the moving averages cross each other. The indicator calculates and plots two moving averages, one of which is faster and the other is slower. When the faster moving average crosses above the slower moving average, it is considered a bullish signal, indicating a potential trend reversal or the start of a new uptrend. Conversely, when th
The Super Arrow Indicator provides non-repainting buy and sell signals with exceptional accuracy. Key Features No repainting – confirmed signals remain fixed Clear visual arrows: green for buy, red for sell Real-time alerts via pop-up, sound, and optional email Clean chart view with no unnecessary clutter Works on all markets: Forex, gold, oil, indices, crypto Adjustable Parameters TimeFrame Default:   "current time frame" Function:   Sets the time frame for indicator calculation Options:   Can
Visual CrossPulse Dynamics: Trade with the Market's True Rhythm Unlock a new level of market insight with Visual CrossPulse Dynamics, a sophisticated trading indicator designed to adapt to ever-changing volatility and reveal the true direction of the trend. Are you tired of indicators that lag in fast-moving markets or give false signals during consolidation? The Visual CrossPulse Dynamics indicator solves this problem by using an advanced, adaptive algorithm that intelligently adjusts to the m
このプロダクトを購入した人は以下も購入しています
Neuro Poseidon is a new indicator by Daria Rezueva. It combines precise trading signals with adaptive TP/SL levels - creating best possible trades as a result! Message me and get  Neuro Poseidon Assistant  as a gift to automize your trading process! What makes it stand out? 1. Proven profitability on all assets and timeframes 2. Only confirmed BUY and SELL signals present on the chart 3. Adaptive TP & SL levels generated by the software for each trade 4. Easy to understand - suitable for al
SuperScalp Pro
Van Minh Nguyen
4.68 (28)
SuperScalp Pro – プロフェッショナル多層コンフルエンス・スキャルピングシステム SuperScalp Proは、インテリジェントなマルチファクター確認システムを通じて高確率の取引機会を特定するために設計された、プロフェッショナルなマルチレイヤー・コンフルエンストレーディングシステムです。Supertrend、VWAP、EMA、RSI、ADX、出来高分析、ボリンジャーバンド、およびMACDダイバージェンスを統合することで、低品質なセットアップを排除し、ダマシのブレイクアウトシグナルを減らし、エントリー精度を向上させます。 XAUUSD、BTCUSD、および主要なForex通貨ペア向けに特別に最適化されたSuperScalp Proは、ATRベースのボラティリティロジックとルールベースのシグナル検証を通じて市場環境の変化に適応し、M1からH4までの複数時間足で一貫性と客観性のある取引確認を提供します。 内蔵されたスマートコントロールパネルにより、リアルタイムで完全なカスタマイズが可能です。トレーダーは個別の確認フィルターを有効または無効にし、市場環境、取引スタイル、リスク許
まず正直に言いましょう。 どんなインジケーターも、それ単体であなたを利益化させることはできません。もしそう言う人がいるなら、それは夢を売っているだけです。完璧な売買シグナル(矢印)を表示するインジケーターは、いくらでも“完璧に見せる”ことができます。正しい過去の区間を拡大して、勝ちトレードだけを切り取ればいいだけです。私たちはそれをしません。 SMC Intraday Formula はツールです。 市場構造を読み取り、最も高い確率の価格ゾーンを特定し、今この瞬間のスマートマネーの痕跡をシンプルな言葉で正確に示します。最終判断はあなたが行います。トレードを実行するのもあなたです。しかし今は「希望」ではなく「精度」でエントリーできます。 私たちはこのインジケーターを、ゴールド(XAUUSD)および主要FX通貨ペアで約3年間、日々のスキャルピングに使用してきました。M1、M5、M15、M30の主要ツールです。これは未来を予測しようとするのではなく、今まさに形成されている高確率セットアップを示し、その理由を説明します。 他のすべてのインジケーターと何が違うのか? ほとんどのトレーディングイ
開発者からのお知らせ: 149ドル でご購入いただけるライセンスは 残り2件 です。完売後、価格は 169ドル に変更されます。 開発者からのお知らせ: ご購入後、 最新の推奨設定ファイル(Set File) 、運用アドバイス、および他の M1 Quantum ユーザーと交流できる VIPサポートグループ への招待をご希望の場合は、お気軽にご連絡ください。 M1 Quantum は、M1専用のプロフェッショナルトレーディングシステムであり、ストップロス、テイクプロフィット、スマートな資金管理を内蔵した、迅速かつ正確な取引シグナルを提供します。 M1 Quantum は、 連続勝利 に重点を置いて口座を素早く成長させるために設計されたプロフェッショナルな資金管理を備えています。 M1 Quantum インジケーター の主な特徴 M1時間足 およびすべての 主要通貨ペア 向けに設計 すべての取引にストップロスとテイクプロフィットを設定 資金管理 を実装し、トレーダーが簡単に取引できるようサポート 高い勝率と高い 連続勝利 リペイントなし、遅延なし あらゆるトレーダーにとって理解しやすい
このインジケーターを購入された方には、以下の特典を 無料 で提供しています: 各トレードを自動で管理し、ストップロスとテイクプロフィットを設定し、戦略ルールに基づいてポジションを決済する補助ツール 「Bomber Utility」 様々な銘柄に合わせたインジケーターの設定ファイル(セットファイル) 「最小リスク」、「バランスリスク」、「待機戦略」 の3つのモードで使用できる Bomber Utility 用の設定ファイル このトレーディング戦略をすぐに導入・設定・開始できる ステップバイステップのビデオマニュアル ご注意: 上記の特典を受け取るには、MQL5のプライベートメッセージシステムを通じて販売者にご連絡ください。 オリジナルのカスタムインジケーター 「Divergence Bomber(ダイバージェンス・ボンバー)」 をご紹介します。これは、MACDのダイバージェンス(乖離)戦略に基づいた 「オールインワン」型のトレーディングシステム です。 このテクニカルインジケーターの主な目的は、価格とMACDインジケーターの間に発生するダイバージェンスを検出 し、将来の価格の動きを示す
Entry In The Zone and SMC Multi Timeframe is a real-time 2-in-1 market analysis tool that combines market structure analysis and a No Repaint BUY / SELL signal system into a single indicator, built on Smart Money Concepts (SMC) — a widely adopted framework used by professional traders to understand market structure. This indicator helps you see the market more clearly, make decisions based on structure rather than guesswork, and focus on high-probability zones where price is more likely to react
Gann Made Easy   は、ミスター・ギャンの理論を使用した取引の最良の原則に基づいた、プロフェッショナルで使いやすい外国為替取引システムです。 W・D・ガン。このインジケーターは、ストップロスとテイクプロフィットレベルを含む正確な買いと売りのシグナルを提供します。 PUSH通知を利用して外出先でも取引可能です。 ご購入後、取引方法の説明と優れた追加インジケーターを無料で入手するには、私にご連絡ください! おそらく、ギャンの取引手法についてはすでに何度も聞いたことがあるでしょう。通常、ギャンの理論は初心者のトレーダーだけでなく、すでにある程度の取引経験がある人にとっても非常に複雑なものです。なぜなら、ギャンの取引手法は理論的にはそれほど簡単に適用できるものではないからです。私はその知識を磨き、最良の原則を私の外国為替インジケーターに組み込むために数年を費やしました。 このインジケーターは非常に簡単に適用できます。必要なのは、それをチャートに添付し、簡単な取引推奨事項に従うだけです。このインジケーターは常に市場分析の仕事を行い、取引の機会を探します。適切なエントリーポイントを検
このインジケーターは、市場で 関心が示されたゾーン をハイライトし、その後に 注文の蓄積ゾーン を表示します。 これは、大規模な**板情報(オーダーブック)**のように機能します。 これは、 巨大な資金 のためのインジケーターです。その性能は卓越しています。 市場にどんな関心が存在していても、 必ず目に見えるようになります 。 (これは 完全に再設計され、自動化されたバージョン です。もはや手動分析は必要ありません。) トランザクションスピード(取引速度) は新しい概念のインジケーターで、市場で大口注文が どこに・いつ 集中しているかを示し、それに基づいたチャンスを提供します。 トレンドの変化を 非常に早い段階 で察知することができます。 FXでは「出来高」と呼ばれているものは誤解されています。実際には、これは 時間あたりの価格変動量 です。したがって、正しい名称は トランザクションスピード です。 考え方・行動・分析の仕方すべてが問われます。 分析パラダイムの転換は非常に重要です。 このインジケーターは、FXにおける出来高の考え方を 根本から再定義 し、論理的な形で正確に活用する、
この製品は 2026 年の市場向けに更新され、最新の MT5 ビルドに最適化されています。 価格更新のお知らせ: Smart Trend Trading System は現在 $99 で提供されています。 次の 30 件の購入 後、価格は $199 に上がります。 特別オファー: Smart Trend Trading System を購入後、私にプライベートメッセージを送ることで、 Smart Universal EA を無料 で受け取り、Smart Trend のシグナルを自動売買に変えることができます。 Smart Trend Trading System は、リペイントなし、再描画なし、遅延なしの完全なトレーディングシステムです。よりクリーンなシグナル、より明確なトレンド方向、そしてより整理された取引方法を求めるトレーダー向けに作られています。 Online course , manual and [download presets] . このシステムは、トレンド検出、反転ゾーン、Smart Cloud、トレーリングストップロジック、サポートとレジスタンス、ローソク足の色分け
Power Candles V3 - 自己最適化型強弱インジケーター Power Candles V3は 、通貨や銘柄の強さを、適用されたすべてのチャート上で実行可能なトレードプランに変換します。単にローソク足を色分けするだけでなく、バックグラウンドでリアルタイムの自動最適化を実行し、目の前の銘柄に対して最適なストップロス、テイクプロフィット、およびシグナルの閾値を提示します。ワンクリックで実取引に適用でき、エントリーポイント、ストップロス、テイクプロフィットのラインが正確な価格位置にチャート上に表示され、方向性を示すアラートがリアルタイムで発動します。 このツールは、Stein Investmentsのエコシステムの一部です。  18種類以上のツールをすべて閲覧し、AIを活用したセットアップの推奨事項を入手し、  https://stein.investments でコミュニティに参加しましょう クローズしたバーごとに3,000回以上のトレードシミュレーション。9つの強さの状態。2つの戦略を並行してテスト。勝率の高い設定をワンクリックで適用。 なぜこれが必要なのか ほとんどの強
GEM Signal Pro GEM Signal Pro は、MetaTrader 5 向けのトレンドフォロー型インジケーターです。より明確なシグナル、より整理されたトレードセットアップ、そして実用的なリスク管理をチャート上で確認したいトレーダーのために設計されています。 単純な矢印だけを表示するのではなく、GEM Signal Pro はトレード全体の考え方を、より見やすく分かりやすい形で表示します。条件が確認されると、インジケーターはエントリー価格、ストップロス、利確目標をチャート上に表示し、トレードセットアップをより効率的に確認できるようにします。 動作の仕組み このインジケーターは、まず内部ロジックに基づいて有効なシードシグナルを検出します。 確認条件が満たされると、GEM Signal Pro はチャート上に完全なセットアップを表示します。これにより、トレーダーはトレード構造をより明確に把握し、手作業による分析を減らすことができます。 チャート上のトレードレベル 確認済みシグナルに対して、GEM Signal Pro は以下を表示できます。 エントリー価格 ストップロス テ
Trend Sniper X
Sarvarbek Abduvoxobov
5 (2)
Trend Sniper X — 概要 Trend Sniper X は、HTF SuperTrendエンジンとEMAフィルターを組み合わせた、MetaTrader 5用のマルチタイムフレーム・トレンド追従型インジケーターです。上位タイムフレームのトレンド方向に応じて現在のタイムフレームのローソク足の色を変更し、トレンドの転換点をBUY/SELL矢印でマークします。 価格情報: 現在の価格はプロモーション価格であり、今後のアップデートや新機能のリリースに伴い変更される場合があります。 Code2Profit チャンネル   マルチタイムフレーム分析で市場を制覇しましょう!   Trend Sniper X : システマティックな市場分析とアップデート   技術仕様 プラットフォーム MetaTrader 5 インジケータータイプ マルチタイムフレーム・トレンドキャンドル(SuperTrendベース) シグナルソース HTF SuperTrend (ATRベース) + HTF EMAフィルター 動作タイムフレーム 任意のチャートタイムフレーム。独立して選択可能な上位タイムフレーム(M1〜
UZFX {SSS} スキャルピング・スマートシグナル v4.0 MT5は、変動の激しい市場において正確かつリアルタイムのシグナルを求めるスキャルパー、デイトレーダー、スイングトレーダー向けに設計された、リペイントのない高性能な取引インジケーターです。(UZFX-LABS)によって開発されたこのインジケーターは、価格行動分析、トレンド確認、スマートフィルタリングを組み合わせることで、すべての通貨ペアおよび時間軸において、高確率の売買シグナル、警告シグナル、トレンド継続の機会を生成します。 トレードの判断に迷うのはもうやめましょう。明確さ、正確さ、そして規律ある市場執行を求めるトレーダーのために設計された、体系的なシグナルシステムに従い始めましょう。 私のおすすめ* 最適な時間足:15分足以上。 {H1} が私のお気に入りです。そして、その成果は驚異的です…!! 主な機能の更新 • 自動売買シグナル検出 • 高度な反転認識ロジック • 市場反転の可能性に先立つ早期警告シグナル • トレンド継続確認シグナル • エントリー、ストップロス、TP1、TP2、TP3レベルを備えた組み込み型
この製品は 2026 年の市場向けに更新され、最新の MT5 ビルドに最適化されています。 価格更新のお知らせ: Atomic Analyst は現在 $99 で提供されています。 次の 30 件の購入 後、価格は $199 に上がります。 特別オファー: Atomic Analyst を購入後、私にプライベートメッセージを送ることで、 Smart Universal EA を無料 で受け取り、Atomic Analyst のシグナルを自動売買に変えることができます。 Atomic Analyst は、リペイントなし、再描画なし、遅延なしの Price Action トレーディングインジケーターで、手動取引、シグナルの明確化、EA 自動化のために設計されています。 User manual: settings, inputs and strategy.   &   User Manual PDF . 価格行動、強さ、モメンタム、マルチタイムフレーム方向、高度なフィルターを分析し、トレーダーがノイズを減らし、弱いセットアップを避け、より構造化された取引判断を行えるようにします。 このイ
ご紹介     Quantum Breakout PRO は 、ブレイクアウト ゾーンの取引方法を変革する画期的な MQL5 インジケーターです。 13年以上の取引経験を持つ経験豊富なトレーダーのチームによって開発されました。     クォンタム ブレイクアウト プロ   は、革新的でダイナミックなブレイクアウト ゾーン戦略により、あなたのトレーディングの旅を新たな高みに押し上げるように設計されています。 クォンタム ブレイクアウト インジケーターは、5 つの利益ターゲット ゾーンを備えたブレイクアウト ゾーン上のシグナル矢印と、ブレイクアウト ボックスに基づいたストップロスの提案を提供します。 初心者トレーダーにもプロのトレーダーにも適しています。 量子EAチャネル:       ここをクリック 重要!購入後、インストールマニュアルを受け取るためにプライベートメッセージを送ってください。 推奨事項: 時間枠: M15 通貨ペア: GBPJPY、EURJPY、USDJPY、NZDUSD、XAUUSD アカウントの種類: ECN、Raw、またはスプレッドが非常に低い R
AXIOM MATRIX MT5 ローンチ価格:$99 Axiom Matrix はローンチ価格 $99 でご利用いただけます。 最初の30件の購入後、価格は $199 に上がります。 Axiom Matrix は、MetaTrader 5 用のプロフェッショナルなマルチシンボル・マルチタイムフレーム市場スキャナー兼意思決定ダッシュボードです。 Market Watch をスキャンし、複数の時間足を分析し、複数のエビデンスエンジンを読み取り、最も強いチャンスを比較し、1つのクリーンなマトリックスダッシュボード内で最適な BUY、SELL、WAIT、またはブロック状態を表示します。 私が Axiom Matrix を作った理由は、市場スキャンという重い作業を代わりに行ってくれる1つのツールが欲しかったからです。 RSI だけを確認したくありませんでした。 次に MACD だけ。 次に移動平均線。 次に出来高。 次にボラティリティ。 次にサポートとレジスタンス。 そして、1つのトレードアイデアを作るためだけに、銘柄と時間足を手動で切り替えることもしたくありませんでした。 私は、市場をスキャ
ARIPoint
Temirlan Kdyrkhan
1 (1)
ARIPoint is a powerful trading companion designed to generate high-probability entry signals with dynamic TP/SL/DP levels based on volatility. Built-in performance tracking shows win/loss stats, PP1/PP2 hits, and success rates all updated live. Key Features: Buy/Sell signals with adaptive volatility bands Real-time TP/SL/DP levels based on ATR Built-in MA Filter with optional ATR/StdDev volatility Performance stats panel (Success, Profit/Loss, PP1/PP2) Alerts via popup, sound, push, or email Cu
BTMM State Engine Pro is a MetaTrader 5 indicator for traders who use the Beat The Market Maker approach: Asian session context, kill zone timing, level progression, peak formation detection, and a multi-pair scanner from a single chart. It combines cycle state logic with a built-in scanner dashboard so you do not need the same tool on many charts at once. What it does Draws the Asian session range; session times can follow broker server offset or be set in inputs. Tracks level progression (L
Quantum TrendPulse を ご紹介します。これは、   SuperTrend   、   RSI   、および Stochastic のパワーを 1 つの包括的なインジケーターに組み合わせて、取引の可能性を最大限に引き出す究極の取引ツールです。精度と効率を求めるトレーダー向けに設計されたこのインジケーターは、市場のトレンド、勢いの変化、最適なエントリー ポイントとエグジット ポイントを自信を持って特定するのに役立ちます。 主な特徴: SuperTrend 統合: 現在の市場動向に簡単に追従し、収益性の波に乗ることができます。 RSI精度: 買われすぎと売られすぎのレベルを検出し、市場の反転のタイミングに最適で、SuperTrendのフィルターとして使用されます。 確率的精度: 確率的振動を活用して、変動の激しい市場で隠れたチャンスを見つけます。SuperTrend のフィルターとして使用されます。 マルチタイムフレーム分析:   M5 から H1 または H4 まで、さまざまなタイムフレームで市場を常に把握します。 カスタマイズ可能なアラート: カスタム取引条件が満たされ
FX Trend NG:次世代マルチマーケット・トレンドインテリジェンス 概要 FX Trend NG は、複数の時間足に対応したプロフェッショナル向けトレンド分析およびマーケット監視ツールです。 市場全体の構造を数秒で把握することができます。 複数のチャートを切り替える必要はありません。どの銘柄がトレンド中なのか、どこでモメンタムが弱まっているのか、そしてどの時間足で強い整合性があるのかを瞬時に確認できます。 ローンチ特別オファー – FX Trend NG を $30(6ヶ月) または $80 永久ライセンス でご利用いただけます。 すでに Stein Investments のユーザーですか? -> メッセージを送信 して、プライベートグループへアクセスしてください。 セットアップや詳細情報が必要ですか? -> Stein Investments 公式ページ をご覧ください。 1. FX Trend NG が他と異なる理由 3ステート・トレンドロジック ― Buy と Sell だけではない • 多くのインジケーターは Buy または Sell の2状態のみを表示します。
GoldenX Entryは、MT5向けのインジケーターであり、適応型Smart Entry Trendアルゴリズム、シグナルスコアリングシステム、マーケットレジーム検出機能、およびボラティリティフィルターを備えています。各シグナルには、計算されたエントリーレベル、3つのテイクプロフィット(TP1、TP2、TP3)、およびストップロスレベルが含まれます。本インジケーターは、異なる市場環境に適応するために設計された複数の分析レイヤー上に構築されており、マルチレイヤー分析システムと内蔵オプティマイザーおよび統計トラッキングシステムを組み合わせています。リスク・リワード(RR)指標および過去のトレード履歴に基づく定量分析を提供します。 使い始めは簡単です — 選択した時間足でオプティマイザーを実行し、そのままチャート上でインジケーターを使用します。 コア機能 GoldenX Entryは、シグナルエンジンとトレード管理機能、そして過去統計トラッキングを1つのチャートに統合しています: - 内蔵オプティマイザー: オプティマイザーはチャート上でワンクリックで実行できます。200通りのパラメー
Crystal Heikin Ashi Signals - Professional Trend & Signal Detection Indicator Advanced Heikin Ashi Visualization with Intelligent Signal System for Manual & Automated Trading Final Price: $149 ---------> Price goes up $10 after every 10 sales . Limited slots available — act fast . Overview Crystal Heikin Ashi Signals is a professional-grade MetaTrader 5 indicator that combines pure Heikin Ashi candle visualization with an advanced momentum-shift detection system. Designed for both manual traders
Current event:  https://c.mql5.com/1/326/A2SR2025_NoMusic.gif MT5向けA2SR インジケーター:自動実需給(S/R)。 + 取引商品。 Product description in English here. --   Guidance   : -- at   https://www.mql5.com/en/blogs/post/734748/page4#comment_16532516 -- and  https://www.mql5.com/en/users/yohana/blog 強力で信頼性が高く、時間を節約。よりスマートな取引判断を実現。 + EA互換オブジェクト。 主な利点 先行する実SRレベル(遅延やリペイントなし) 2014年以来、MT4で長年にわたり信頼性が実証されてきたA2SRが 、MetaTrader 5でも利用可能になりました。 価格がサポートレベルとレジスタンスレベルに到達する前に、実際のサポートレベルとレジスタンスレベルを特定できる、リペイントなしの先行インジケーターにより、トレー
この製品は 2026 年の市場向けに更新され、最新の MT5 ビルドに最適化されています。 価格更新のお知らせ: Smart Price Action Concepts は現在 $200 で提供されています。 次の 30 件の購入 後、価格は $299 に上がります。 特別オファー: 購入後、私にプライベートメッセージを送ることで、 無料ボーナス + ギフト を受け取ることができます。 まず、このトレーディングツールはリペイントなし、再描画なし、遅延なしのインジケーターであり、プロフェッショナルな取引に最適であることを強調しておきます。 Online course , and manual Smart Price Action Concepts Indicator は、初心者から経験豊富なトレーダーまで使える非常に強力なツールです。20 種類以上の便利なインジケーターを 1 つにまとめ、Inner Circle Trader Analysis や Smart Money Concepts Trading Strategies などの高度な取引アイデアを組み合わせています。このインジケ
Gold Stuff mt5
Vasiliy Strukov
4.9 (192)
Gold Stuff mt5 は、金専用に設計されたトレンド指標であり、あらゆる金融商品にも使用できます。 インジケーターは再描画せず、遅れません。 推奨時間枠 H1. 設定と個人的なボーナスを得るために、購入後すぐに私に連絡してください!  トレンド スキャナーの強力なサポートを利用して、無料のインジケーターを入手し、プライバシーを守ります。あーみー!   設定 矢印を描く - オンオフ。 チャートに矢印を描く。 アラート - 可聴アラートのオンオフ。 メール通知 - オンオフ。 電子メール通知。 プチ通知 - オンオフ。 プッシュ通知。 次に、色域を調整します。 Gold Stuff mt5 は、金専用に設計されたトレンド指標であり、あらゆる金融商品にも使用できます。 インジケーターは再描画せず、遅れません。 推奨時間枠 H1. 設定と個人的なボーナスを得るために、購入後すぐに私に連絡してください!   設定 矢印を描く - オンオフ。 チャートに矢印を描く。 アラート - 可聴アラートのオンオフ。 メール通知 - オンオフ。 電子メール通知。 プチ通知 - オンオ
Azimuth Pro
Ottaviano De Cicco
5 (7)
Azimuth Pro V2:MT5向けシンセティック・フラクタル構造分析と確認済みエントリー 概要 Azimuth Pro は Merkava Labs によるマルチレベルスイング構造インジケーターです。4つのネストされたスイングレイヤー、スイングアンカーVWAP、ABCパターン検出、3タイムフレーム構造フィルタリング、そして確定バーでの確認済みエントリー — 1つのチャートで、ミクロスイングからマクロサイクルまでを網羅するワークフロー。 これはブラインドシグナル製品ではありません。ロケーション、コンテキスト、タイミングを重視するトレーダーのための構造ファーストワークフローです。 ️ サマーセール — 夏至とThe Oracle Proの発売を記念して、Azimuth Proが30%オフ。現在279 USD(通常399 USD)。期間限定の夏季オファー。 1. V2での変更点 シンセティック・マルチタイムフレームエンジン 上位タイムフレーム分析をMeridian Proと同じ独自のシンセティックアーキテクチャで一から再構築。よりクリーンなHTFコンテキスト、安定したライブ動作、
FX Power: 通貨の強弱を分析して、より賢い取引を実現 概要 FX Power は主要通貨と金の実際の強弱をあらゆる市場状況で理解するための必須ツールです。強い通貨を買い、弱い通貨を売ることで、 FX Power は取引の意思決定を簡素化し、高い確率の取引機会を見出します。トレンドを追従する場合でも、極端なデルタ値を使用して反転を予測する場合でも、このツールはあなたの取引スタイルに完全に適応します。ただ取引するだけではなく、 FX Power で賢く取引をしましょう。 1. なぜ FX Power がトレーダーにとって非常に有益なのか 通貨と金のリアルタイム強弱分析 • FX Power は主要通貨と金の相対的な強弱を計算し、マーケットダイナミクスに関する明確な洞察を提供します。 • どの資産がリードしているか、または後れを取っているかを監視して、取引するペアを賢く選びましょう。 マルチタイムフレームの包括的なビュー • 短期、中期、長期のタイムフレームで通貨と金の強弱を追跡し、マーケットトレンドに基づいて取引戦略を調整できます。 • スキャルピングからスイングトレード
Quant Direction は、3次元の市場分析ツールです。完全に客観的なアルゴリズムベースの市場分析を提供し、様々なパラメータにわたる正確なパーセンテージ偏差を同時に算出します。高度なAI搭載モデリングツールで開発され、厳密なテストを経て開発されたこのアルゴリズムは、かつてない精度で市場を分析するように設計されています。プラットフォーム上では、あらゆる通貨ペアや金融商品を分析できます。 短期取引、デイトレード、スイングトレードなど、どのような取引スタイルに も、Quant Directionは最適な選択肢です。 オペレーターの本当の利点 Quant Directionの真の利点は、感情、眼精疲労、過剰分析を完全に排除できる点にあります。方向性を探るために何十ものチャートを手作業で精査したり、自分の好みを常に疑ったりする必要がなくなります。このシステムは、8つの時間間隔(5ヶ月から月単位まで)をミリ秒単位で処理します。あらゆる瞬間に市場を支配している主体を正確に明らかにし、常に成功確率が最も高い方向で取引できるようにします。 市場分析の3つの側面 このアルゴリズムは市場を3つの
Reversion King Indicator
Eugen-alexandru Zibileanu
5 (5)
新たな王者が登場 - インジケーター + 注文管理表示(TP1 + TP2 + TP3)+ オプションのTelegramシグナル送信機能付き(無料) (完全なトレード&シグナルシステム) ゴールド向け最高のEA: Gold Slayer このインジケーターには、高度な戦略、カスタマイズ可能な注文管理システム、そしてエンベロープ拡張を組み合わせた平均回帰システムが搭載されています。さらに、RSIなど複数のインテリジェントな確認フィルターによって、高確率の反転エントリーをBUY・SELLシグナルとして検出します。 単にトレードを学ぶだけでなく、複数ポジションを効果的に管理し、過去に利益を出しているオープンポジションで損失トレードをカバーする方法も学べます。 M5向けに構築・最適化されており、流動性が高くシグナルの精度が安定しているBTCUSDとXAUUSDで優れたパフォーマンスを発揮します。 このインジケーターは、ATRを基に自動計算されたエントリー、ストップロス、テイクプロフィットレベルを備えた明確なLong・Shortシグナルを提供するため、リスク管理が最初から組み込まれています。 マ
The Oracle Pro:MT5向け合成マルチタイムフレーム・バイアスエンジン ️ サマー・ローンチ・オファー — The Oracle Pro を 199 USD で(早期購入者向け)。価格は普及に応じて上昇します。最終価格 399 USD。 The Oracle Pro は、要求の高いプロのトレーダーのために作られた MetaTrader 5 向けのプレミアム・マルチタイムフレーム バイアスエンジン です。ひとつの問いに規律をもって答えます。すなわち、各タイムフレームの現在の方向バイアスは何か、その強さはどれほどか、そしてタイムフレーム同士はどれだけ一致しているか。すべては確定足のみで計算され、リペイントはありません。 The Oracle Pro はマルチファクター・コンセンサス・システムです。独自のインジケーターと最適化されたアルゴリズムを単一の高度なコンセンサス・ベクトルに統合し、それを単一のインジケーター・インスタンス内で現在足と上位足のスタックにわたって読み取ります。複数のチャートにばらばらのツールを積み重ねる代わりに、です。 これは Oracle コンセンサス手法
作者のその他のプロダクト
インディケータは、価格とオシレーター/インディケーターの間に発散が発生したときを識別します。これは、通常の分岐と隠れた分岐の両方を識別します。最強のセットアップのみをフィルターで除外できるRSIフィルターオプションがあります。インディケータは、巻き込みフォーメーション、ドンチアンチャネルブレイクアウト、または移動平均を超える価格を待つオプションも提供します (スクリーンショット#3を参照)     貿易機会を知らせる前に発散を確認する。独自のルールとテクニックを組み合わせることで、このインジケーターを使用して、独自の強力なシステムを作成(または強化)できます。 特徴 の終わりに     製品のブログ   インジケーターからトレードシグナルを取得するためにiCustom()関数を使用しているサンプルエキスパートアドバイザー(EA)のソースコードをダウンロードすることができます。 EAは完全に機能しますが、主な目的は、コードを使用して、独自に開発したEAに貼り付けることです。 限られた時間で   ただし、プログラミングサポートを提供することはできません。 謝罪いたします 次のオシレーター
The indicator identifies when a divergence occurs between price and an indicator or oscillator. It identifies both regular and hidden divergences. Combined with your own rules and techniques, this indicator will allow you to create (or enhance) your own powerful system. For higher probability setups I can recommend you to use my Supply Demand indicator and trade only if the divergence occurs inside a zone. Supply zone for bearish div and demand zone for bullish div. The optimal scenario is if it
FREE
このインジケーターは、チャート上に需要と供給のゾーンを描画します。独自のルールやテクニックと組み合わせることで、このインジケーターを使用して独自の強力なシステムを作成 (または強化) できます。さらに多くの機能を提供する 有料版 もぜひご確認ください。私の推奨は、少なくとも 25 バー後に最初のゾーン テストが発生する取引機会を探すことです。 特徴 ゾーンには 3 つの色があります (入力によって調整可能)。テストされていないゾーンは暗い色、テスト済みのゾーンは中くらいの色 、壊れたゾーンは明るい色です 。 各ゾーンにはゾーン外枠の価格とゾーンテストの金額が記載されています。 入力パラメータ 最初の極値を検索するための最大バックバー数 -     デフォルトは 3000 です。最初の極値を xx バー分遡って検索します。値が大きいほど、より多くのシステム リソースが必要になります 。遅いコンピューターの場合は、500 ~ 1000 の値が適している場合があります。 ゾーンテスト間のキャンドルの最小数 未テストの需要色 テスト済みの需要色 壊れた需要の色 未テスト供給色 テスト済みの供給
FREE
This multi indicator/oscillator (hereafter indicator), multi time frame and multi symbol indicator identifies when a divergence occurs between price and one, two or three indicators. It identifies both regular/classical (trend reversal) and hidden (trend continuation) divergences. It has RSI and MA trend filter options which makes it possible to filter out only the strongest setups. Combined with your own rules and techniques, this indicator will allow you to create (or enhance) your own powerfu
This indicator can send alerts when a Heiken Ashi Smoothed color change occurs. Combined with your own rules and techniques, this indicator will allow you to create (or enhance) your own powerful system. Features Can send all types of alerts. Option to delay the alert one or more bars in order to confirm the color (trend) change. Input parameters Candle shift for alert: Default is 1. Setting it to 0 will alert you on color change on the current candle. This should be regarded as a pending (uncon
FREE
このインジケーターは、チャート上に需要と供給のゾーンを描画します。独自のルールやテクニックと組み合わせることで、このインジケーターを使用して独自の強力なシステムを作成 (または強化) できます。さらに多くの機能を提供する 有料版 もぜひご確認ください。私の推奨は、少なくとも 25 バー後に最初のゾーン テストが発生する取引機会を探すことです。 特徴 ゾーンには 3 つの色があります (入力によって調整可能)。テストされていないゾーンは暗い色、テスト済みのゾーンは中くらいの色 、壊れたゾーンは明るい色です 。 各ゾーンにはゾーン外枠の価格とゾーンテストの金額が記載されています。 入力パラメータ 最初の極値を検索するための最大バックバー数 -     デフォルトは 3000 です。最初の極値を xx バー分遡って検索します。値が大きいほど、より多くのシステム リソースが必要になります 。遅いコンピューターの場合は、500 ~ 1000 の値が適している場合があります。 ゾーンテスト間のキャンドルの最小数 未テストの需要色 テスト済みの需要色 壊れた需要の色 未テスト供給色 テスト済みの供給
FREE
I recommend you to read the   product's blog  (manual) from start to end so that it is clear from the beginning what the indicactor offers. This multi time frame and multi symbol indicator identifies double or triple top/bottom formations or a following neckline breakout (confirmed top/bottom). It offers RSI, pin bar, engulfing, tweezer, morning/evening star filters as well divergence filter options which makes it possible to filter out only the strongest setups. The indicator can also be used
このマルチタイムフレームとマルチシンボルインジケーターは、次の5つのクロスを識別できます。 動きの速い平均が動きの遅い平均線と交差するとき。 価格が単一の移動平均に達したとき(上/下で閉じているか、ちょうど跳ね返った)。 三重移動平均フォーメーションが出現したとき(3つのMAすべてが連続して整列) MACDメインラインがシグナルラインと交差するとき。 信号線がMACDzero(0)線と交差するとき。 このインジケーターを独自のルールや手法と組み合わせると、独自の強力なシステムを作成(または強化)できます。 特徴 マーケットウォッチウィンドウに表示されている選択したシンボルを同時に監視できます。インジケーターを1つのチャートに適用し、市場全体を即座に監視します。 M1からMNまでのすべての時間枠を監視でき、クロスオーバーが識別されたときにリアルタイムのアラートを送信します。すべてのアラートタイプがサポートされています。 追加のトレンドフィルターとしてRSIを使用できます。 インジケータには、インタラクティブパネルが含まれています。アイテムをクリックすると、問題のシンボルと時間枠で新しいチ
可能であれば購入をご検討ください   私が開発を続ける MT5 バージョン (この MT4 バージョンの今後の更新はありません)。こちらもお読みになることをお勧めします     製品のブログ (マニュアル) を最初から最後まで参照して、EA が提供するものを最初から明確にします。 このエキスパートアドバイザー (EA) の主な戦略は、3 つの移動平均 (MA) が連続して整列し、互いに一定の距離にある場合に取引を行うことです (たとえば、一部の機関投資家が使用するあまり知られていない戦略に使用できます)。 、これには D1 時間枠の MA 10、20、および 30 が含まれます)。 EA は、H1 以降の時間枠で最適に機能します。トリプル MA 戦略 (使用される MA: に関係なく) は、長期的な戦略と見なす必要があります。悪い月が続くかもしれません。したがって、この EA は、頻繁な取引と短期的な一定の利益を求めるトレーダー向けではありません。デフォルト設定は EURUSD H1 用に最適化されています (2015.01.01 から 2022.03.31 までのバックテスト、22
The indicator identifies when a divergence occurs between price and an indicator or oscillator. It identifies bullish and bearish hidden or regular (classical) divergences. Combined with your own rules and techniques, this indicator will allow you to create (or enhance) your own powerful system. For higher probability setups I can recommend you to use my  Supply Demand indicator  and trade only if the divergence occurs inside a zone. Supply zone for bearish div and demand zone for bullish div. T
FREE
この需給ゾーンインジケーターはチャート上にゾーンを描画し、価格がゾーンに到達またはゾーンを超えたときにアラートを送信します。ゾーンの代わりに、通常のダブルトップ/ボトムについてアラートを受け取るために使用することもできます。 RSI、ADX、ボリューム、および発散フィルターを使用して、最も強力なセットアップのみをフィルターで除外することができます。独自のルールとテクニックを組み合わせることで、このインジケーターを使用して、独自の強力なシステムを作成(または強化)できます。この指標は、需要と供給にすでに精通している経験豊富なトレーダー向けであり、取引を終了または開始することを決定する際にどのように使用できるかを示しています。 特徴 次の分岐がサポートされています。       MACD、OsMA、RSI、CCI、確率論的および素晴らしい。 ゾーンには3色があります(入力で調整可能)。テストされていないゾーンの場合は暗い色、テストされたゾーンの場合は中程度、壊れたゾーンの場合は明るい色。 ゾーンの外側の境界線の価格とゾーンテストの量は、各ゾーンで書き込まれます。 インディケータは、エキス
I recommend you to read the   product's blog  (manual) from start to end so that it is clear from the beginning what the indicactor offers. This multi time frame and multi symbol divergence dashboard indicator sends an alert when one or two different divergences have been identified. It can be used with all time frames from M1 to MN. Maximum 9 time frames can be shown in the dashboard at the same time. It is possible to enable moving average, RSI or Bollinger bands trend filter to filter out on
I recommend you to read the   product's blog  (manual) from start to end so that it is clear from the beginning what the indicactor offers. This multi time frame and multi symbol indicator identifies double or triple top/bottom formations or a following neckline breakout (confirmed top/bottom). It offers filters for RSI overbought/oversold, candle patterns (pin bar, engulfing, tweezer, morning/evening star, three line strike) and divergences (MACD, OsMA, Awesome (AO), RSI, CCI, Stochastic) whic
This indicator can send alerts when a Heiken Ashi Smoothed color change occurs. Combined with your own rules and techniques, this indicator will allow you to create (or enhance) your own powerful system. Features Can send all types of alerts. Option to delay the alert one bar in order to confirm the color (trend) change. Input parameters Wait for candle close: 'true' or 'false'. Setting it to 'true' will delay the alert to the opening of the bar following the bar where the color change occurred.
FREE
この需給ゾーンインジケーターはチャート上にゾーンを描画し、価格がゾーンに到達またはゾーンを超えたときにアラートを送信します。ゾーンの代わりに、通常のダブルトップ/ボトムについてアラートを受け取るために使用することもできます。 RSI、ADX、ボリューム、および発散フィルターを使用して、最も強力なセットアップのみをフィルターで除外することができます。独自のルールとテクニックを組み合わせることで、このインジケーターを使用して、独自の強力なシステムを作成(または強化)できます。この指標は、需要と供給にすでに精通している経験豊富なトレーダー向けであり、取引を終了または開始することを決定する際にどのように使用できるかを示しています。 特徴 次の分岐がサポートされています。       MACD、OsMA、RSI、CCI、確率論的および素晴らしい。 ゾーンには3色があります(入力で調整可能)。テストされていないゾーンの場合は暗い色、テストされたゾーンの場合は中程度、壊れたゾーンの場合は明るい色。 ゾーンの外側の境界線の価格とゾーンテストの量は、各ゾーンで書き込まれます。 インディケータは、エキス
This multi indicator/oscillator (hereafter indicator), multi time frame and multi symbol indicator identifies when a divergence occurs between price and one, two or three indicators. It identifies both regular/classical (trend reversal) and hidden (trend continuation) divergences. It has RSI and MA trend filter options which makes it possible to filter out only the strongest setups. Combined with your own rules and techniques, this indicator will allow you to create (or enhance) your own powerfu
This multi time frame and multi symbol indicator scans for pin bars. Combined with your own rules and techniques, this indicator will allow you to create (or enhance) your own powerful system. Features Can monitor all symbols visible in your Market Watch window at the same time. Apply the indicator to just one chart and instantly monitor the entire market. Can monitors every time frame, from M1 to MN, and sends you a real-time alert when a pin bar is identified. All Metatrader native alert types
I  recommend you to read the   product's blog  (manual) from start to end so that it is clear from the beginning what the indicator offers. This multi time frame and multi symbol indicator scans for engulfing and tweezer formations.  The indicator can also be used in single chart mode. Combined with your own rules and techniques, this indicator will allow you to create (or enhance) your own powerful system. Features Can monitor all symbols visible in your Market Watch window at the same time. A
I  recommend you to read the   product's blog  (manual) from start to end so that it is clear from the beginning what the indicator offers. This multi time frame and multi symbol indicator scans for engulfing and tweezer formations. The indicator can also be used in single chart mode. Combined with your own rules and techniques, this indicator will allow you to create (or enhance) your own powerful system. Features Can monitor all symbols visible in your Market Watch window at the same time. Ap
Features This is an indicator that recognizes a special type of Inside Bar formation which is formed by a Master candle followed by 4 smaller candles (please see the strategy explanation below). Plots buy/sell stop lines on the chart as well as well as take profit and stop loss levels. The TP/SL levels are based on the Average True Range (ATR) indicator. Object colors are changeable. Sends you a real-time alert when a Master candle formation is identified - sound / pop-up / email / push notifica
This multi time frame and multi symbol indicator identifies high-probability breakout patterns. It does this by identifying strong, symmetrical pennants and triangles. This pattern  DOES NOT  appear very often on higher timeframes. But when it does, it is a very high-probability setup. The indicator also includes an Inside bars scanner. It can for example be used to detect a special type of Inside bars formation which is formed by a Master candle (MC) followed by 4 inside candles (please see the
This indicator recognizes a special type of Inside Bar formation which is formed by a big Master candle followed by 4 smaller candles (please see the strategy explanation below). Features Plots buy/sell stop lines on the chart as well as well as take profit and stop loss levels. The TP/SL levels are based on the Average True Range (ATR) indicator. Object colors are changeable. Sends you a real-time alert when a Master candle formation is identified - sound / popup / email / push notification. On
ぜひ読んでみてください     製品のブログ (マニュアル)を最初から最後まで読んで、インジケーターが提供するものが最初から明確になるようにします。 このマルチタイムフレームおよびマルチシンボルインジケーターは、ピンバーをスキャンします。独自のルールとテクニックと組み合わせることで、このインジケーターを使用して独自の強力なシステムを作成 (または強化) できます。 特徴 マーケットウォッチウィンドウに表示されるすべてのシンボルを同時に監視できます。インジケーターを 1 つのチャートに適用するだけで、市場全体を即座に監視できます。 M1 から MN までのすべての時間枠を監視し、ピンバーが識別されるとリアルタイムのアラートを送信します。すべての Metatrader ネイティブ アラート タイプがサポートされています。 潜在的な反転を適切に識別するために、RSI をトレンド フィルターとして使用できます。 インジケーターにはインタラクティブ パネルが含まれています。別のスクリーンショットを参照してください。 買い/売りラインと TP/SL ライン (ATR 乗数に基づく) を表示するよ
This multi time frame and multi symbol indicator identifies high-probability breakout patterns. It does this by identifying strong, symmetrical pennants and triangles. This pattern DOES NOT appear very often on higher time frames. But when it does, it is a very high-probability setup. The indicator also includes an Inside bars scanner. It can for example be used to detect a special type of Inside bars formation which is formed by a Master candle (MC) followed by 4 inside candles (please see the
このマルチタイムフレームとマルチシンボルインジケーターは、ピンバー、朝/夕方の星、巻き込み、ピンセット、3つのラインストライク、内側のバー、ペナントと三角形をスキャンします。インジケーターはシングルチャートモードでも使用できます。このオプションの詳細については、製品の     ブログ 。独自のルールとテクニックを組み合わせることで、このインジケーターを使用して、独自の強力なシステムを作成(または強化)できます。 特徴 マーケットウォッチウィンドウに表示されているすべてのシンボルを同時に監視できます。インジケーターを1つのチャートに適用し、市場全体を即座に監視します。 M1からMNまでのすべての時間枠を監視し、パターンが識別されるとリアルタイムのアラート(ポップアップ、プッシュ、またはメール)を送信します。 潜在的な逆転を適切に特定するために、ピンバー、朝/夕方の星、巻き込み、ピンセットの形成のフィルターとしてRSIとボリンジャーバンドを使用できます。 主要なトレンドフィルターとして移動平均を使用し 、ボラティリティフィルターとしてADXを使用できます。 インジケーターにはインタラクティ
このマルチシンボルおよびマルチタイムフレームインジケーターは、次のローソク足パターンをスキャンします(パターンの説明についてはスクリーンショットを参照してください)。 3人の白人兵士(逆転>継続パターン) 3つの黒いカラス(反転>継続パターン) 強気と弱気のスリーラインストライク(反転パターン) インジケーター設定の厳密なオプションが有効になっている場合、パターンはより高い時間枠ではあまり頻繁に表示されません。しかし、そうする場合、それは非常に確率の高い設定です。 Thomas Bulkowski(国際的に有名な作家であり、ローソク足パターンの第一人者)によると、3ラインストライクはローソク足パターンの中で最高の全体的なパフォーマンスランクを持っています。このインジケーターを独自のルールや手法と組み合わせると、独自の強力なシステムを作成(または強化)できます。 特徴 マーケットウォッチウィンドウに表示されているすべてのシンボルを同時に監視できます。インジケーターを1つのチャートに適用し、市場全体を即座に監視します。 M1からMNまでのすべての時間枠を監視でき、パターンが識別されたときに
I recommend you to read the   product's blog  (manual) from start to end so that it is clear from the beginning what the indicactor offers. This multi time frame and multi symbol indicator can identify the following 5 crosses: when a fast moving average crosses a slow moving average line. when price has reached a single moving average (closed above/below or just bounced). when a triple moving average formation has appeared (all 3 MA:s in consecutive alignment). when the MACD main line crosses t
I recommend you to read the   product's blog  (manual) from start to end so that   it is clear from the beginning what the indicator offers. This multi oscillator, multi time frame and multi symbol indicator identifies when a divergence occurs between price and an oscillator/indicator. It identifies both regular/classical (trend reversal) and hidden (trend continuation) divergences. It has moving average, RSI/Bollinger, ADX, pin bar and engulfing filter options which makes it possible to filter
This multi time frame and multi symbol indicator identifies when the stochastics signal line (D) crosses the stochastics main line (K) as well as options  to scan for main line and signal line level crossovers.  As a bonus it can also scan for Bollinger bands and RSI overbought/oversold crosses. Combined with your own rules and techniques, this indicator will allow you to create (or enhance) your own powerful system. Features Can monitor all symbols visible in your Market Watch window at the sam
フィルタ:
tunck
1239
tunck 2023.07.27 22:31 
 

One of the best and cheapest on the market!

Lucky Pal
438
Lucky Pal 2021.01.05 02:26 
 

This indicator won't let me switch to another chart for some strange reason. I have it set on BrentCrude Oil (1 HR timeframe) and whenever I try to click on another window/chart it doesn't switch. This never happened with the Divergence Dashboard.

レビューに返信