Larger Price Time Crosshair Data MT5
- ユーティリティ
- バージョン: 1.4
- アップデート済み: 15 11月 2025

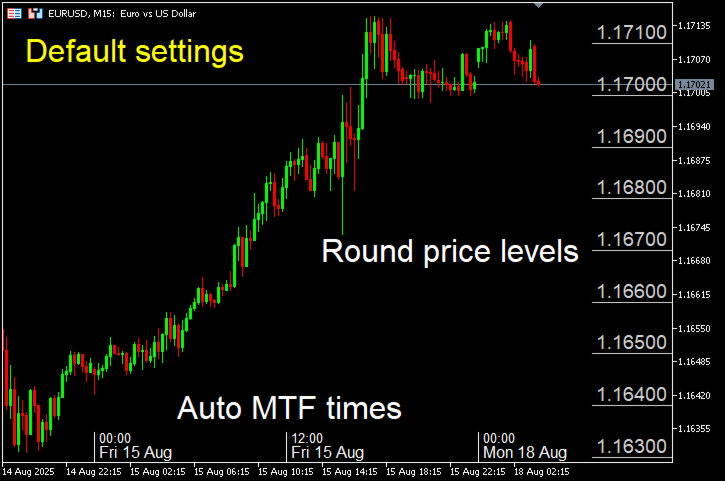
This utility indicator provides accessibility and readability, by displaying a larger price scale, time scale, crosshair, and symbol name/tf/ohlc information. All features are sizeable and can be styled separately, and are optional to show.
All Features
- optional to use
- font, size and color options
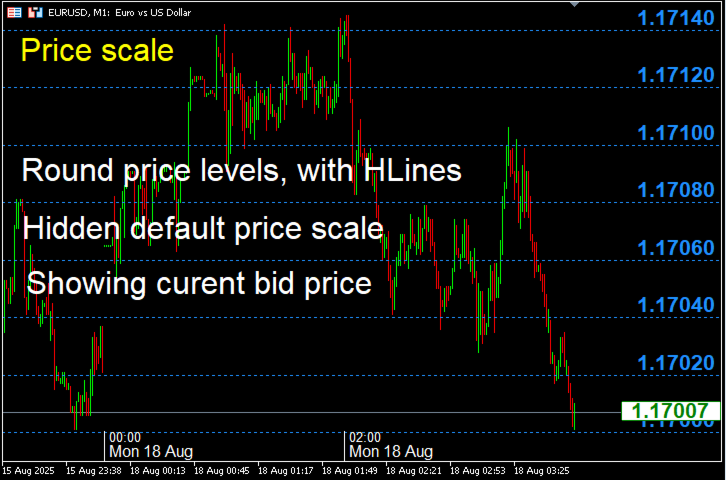
Price Scale
- option to hide the default MT5 price scale
- option to show horizontal lines at price levels
- prices drawn can be at round numbers (ie automatic rounding to multiples of 5/10/20/25 points), or a fixed count per window height (ie 6 price levels only), or with fixed pixel spacing (ie every 75pixels vertically)
- option to show bid and ask separately, with sizable tags
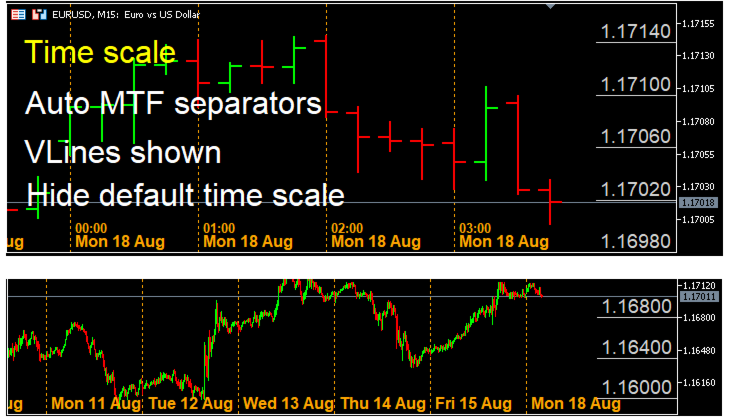
Time Scale
- option to hide the default MT5 time scale
- option to show vertical lines at drawn times
- times drawn can be at MTF times (ie automatically detect every 5min, 4hr, 1d, 1w etc), or with fixed pixel spacing (ie every 75pixels horizontally)
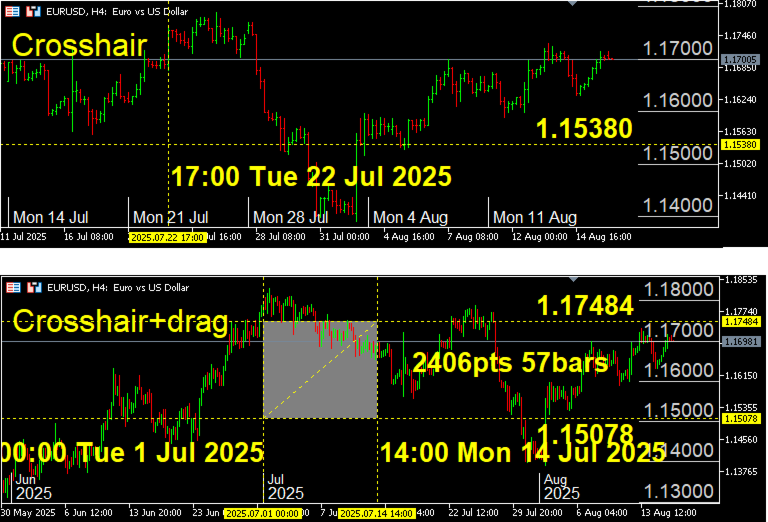
Crosshair
- can be turned on via a hotkey, the default is keyboard "c"
- option to use the drag feature, which creates a second crosshair set, with optional distance in points, candles, and time, with optional background rectangle to bound the drag area
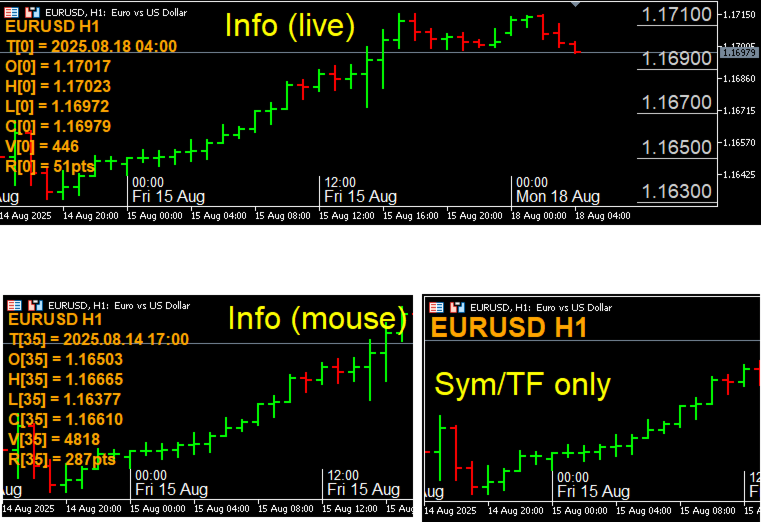
Symbol Data
- either the symbol name+tf and/or TOHLCVR can be shown (time, open, high, low, close, volume, range in points)
- optional chart corner
- option for data to track mouse


Does what it says.