Bollinger Bands Max Free
- インディケータ
- バージョン: 1.0

A BB indicator with MA options
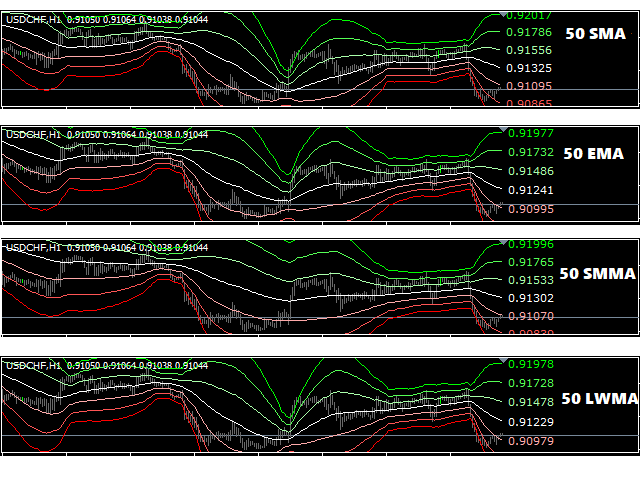
You're no longer limited to the built in default of using BB off a SMA method, now you can choose from SMA-EMA-SMMA-LWMA.
You now also have up to 3 standard deviation levels, with price labels.
Options:
- MTF
- moving average type SMA-EMA-SMMA-LWMA
- 3 adjustable deviation levels
- separate coloring to lines and texts
- If there are any issues or suggestions for the indicator, please comment and let me know. The feedback will be noted and considered in future updates.
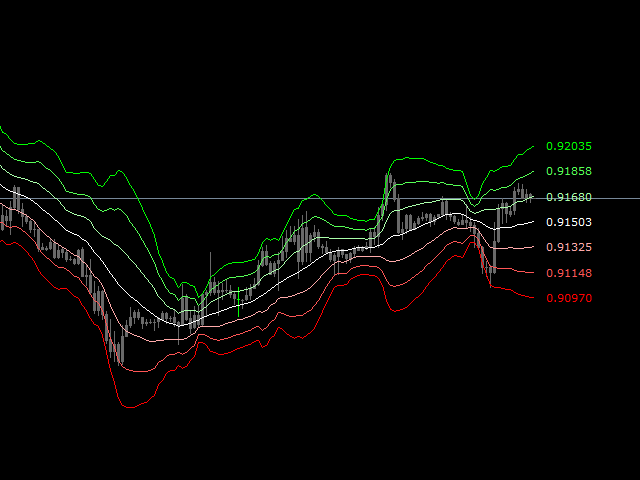
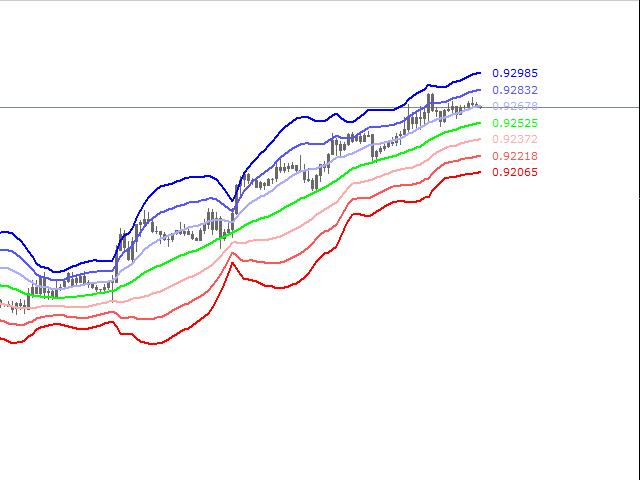


Helpful to have an idea of potential support and resistance area.