Heiken Ashi in Subwindow
- インディケータ
- バージョン: 1.0

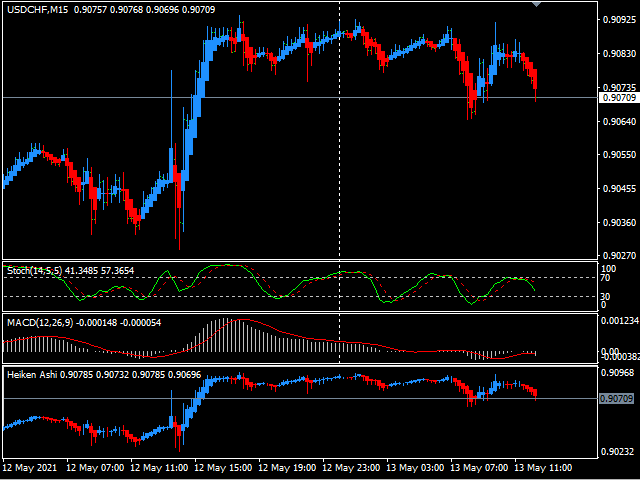
This indicator plots Heiken Ashi candles in a subwindow instead of the main chart, making it possible to analyse HA candles whilst keeping the main chart clean.
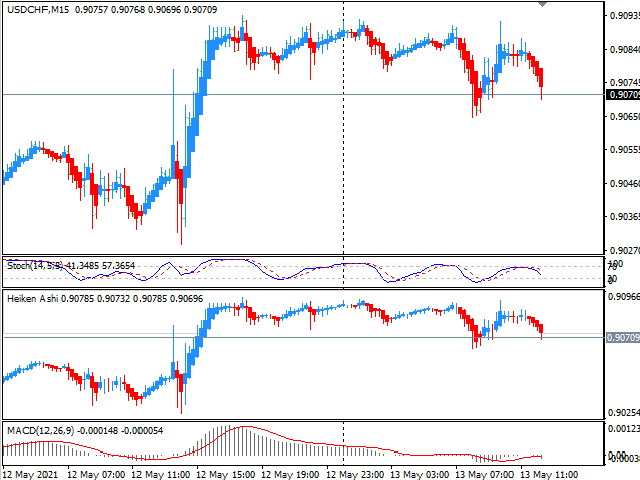
- optional bid/close line is provided, stylable, updates on tick
- HA candles are stylable via the inputs tab
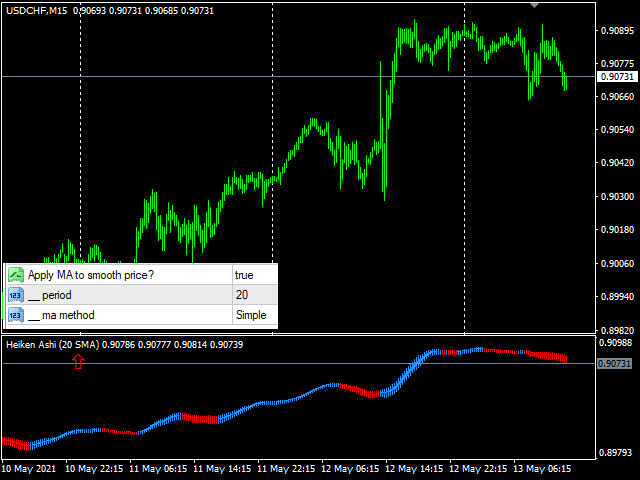
- optional price smoothing to the HA candles, with moving average period and method options
- auto-scaling when scrolling back and forth
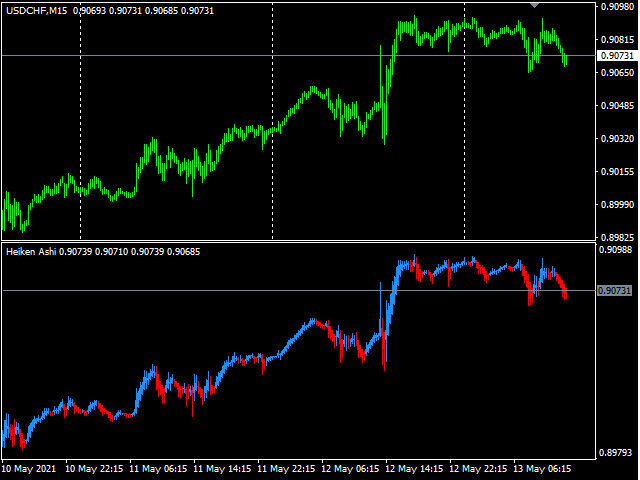


I think this is a very handy tool. Keeping HA in the sub-window allows the trader to see accurate PA from the candles or bar charts above the line. Very good John Louis. Thanks.