WinMidas MT5
- インディケータ
- Carl Gustav Johan Ekstrom
- バージョン: 1.20
- アップデート済み: 7 9月 2025
- アクティベーション: 5
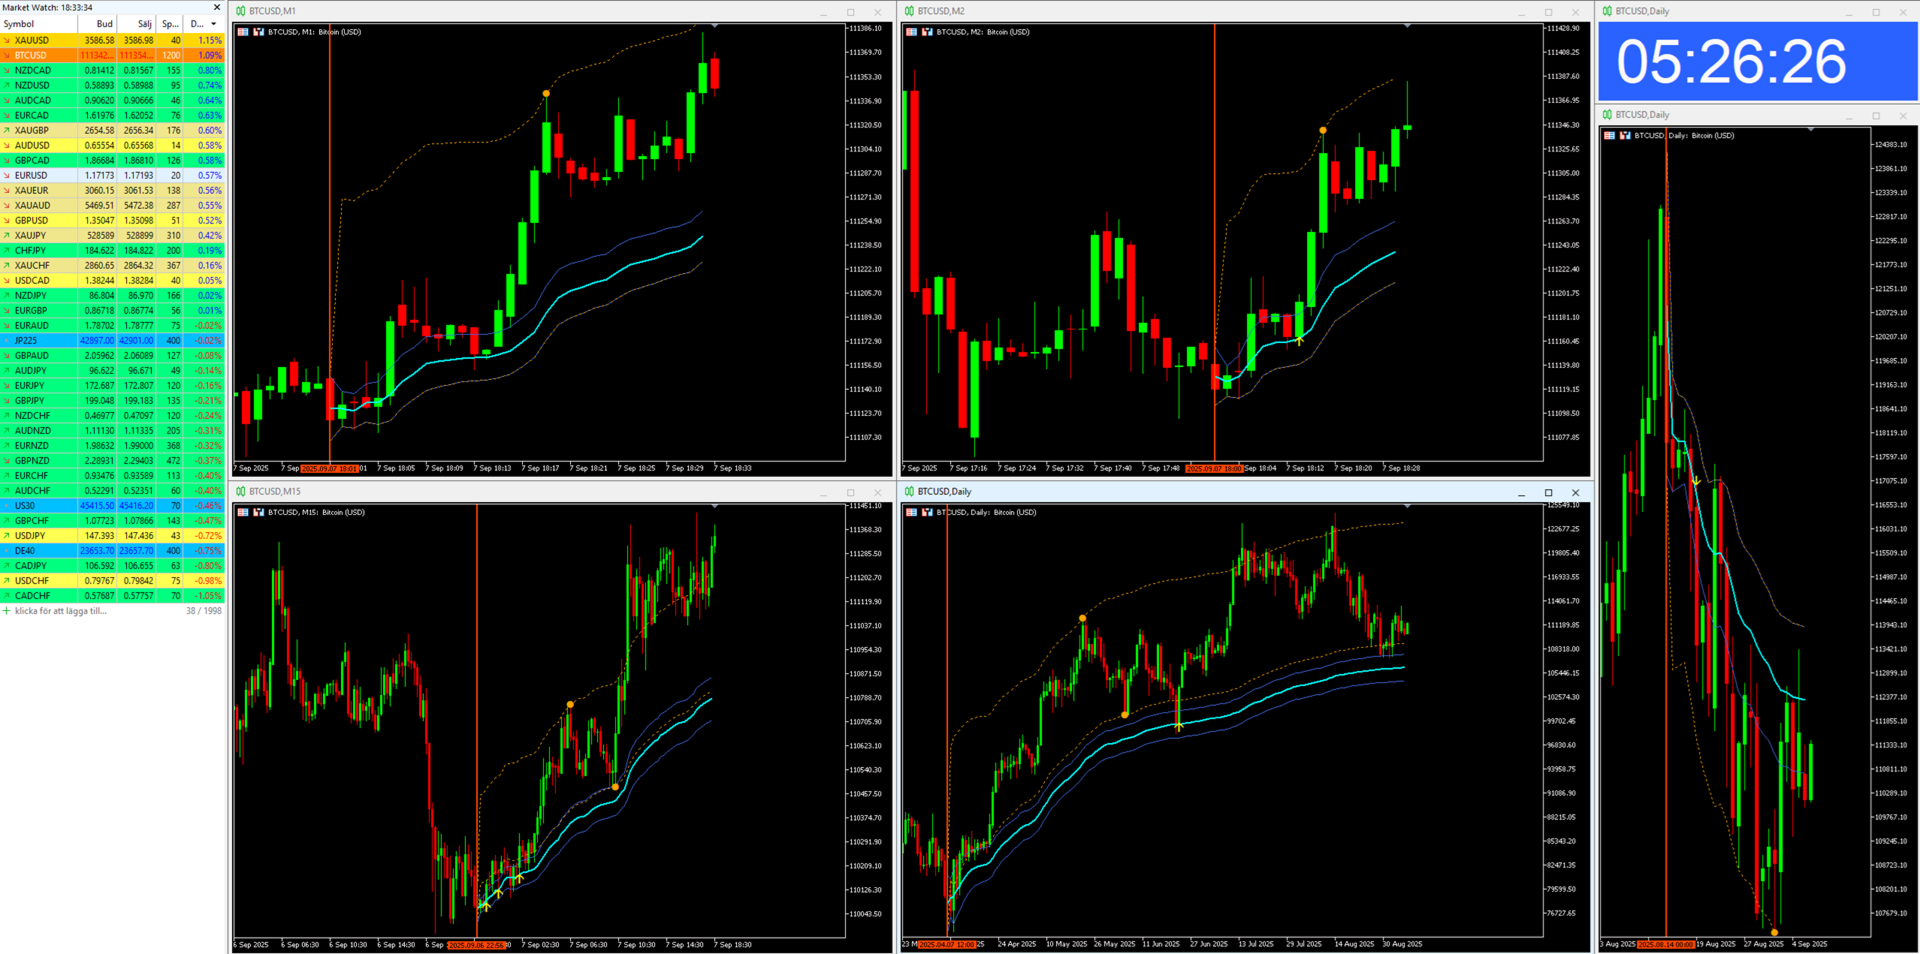
MIDAS (Market Interpretation/Data Analysis System), created by the late analyst Paul Levine, is an advanced VWAP-based method for identifying support and resistance in financial markets. Unlike traditional static lines, MIDAS curves are anchored to significant price events (such as swing highs or lows) and evolve dynamically as trading unfolds.
The method emphasizes that market structure is shaped by accumulation/distribution and support/resistance interplay, making it especially useful for trend analysis and timing entries.
For a deeper dive, see MIDAS Technical Analysis: A VWAP Approach to Trading and Investing in Today’s Markets by Andrew Coles and David Hawkins.
Key Features
-
Drag-and-drop anchoring for intuitive application
-
Automatic displacement channels aligned to swing points
-
Built-in buy/sell signals based on MIDAS setups
How to Use MIDAS
-
Identify an accelerated price move (or trend) in any market.
-
Anchor the MIDAS curve to the start of the move by dragging the red vertical line.
-
Wait for the price to pull back to the curve.
-
Enter trades when signals occur, placing your stop loss just beyond the curve.
Parameters
-
ID (1–10): Assign unique IDs for multiple instances
-
Show Displacement Curves: Yes/No
-
Show Signals: Yes/No
-
Signal Color: Yellow
-
Show Signal for...: All/Retracement/Break
-
Pop-Up Alert: Yes/No