M1 Scalper Pro MT5

4.64

- Real price is 80$ - 45% Discount (It is 45$ now)

Contact me for extra bonus indicator, instruction or any questions!

- Lifetime update free

- Non-repaint

- Related product: Gann Gold EA

- I just sell my products in Elif Kaya Profile, any other websites are stolen old versions, So no any new updates or support.

Advantages of M1 Scalper Pro 

  • Profitability: M1 Scalper Pro is highly profitable with a strict exit strategy.
  • Frequent Opportunities: M1 Scalper Pro takes advantage of numerous small price changes.
  • Minimal Market Risk: Limited exposure reduces the risk of large losses.
  • Non-directional: Works in both rising and falling markets.
  • Send alerts in platform, mobile or email.

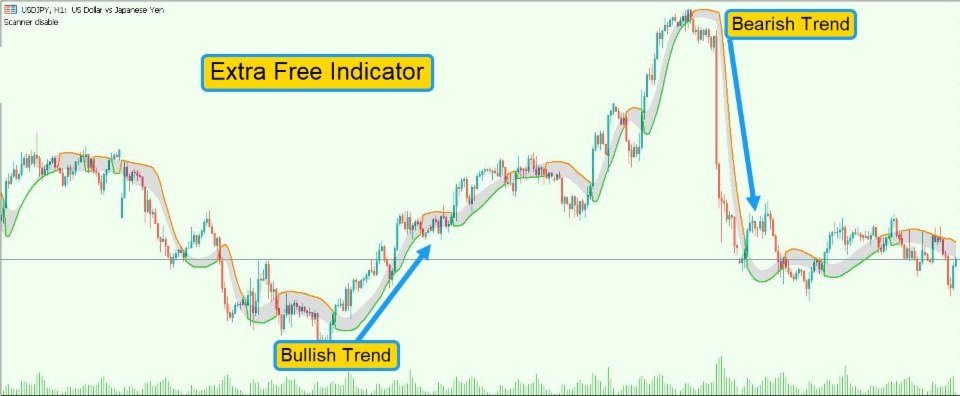
Plus Free Filtering Indicator 


    Recommended

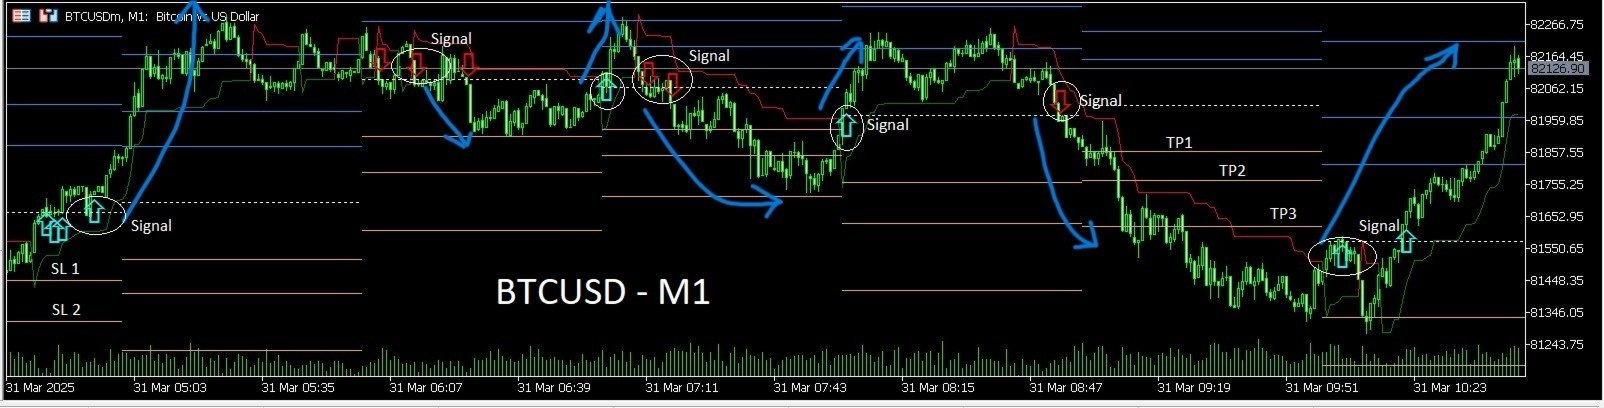
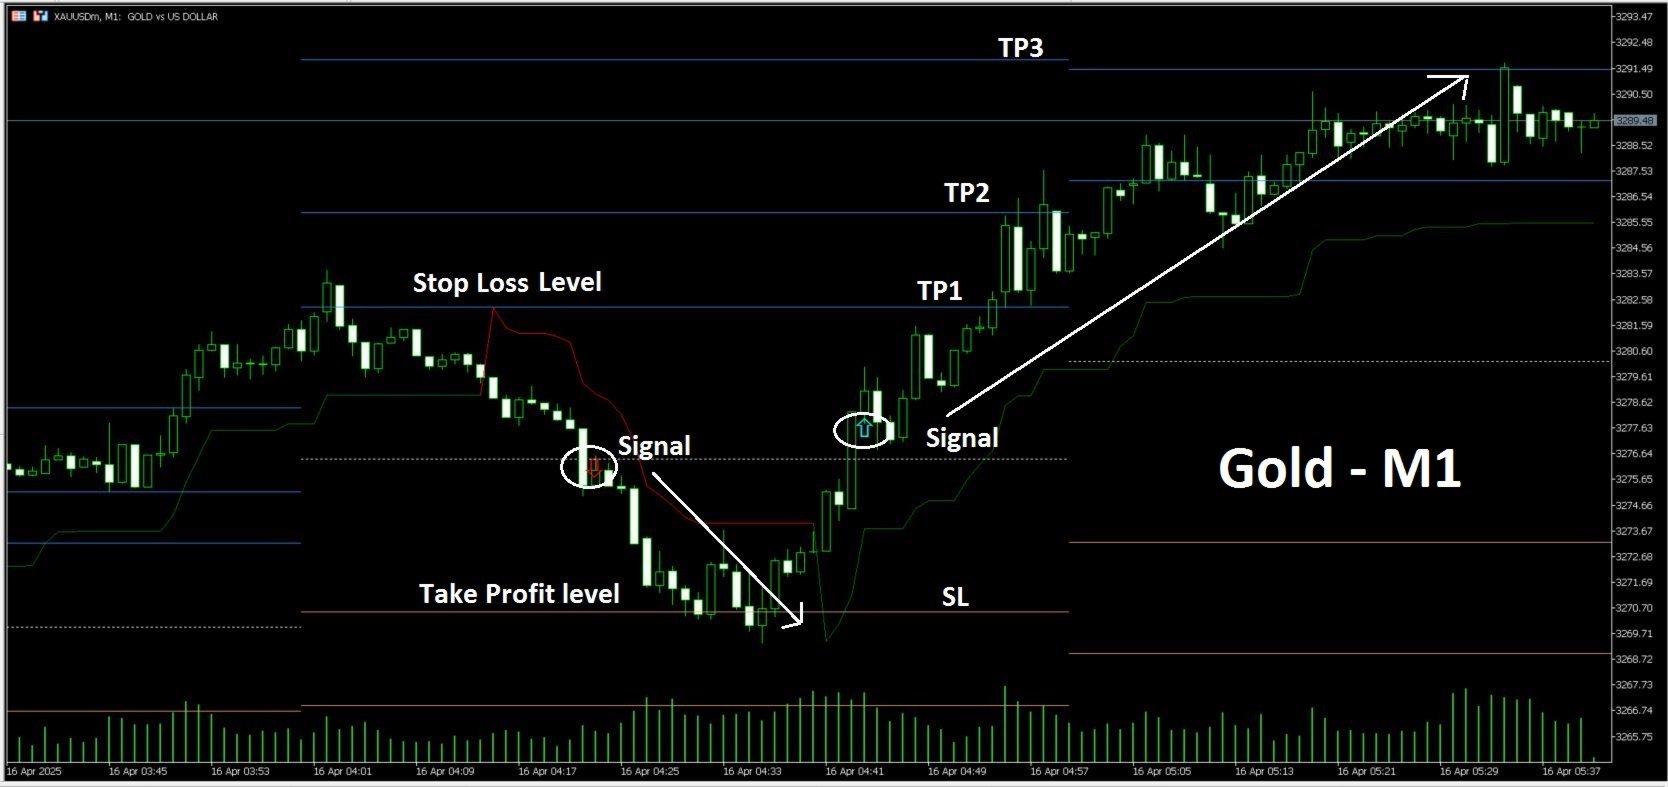
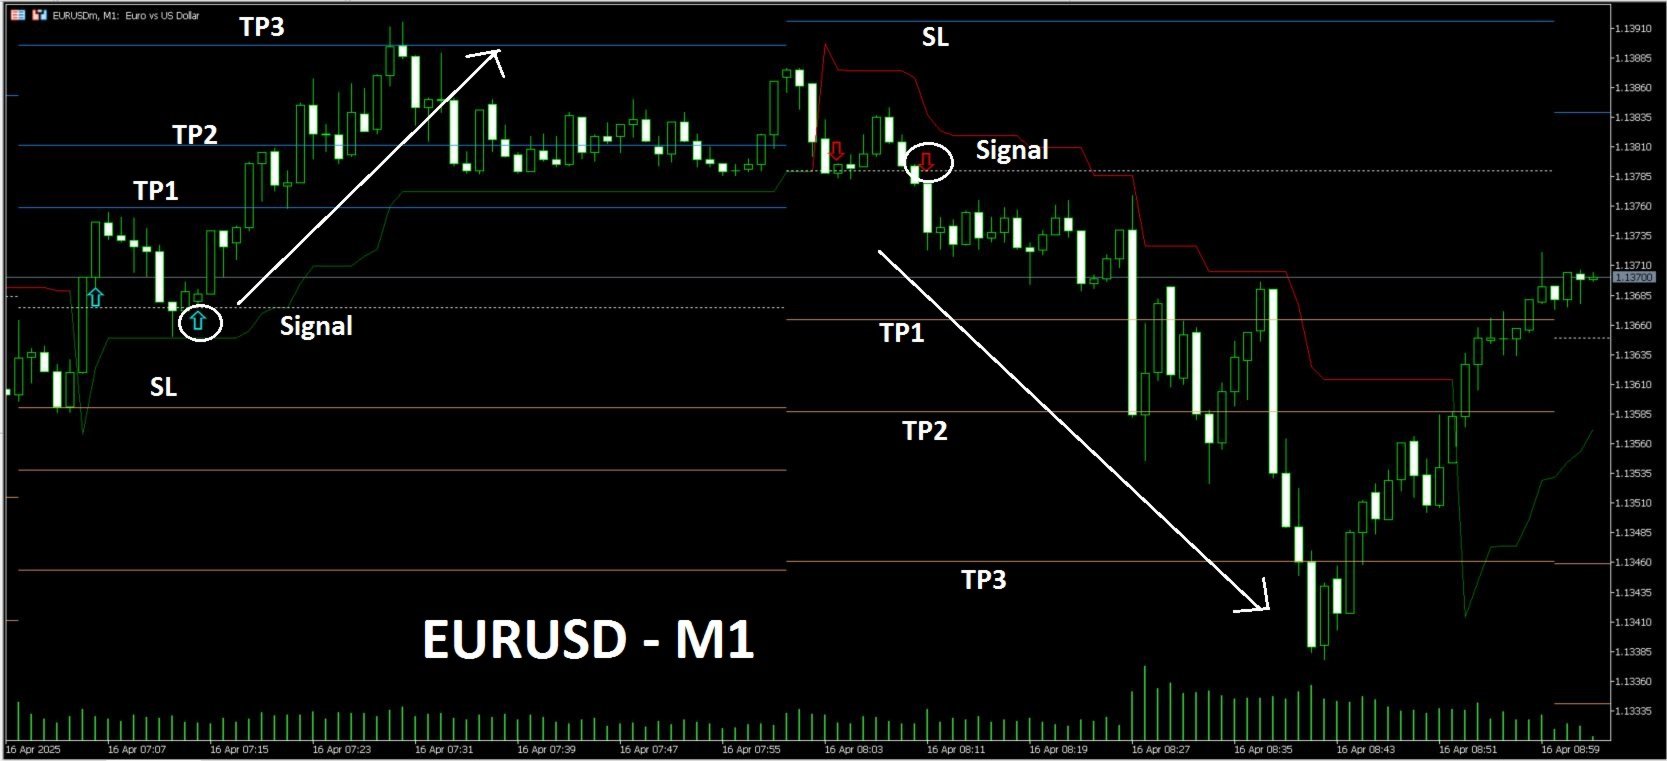
    Recommended symbols: XAUUSD, BTCUSD, EURUSD, GBPUSD and other major pairs

    Recommended Time Frame: M1


    How To Work

    Default setting is best practice and you can just add it on chart and use M1 Scalper Pro indicator, then you have signals with entry point, stop-loss, and take-profit by clear signal to decide a strong trade.
    レビュー 11
    leduan199x
    44
    leduan199x 2026.01.23 14:06 
     

    áp dụng tốt và tôi đăng sử dụng nó

    Sivakashi
    345
    Sivakashi 2025.10.13 16:20 
     

    A reliable indicator backed by reliable support—I highly recommend this to any serious M1 scalper!

    Bob0511
    632
    Bob0511 2025.10.06 14:37 
     

    This is a great indicator. I use it with a few other things and it has been the perfect addition to my current trading system. It also has excellent customer support. Author responds very quickly and will answer any questions. I highly recommend.

    おすすめのプロダクト
    The Price Tracker Indicator is designed to outline a dynamic price channel, showcasing areas where price movement is typically contained. The indicator highlights potential areas of interest where price may react when approaching the channel limits. Versatile for Scalping and Swing Trading The indicator adapts to all timeframes and can complement various trading strategies. It integrates seamlessly with tools such as supply and demand levels, reversal patterns, and other confluences. Key Feat
    CandleStick Patterns Indicator for MT5 — Professional Pattern Scanner Bring proven candlestick analysis into your workflow. This indicator automatically scans your chart and highlights high-quality reversal and continuation patterns, so you can react faster and with more confidence. Check the “More from author” section on the Market page to see our full suite of indicators. What it does Scans historical and live candles from a user-defined lookback range. Detects and labels major single- and m
    Adaptive SR Zones – Breakout Edition Adaptive SR Zones is a next-generation MetaTrader 5 indicator that automatically maps support and resistance zones and tracks breakout activity in real time. Designed for traders who rely on market structure and zone confluence, it combines multi-timeframe analysis , breakout confirmation logic , and customizable alerts into one powerful tool. No repainting. Core Features Dynamic Support & Resistance Mapping Detects zones from swing highs/lows and reaction po
    KT Price Border MT5
    KEENBASE SOFTWARE SOLUTIONS
    KT Price Border は、3本のバンドで構成された価格チャネルを作成し、市場のスイングハイとスイングローの可能性がある領域を特定します。これらのレベルは、動的なサポートおよびレジスタンスとしても使用できます。 中央のバンドは、トレンドの方向を識別するためにも使用できます。そのため、このインジケーターはトレンドフォロー型の指標としても機能します。さらに、使いやすさとシンプルなトレードシグナルにより、初心者トレーダーにとって非常に有益です。 特徴 ほとんどの FX 通貨ペアで優れたパフォーマンスを発揮します。 短時間足と長時間足の両方で使用可能です。 スキャルピング、デイトレード、スイングトレードに適しています。 トレンドフォロー戦略と逆張り戦略の両方に対応しています。 価格がバンドを超えたときにアラートを送信できます。 価格バンドは、動的なサポートおよびレジスタンスレベルとして機能します。  価格境界の概念を理解する このインジケーターは、ボリンジャーバンドと同様に機能します。下部バンドは、市場の売られ過ぎ状態を示し、動的なサポートとして機能します。 上部バンドは、市場の
    概要 外国為替や金融市場では、迅速な反応と正確な意思決定が非常に重要です。しかし、標準のMetaTrader 5端末は最小でも1分のチャートしかサポートしておらず、トレーダーが市場の変動に敏感であることを制限しています。この問題を解決するために、 秒単位チャートキャンドルインジケーター を導入しました。このインジケーターを使用すれば、1秒から30秒の市場の動向をサブチャートで簡単に表示・分析できます。 主な機能 複数の秒単位タイムフレームのサポート :このインジケーターは、以下のタイムフレームを選択でき、さまざまな取引戦略に対応します: S1 : 1秒 S2 : 2秒 S3 : 3秒 S4 : 4秒 S5 : 5秒 S10 : 10秒 S15 : 15秒 S20 : 20秒 S30 : 30秒 リアルタイム更新 :秒単位チャートはリアルタイムで更新され、各瞬間に最新の市場情報を提供します。これにより、迅速な取引判断が可能になります。 ユーザーフレンドリーなインターフェース :インジケーターはサブチャートに表示され、直感的で使いやすいです。異なるタイムフレームに素早く切り替えて市場を迅速
    Dual-Period Williams %R Oscillator for MT5 A sophisticated trend exhaustion detector that combines two Williams %R oscillators to identify high-probability reversal opportunities through confluence analysis. ======================================================================================== Key Features Intelligent Dual-Signal System Fast and Slow Williams %R periods working in confluence Real-time trend exhaustion detection with reliable signals Optimized calculations for smooth MT5 perfor
    一目で分析を強化! このインジケーターは、価格が最近反発または突破した重要なレベルを自動的に描画し、手動でラインを引くことなくサポートとレジスタンスのゾーンを表示します。チャートに適用するだけで、各期間の過去の高値・安値ラインが表示されます。 各ラインの意味 Previous Month High ‣ 前月高値:前の月の期間内で記録された最高価格。 Previous Month Low ‣ 前月安値:前の月の期間内で記録された最安価格。 Previous Week High ‣ 前週高値:前の週の期間内で記録された最高価格。 Previous Week Low ‣ 前週安値:前の週の期間内で記録された最安価格。 Previous Day High ‣ 前日高値:直前の取引日の最高価格。 Previous Day Low ‣ 前日安値:直前の取引日の最安価格。 なぜ使うのか? グラフを開いた瞬間に 反発 と 突破 を検出。 実績あるゾーンで 利確 と 損切り を設定。 SMC や ICT 戦略に必須、市場構造をベースにエントリーと決済を最適化。 スキャルピング 、 スイング
    Link to our best products: LINK Link to our Trading Dashboard: LINK !!!!!!! Attention, you can find premium discounts by clicking on arrows!!!!!! Setting of this indicator candles mode: Show zones from the beginning Swing number for highs and lows Show background color Color of Premium Color of Discount show level 0% line show level 25% line show level 50% line show level 75% line show level 100% line The Premium and Discount concept is a core principle of Smart Money Concepts (SMC) used to i
    Title: HTF Candle Insight - See the Big Picture on One Chart Introduction: Stop switching tabs constantly! HTF Candle Insight allows you to visualize Higher Timeframe price action directly on your current trading chart. Whether you are a Scalper, Day Trader, or Swing Trader, seeing the "Big Picture" candle structure is crucial for identifying trends, reversals, and key levels (Support/Resistance). Key Features: Dual HTF Overlay: Display up to 2 different Higher Timeframes simultaneously (e.g.,
    Every Trader trades in a market zone. If you are not living in the time zone you are trading, you need a clock to show you what time it is in your favorite time zone, and it should be small at the same time to not interrupt your trading process.  In this small indicator, you have access to 3 major clocks around the world, and you can easily look at them. We have some other products that I am sure will help you with your trading career. Please have a look at the link: LINK our all-in-one trading
    Liquidity Map  Overview The Liquidity Map indicator is an advanced visualization tool based on ICT Smart Money Concepts . It automatically identifies daily Buy Zones , Sell Zones , and Liquidity Levels , showing where price is likely to reverse or continue based on institutional order flow. It calculates key levels from the daily session — such as the previous day’s high, low, and midpoint — then derives a premium (sell bias) and discount (buy bias) structure. When price trades into these mapped
    The indicator for trading on the signals of the harmonic pattern AB=CD. It gives signals and shows the levels of entry into the market, as well as levels for placing stop orders, which allows the trader to make timely decisions on entering the market, as well as effectively manage positions and orders. It supports sending push notifications to a mobile device, e-mail, as well as alerts. This indicator has been ported from the version for MetaTrader 4. For more information, as well as a detailed
    SuperScalp Pro
    Van Minh Nguyen
    4.57 (21)
    SuperScalp Pro – 高度なマルチフィルタースキャルピングインジケーターシステム SuperScalp Pro は、クラシックな Supertrend と複数のインテリジェント確認フィルターを組み合わせた高度なスキャルピングインジケーターです。M1 から H4 まで複数の時間足で効率的に動作し、XAUUSD、BTCUSD、主要 Forex 通貨ペア向けに最適化されています。 このインジケーターは明確な Buy / Sell シグナルを提供し、ATR に基づいてエントリー価格、Stop Loss、Take Profit を自動計算します。Fibonacci Take Profit 機能により、重要な価格帯で早期決済し、到達時に通知を送信します。 初期設定では Fibonacci Take Profit が有効化されており、より安定した取引体験を重視しています。チャートに適用するだけですぐ利用可能です。上級者向けに、すべてのパラメータは自由にカスタマイズできます。 EMA、RSI、ADX、Volume、VWAP、Bollinger Bands、MACD Divergence な
    Heikin Ashi Heikin Ashi is a charting technique that can be used to predict future price movements. It is similar to traditional candlestick charts. However, unlike a regular candlestick chart, the Heikin Ashi chart attempts to filter out some of the market noise by smoothing out strong price swings to better identify trend movements in the market. To create Heiken Ashi, a formula is used in which price data is entered, while ordinary candles are built only on bare numbers, without using any c
    Extreme Market Flip   revolutionizes trading with precise buy/sell arrows at market bottoms and tops. Core Technology Proprietary algorithm fuses candlestick reversal patterns—like engulfing, hammer/doji at extremes—with explosive volume confirmation to filter false signals. Green up-arrows fire only on high-volume bullish engulfing at oversold bottoms; red down-arrows trigger on bearish engulfing with distribution volume at overbought peaks. ​ Signal Accuracy Non-repainting arrows plot on bar c
    これは当社のインジケーター ACB Breakout Arrows 用に開発されたマルチシンボル・マルチタイムフレームのスキャナーです。デフォルト設定では、 28種類の通貨ペアと9つの時間足 を同時にスキャンして売買シグナルを検出します。  機能 1つのチャートから 252* のシンボルと時間足の組み合わせをスキャン可能です。 ワンクリックでシグナルのチャートを開き、事前に設定されたテンプレートを自動で適用します。  チャート上のどこにでも簡単にドラッグ&ドロップで配置できます。 ポップアップ、音声、プッシュ通知、メールによるリアルタイムアラート機能を搭載しています。  入力パラメーター ACB Breakout Arrows のシグナル感度設定。 スキャンするシンボルを入力してください。  履歴の更新:履歴データが不足または壊れている場合は、再ダウンロードして更新できます。  スキャンする時間足を選択してください。 アラート設定 パネルの色やフォントサイズを調整可能です。 
    RSIBandsTREND is a custom trend-focused indicator that enhances the classic RSI approach by visualizing dynamic upper and lower bands based on RSI calculations. It plots three clean bands (upper, lower, and midline) directly on the chart, helping traders identify overbought and oversold zones with precision. Features: Three-band system: upper, lower, and center RSI lines EMA-smoothed RSI band calculation Clear trend zone visualization on chart Works on all timeframes (M1 to Monthly) Fully opt
    Trend based indicator Identify trends with this indicator A simple-to-use trend indicator No complicated settings Attributes: Can be used in all symbols Can be used in all time frames Relatively high signals No complicated settings Specific to the trend Lifetime support Settings: Alarm Show Alert: By activating these settings, after receiving the signal, you will receive an alarm in Metatrader Alarm Show Notification: By activating these settings, after receiving the signal, you will receive a
    Market Structure Break & Order Block (MSB-OB) The Market Structure Break & Order Block (MSB-OB) indicator is built to analyze price structure, highlight market structure breaks, and mark order block zones. It also provides buffers for Buy/Sell signals and MSB detection, making it suitable for both manual analysis and automated strategies. A tester panel is included to evaluate performance under different conditions in the Strategy Tester. Main Concept Market Structure Break (MSB): Occurs after
    詳細説明 Cycles Plotter – 移動平均線と開始日付付きのカスタマイズ可能なサイクル指標 Cycles Plotter は、高度なテクニカル指標で、 ユーザー入力に基づいてのみ、2つの完全にカスタマイズ可能なサイン波サイクルを描画 します。インジケーターは 自動的にサイクルを生成することはありません 。すべてのサイクルは、ユーザーが設定したパラメータに従って厳密に計算され、トレーダーに 価格の変動や潜在的なトレンド変化を分析するための視覚的ツール を提供します。自動シグナルや予測は生成されません。 主なポイント: ユーザー定義のサイクル: サイクル1(P1)およびサイクル2(P2)は、ユーザーが完全に設定可能です。サイクルの長さ、振幅、移動平均線、開始日時を設定できます。ユーザーがパラメータを入力しない場合、サイクルは描画されません。 振幅の調整: 各サイクルは異なる振幅を設定でき、基準となる移動平均線に対する波動の「高さ」を調整できます。 トレンドの判定: 速い移動平均線(Fast MA)と遅い移動平均線(Slow MA)でサイクルの方向を示します: Fast MA >
    Introduction This indicator detects volume spread patterns for buy and sell opportunity. The patterns include demand and supply patterns. You might use each pattern for trading. However, these patterns are best used to detect the demand zone (=accumulation area) and supply zone (=distribution area). Demand pattern indicates generally potential buying opportunity. Supply pattern indicates generally potential selling opportunity. These are the underlying patterns rather than direct price action. T
    LR Pivots Combo Statistics That Show You Where the Market Stands! Key Features (updated V2.1) 1. Auto-Plotting Linear Regression Channel Trend Direction — Uses slope (normalized by ATR) to identify whether the market is in an uptrend, downtrend, or ranging sideways. Trend Quality (R-Squared) — Tells you if the trend is statistically consistent (Stable) or just noise (Volatile). Useful for filtering out unreliable setups. Standard Deviation Bands — Shows how far price has deviated from the regre
    Horizontal Level indicator - reflects, using a histogram, the horizontal volumes of transactions at a certain price without reference to time. At the same time, the histogram appears directly in the terminal window, and each column of the volume is easily correlated with the quote value of the currency pair. The volume of transactions is of great importance in exchange trading, usually an increase in the number of concluded contracts confirms the trend, and their reduction indicates an imminent
    Contact me for instruction, any questions! - Lifetime update free - Non-repaint - I just sell my products in Elif Kaya Profile, any other websites are stolen old versions, So no any new updates or support. Introduction Breakout Trend Scanner indicator works based on the Elliott Wave in technical analysis describes price movements in the financial market that are related to changes in trader sentiment and psychology and finds end of movement and breakout trend. The Elliott Wave pattern that is f
    A useful scanner/dashboard that shows the RSI values for multiple symbols and Time-frames. It can be easily hidden/displayed with a simple click on the scanner man top left of the dashboard. You can input upper and lower RSI values and the colours can be set to show when above/below these values. The default values are 70 and 30. There are also input colours for when the RSI is above or below 50 (but not exceeding the upper/lower levels Symbols and time-frames are input separated by commas. S
    RSI ボリンジャーバンド矢印戦略 (RSI Bollinger Bands Arrow Strategy) RSI ボリンジャーバンド矢印戦略は、RSI とボリンジャーバンドの組み合わせを利用して、高確率な反転ポイントを特定するために設計された、クリーンで効果的なテクニカルインジケーターです。 この戦略は、RSI インジケーターとボリンジャーバンドを一緒に使用し、以下の判断を行います。 価格が ボリンジャーバンドの上限 を上回っているときに 売る 。 価格が ボリンジャーバンドの下限 を下回っているときに 買う 。 シグナルは、両方のインジケーターが同じ市場状況を 同時に 確認した場合にのみ生成され、より高い精度を確保し、誤ったエントリーを減らします。 仕組み 買いシグナル: 価格がボリンジャーバンドの 下限を下から上へ クロスする。 RSI が定義された 売られすぎ レベルを 上へ クロスする。 チャート上に 緑色 の買い矢印が表示される。 売りシグナル: 価格がボリンジャーバンドの 上限を上から下へ クロスする。 RSI が定義された 買われすぎ レベルを 下へ ク
    Introduction to Fractal Pattern Scanner Fractal Indicator refers to the technical indicator that makes use of the fractal geometry found in the financial market. Fractal Pattern Scanner is the advanced Fractal Indicator that brings the latest trading technology after the extensive research and development work in the fractal geometry in the financial market. The most important feature in Fractal Pattern Scanner is the ability to measure the turning point probability as well as the trend probabil
    Mean Reversal Heikin Ashi Indicator calculates special trade reversal points based on Heikin Ashi candlesticks patterns. This indicator can be used on all symbols, even in Forex or B3 Brazillian Markets. You can configure just the position of each arrow. Then, after include the indicator on the graphic, pay attention on each arrow that indicates a long or short trade.
    Unlock Market Insights: Dynamic Trend Analysis with Statistical Precision for MT5 Are you seeking a deeper understanding of market movements? Many traditional tools may not fully capture the complex, non-linear dynamics often seen in financial markets. This can sometimes lead to uncertainty in identifying subtle trend shifts. Introducing Adaptive PolyBands Optimizer – an advanced MQL5 indicator designed to enhance your market analysis. Unlike some conventional tools, Adaptive PolyBands Optimizer
    FREE
    G-Ca$H IC Breaker Automatic source and breaker order block indicator for MetaTrader 4 and MetaTrader 5. (This version is mt5) For user guide please see the comments section. Overview Detects and draws two key zones from price structure across multiple timeframes: the Source order block where a directional move originates, and the Breaker order block where price confirms that structure has been invalidated. Works on any symbol — forex, metals, indices, crypto, or commodities. What you see on the
    このプロダクトを購入した人は以下も購入しています
    ARIPoint is a powerful trading companion designed to generate high-probability entry signals with dynamic TP/SL/DP levels based on volatility. Built-in performance tracking shows win/loss stats, PP1/PP2 hits, and success rates all updated live. Key Features: Buy/Sell signals with adaptive volatility bands Real-time TP/SL/DP levels based on ATR Built-in MA Filter with optional ATR/StdDev volatility Performance stats panel (Success, Profit/Loss, PP1/PP2) Alerts via popup, sound, push, or email Cu
    このインジケーターを購入された方には、以下の特典を 無料 で提供しています: 各トレードを自動で管理し、ストップロスとテイクプロフィットを設定し、戦略ルールに基づいてポジションを決済する補助ツール 「Bomber Utility」 様々な銘柄に合わせたインジケーターの設定ファイル(セットファイル) 「最小リスク」、「バランスリスク」、「待機戦略」 の3つのモードで使用できる Bomber Utility 用の設定ファイル このトレーディング戦略をすぐに導入・設定・開始できる ステップバイステップのビデオマニュアル ご注意: 上記の特典を受け取るには、MQL5のプライベートメッセージシステムを通じて販売者にご連絡ください。 オリジナルのカスタムインジケーター 「Divergence Bomber(ダイバージェンス・ボンバー)」 をご紹介します。これは、MACDのダイバージェンス(乖離)戦略に基づいた 「オールインワン」型のトレーディングシステム です。 このテクニカルインジケーターの主な目的は、価格とMACDインジケーターの間に発生するダイバージェンスを検出 し、将来の価格の動きを示す
    Entry In The Zone and SMC Multi Timeframe is a real-time 2-in-1 market analysis tool that combines market structure analysis and a No Repaint BUY / SELL signal system into a single indicator, built on Smart Money Concepts (SMC) — a widely adopted framework used by professional traders to understand market structure. This indicator helps you see the market more clearly, make decisions based on structure rather than guesswork, and focus on high-probability zones where price is more likely to react
    Quantum TrendPulse を ご紹介します。これは、   SuperTrend   、   RSI   、および Stochastic のパワーを 1 つの包括的なインジケーターに組み合わせて、取引の可能性を最大限に引き出す究極の取引ツールです。精度と効率を求めるトレーダー向けに設計されたこのインジケーターは、市場のトレンド、勢いの変化、最適なエントリー ポイントとエグジット ポイントを自信を持って特定するのに役立ちます。 主な特徴: SuperTrend 統合: 現在の市場動向に簡単に追従し、収益性の波に乗ることができます。 RSI精度: 買われすぎと売られすぎのレベルを検出し、市場の反転のタイミングに最適で、SuperTrendのフィルターとして使用されます。 確率的精度: 確率的振動を活用して、変動の激しい市場で隠れたチャンスを見つけます。SuperTrend のフィルターとして使用されます。 マルチタイムフレーム分析:   M5 から H1 または H4 まで、さまざまなタイムフレームで市場を常に把握します。 カスタマイズ可能なアラート: カスタム取引条件が満たされ
    このインジケーターを購入すると、プロ仕様のトレードマネージャーを無料で差し上げます。 まず第一に、このトレーディングシステムがノンリペイント、ノンリドロー、ノンラグのインジケーターであることを強調する価値がある。これにより、手動取引とロボット取引の両方に理想的なものになっています。 オンラインコース、マニュアル、プリセットのダウンロード。 「スマートトレンドトレーディングシステム MT5」は、新規および経験豊富なトレーダー向けにカスタマイズされた包括的なトレーディングソリューションです。10以上のプレミアムインジケーターを組み合わせ、7つ以上の堅実なトレーディング戦略を備えており、多様な市場状況に対応する多目的な選択肢となっています。 トレンドフォロー戦略:トレンドを効果的に乗り越えるための正確なエントリーとストップロス管理を提供します。 リバーサル戦略:潜在的なトレンドの反転を特定し、トレーダーがレンジ相場を活用できるようにします。 スキャルピング戦略:高速で正確なデイトレードおよび短期取引のために設計されています。 安定性:すべてのインジケーターはノンリペイント、ノンリドロー、ノ
    Power Candles – あらゆる市場に対応した強度ベースのエントリーシグナル Power Candles は、Stein Investments が長年培ってきた強度分析を価格チャート上に直接反映します。価格だけに反応するのではなく、各ローソク足は実際の市場の強さに基づいて色分けされ、モメンタムの蓄積、強度の加速、明確なトレンド転換を瞬時に把握できます。 すべての市場に共通する単一ロジック Power Candles は すべての取引シンボル で自動的に動作します。現在のシンボルが Forex か非 Forex 市場かを自動判別し、内部で適切な強度モデルを適用します。 Forex および Gold :FX Power のデルタ値を使用(絶対値レンジ最大 100) 指数、暗号資産、CFD :IX Power の強度値を使用(絶対値レンジ最大 50) 必要な強度計算は Power Candles に直接組み込まれています。ローソク足のカラーリングやシグナルロジックに、追加のインジケーターは不要です。 価格ノイズではなく「強度状態」 各ローソク足は、以下の 9 つの明確に定義された強
    Azimuth Pro
    Ottaviano De Cicco
    5 (7)
    Azimuth Pro V2:MT5向けシンセティック・フラクタル構造分析と確認済みエントリー 概要 Azimuth Pro は Merkava Labs によるマルチレベルスイング構造インジケーターです。4つのネストされたスイングレイヤー、スイングアンカーVWAP、ABCパターン検出、3タイムフレーム構造フィルタリング、そして確定バーでの確認済みエントリー — 1つのチャートで、ミクロスイングからマクロサイクルまでを網羅するワークフロー。 これはブラインドシグナル製品ではありません。ロケーション、コンテキスト、タイミングを重視するトレーダーのための構造ファーストワークフローです。 V2発売記念オファー — Azimuth Pro V2をUSD 399で(次の100本)。最終価格:USD 499。 1. V2での変更点 シンセティック・マルチタイムフレームエンジン 上位タイムフレーム分析をMeridian Proと同じ独自のシンセティックアーキテクチャで一から再構築。よりクリーンなHTFコンテキスト、安定したライブ動作、従来のMTF同期問題なし。シンセティックエンジンは 固定比率タ
    Gann Made Easy   は、ミスター・ギャンの理論を使用した取引の最良の原則に基づいた、プロフェッショナルで使いやすい外国為替取引システムです。 W・D・ガン。このインジケーターは、ストップロスとテイクプロフィットレベルを含む正確な買いと売りのシグナルを提供します。 PUSH通知を利用して外出先でも取引可能です。 ご購入後、取引方法の説明と優れた追加インジケーターを無料で入手するには、私にご連絡ください! おそらく、ギャンの取引手法についてはすでに何度も聞いたことがあるでしょう。通常、ギャンの理論は初心者のトレーダーだけでなく、すでにある程度の取引経験がある人にとっても非常に複雑なものです。なぜなら、ギャンの取引手法は理論的にはそれほど簡単に適用できるものではないからです。私はその知識を磨き、最良の原則を私の外国為替インジケーターに組み込むために数年を費やしました。 このインジケーターは非常に簡単に適用できます。必要なのは、それをチャートに添付し、簡単な取引推奨事項に従うだけです。このインジケーターは常に市場分析の仕事を行い、取引の機会を探します。適切なエントリーポイントを検
    FX Trend NG:次世代マルチマーケット・トレンドインテリジェンス 概要 FX Trend NG は、複数の時間足に対応したプロフェッショナル向けトレンド分析およびマーケット監視ツールです。 市場全体の構造を数秒で把握することができます。 複数のチャートを切り替える必要はありません。どの銘柄がトレンド中なのか、どこでモメンタムが弱まっているのか、そしてどの時間足で強い整合性があるのかを瞬時に確認できます。 ローンチ特別オファー – FX Trend NG を $30(6ヶ月) または $80 永久ライセンス でご利用いただけます。 すでに Stein Investments のユーザーですか? -> メッセージを送信 して、プライベートグループへアクセスしてください。 セットアップや詳細情報が必要ですか? -> Stein Investments 公式ページ をご覧ください。 1. FX Trend NG が他と異なる理由 3ステート・トレンドロジック ― Buy と Sell だけではない • 多くのインジケーターは Buy または Sell の2状態のみを表示します。
    SignalTech MT5 is a trading system for EURUSD, USDCHF, USDJPY, AUDUSD, NZDUSD, EURJPY, AUDJPY, NZDJPY, CADJPY H2 and H3 Timeframe.  It can generate signals with Buy/Sell Arrows and Pop-Up/Sound Alerts. Each signal has clear Entry and Stop Loss levels, which should be automatically flagged on the chart, as well as potential Targets 1, 2, and 3. The Entry and TP levels are fixed after the trade is taken. The exit level is dynamic. If there are signs of a potential short-term trend reversal, the
    優れたテクニカルインジケーター「Grabber」をご紹介します。これは、すぐに使える「オールインワン」トレーディング戦略として機能します。 ひとつのコードに、市場のテクニカル分析ツール、取引シグナル(矢印)、アラート機能、プッシュ通知が強力に統合されています。 このインジケーターを購入された方には、以下の特典を無料で提供します: Grabberユーティリティ:オープンポジションを自動で管理するツール ステップバイステップのビデオマニュアル:インジケーターのインストール、設定、取引方法を解説 カスタムセットファイル:インジケーターをすばやく自動設定し、最大限の成果を出すための設定ファイル 他の戦略はもう忘れてください!Grabberだけが、あなたを新たなトレードの高みへと導いてくれるのです。 Grabber戦略の主な特徴: 推奨タイムフレーム:M5〜H4 対応通貨ペア・資産:どれでも使用可能ですが、私が実際に検証した以下を推奨します(GBPUSD、GBPCAD、GBPCHF、AUDCAD、AUDUSD、AUDSGD、AUDCHF、NZDUSD、NZDCAD、EURCAD、EURUSD、E
    マーケットメーカーのためのツール。 Meravith は次の機能を提供します: すべての時間足を分析し、現在有効なトレンドを表示します。 強気と弱気の出来高が等しくなる流動性ゾーン(出来高均衡)を強調表示します。 異なる時間足のすべての流動性レベルをチャート上に直接表示します。 テキスト形式の市場分析を生成し、参考情報として表示します。 現在のトレンドに基づいて目標値、サポートレベル、ストップロスを計算します。 取引のリスクリワード比を算出します。 口座残高に基づいてポジションサイズを計算し、潜在的な利益を推定します。 また、市場に大きな変化があった場合には警告を表示します。 インジケーターの主要ライン: 強気/弱気の出来高エグゾーストライン ― 目標値として機能します。 市場のトレンドを示すライン。市場が強気か弱気かによって色が変わり、トレンドのサポートとして機能します。主にその色が市場センチメントを示します。 出来高均衡ライン(Eq)。Eq(Volume Equilibrium)ラインはシステムの中核です。これは買い手と売り手の出来高のバランスポイントを表します。市場の流動性を示し
    トレンド スクリーナー インジケーターでトレンド取引の力を解き放ちます。ファジー ロジックと複数通貨システムを活用した究極のトレンド取引ソリューションです。 ファジー ロジックを活用した革新的なトレンド インジケーターである Trend Screener を使用して、トレンド取引を向上させます。 これは、13 を超えるプレミアム ツールと機能、および 3 つの取引戦略を組み合わせた強力なトレンド追跡インジケーターであり、Metatrader をトレンド アナライザーにする多用途の選択肢となります。 期間限定オファー : トレンド スクリーナー インジケーターは、わずか 100 ドルで生涯ご利用いただけます。 (元の価格 50$ ) (オファー延長) Trend Screener の 100% 非再描画精度の揺るぎない精度を体験して、取引の決定が過去の価格変動の影響を受けないようにしてください。 マルチタイムフレームおよびマルチ通貨機能の多用途性を解放し、比類のない自信を持って外国為替、商品、暗号通貨、インデックスの世界を取引できるようにします。 Trend Screener の包括的な
    あなたのシンボルでどの戦略が実際に機能するか確認しましょう - リアルマネーをリスクにさらす前に。 Power Barは、あらゆるシンボルとあらゆるタイムフレームで 極端な価格バー を検出し、3つの異なるトレード戦略を即座にバックテストします。勝率、プロフィットファクター、損益を並べて比較できます。すべてが1つのインタラクティブなパネルに集約されています。 推測なし。カーブフィッティングなし。データだけです。 Power Barが特別な理由 ほとんどのインジケーターはシグナルを出すだけで、それが機能するかどうかは推測に任されます。Power Barはさらに先を行きます - すべてのシグナルを 3つの戦略 に対してテストし、統計を表示します。FlipFlop、Momentum、Reversalをワンクリックで切り替え、数値が即座に変化するのを確認できます。 FlipFlop - 常にポジションを保有。シグナルでエントリーし、反対シグナルでイグジット。当社のリサーチでは、US30、US500、DAXなどのトレンドのあるインデックスで最も効果的です。 Momentum - シグナルの方向に
    まず第一に、この取引インジケーターは再描画されず、再描画されず、遅延しないことを強調する価値があります。これにより、手動取引とロボット取引の両方に理想的なものになります。 ユーザーマニュアル:設定、入力、戦略。 アトミックアナリストは、価格の強さとモメンタムを利用して市場でより良いエッジを見つけるためのPA価格アクションインジケーターです。ノイズや誤ったシグナルを除去し、取引ポテンシャルを高めるための高度なフィルターを備えています。複雑なインジケーターの複数のレイヤーを使用して、アトミックアナリストはチャートをスキャンし、複雑な数学的計算をシンプルなシグナルと色に変換します。これにより、どのような初心者トレーダーでも理解して使用し、一貫した取引の決定を行うことができます。 「アトミックアナリスト」は、新規および経験豊富なトレーダー向けにカスタマイズされた包括的な取引ソリューションです。プレミアムインジケーターとトップノッチの機能を1つの取引戦略に組み合わせ、すべてのタイプのトレーダーにとって汎用性のある選択肢にします。 デイリートレーディングとスキャルピング戦略:高速で正確なデイ
    BTMM State Engine Pro is a MetaTrader 5 indicator for traders who use the Beat The Market Maker approach: Asian session context, kill zone timing, level progression, peak formation detection, and a multi-pair scanner from a single chart. It combines cycle state logic with a built-in scanner dashboard so you do not need the same tool on many charts at once. What it does Draws the Asian session range; session times can follow broker server offset or be set in inputs. Tracks level progression (L
    これはMT5のインジケーターで、再描画なしで取引に参入するための正確なシグナルを提供します。 外国為替、暗号通貨、金属、株式、インデックスなど、あらゆる金融資産に適用できます。かなり正確な見積もりを提供し、取引を開始して終了するのに最適な時期を教えてくれます。1つのシグナルを処理しただけでインジケーターの元が取れた例の 動画 (6:22)をご覧ください。Entry PointsPro インジケーターの助けを借りたほとんどのトレーダーの最初の1週間の結果が改善しています。 Telegramグループ に登録してください。Entry Points Proインジケーターのメリットは次の通りです。 再描画のないエントリーシグナル 再描画されるインジケーターでは一度表示されたシグナルが削除されて大きな金銭的損失につながることがありますが、これと異なり、表示されて確認されたシグナルは消えることがありません。 エラーなしの取引開始 インジケーターアルゴリズムによって取引を開始する(資産を売買する)理想的な瞬間を見つけることができます。それを使用するすべてのトレーダーの成功率が向上します。 あら
    ご紹介     Quantum Breakout PRO は 、ブレイクアウト ゾーンの取引方法を変革する画期的な MQL5 インジケーターです。 13年以上の取引経験を持つ経験豊富なトレーダーのチームによって開発されました。     クォンタム ブレイクアウト プロ   は、革新的でダイナミックなブレイクアウト ゾーン戦略により、あなたのトレーディングの旅を新たな高みに押し上げるように設計されています。 クォンタム ブレイクアウト インジケーターは、5 つの利益ターゲット ゾーンを備えたブレイクアウト ゾーン上のシグナル矢印と、ブレイクアウト ボックスに基づいたストップロスの提案を提供します。 初心者トレーダーにもプロのトレーダーにも適しています。 量子EAチャネル:       ここをクリック 重要!購入後、インストールマニュアルを受け取るためにプライベートメッセージを送ってください。 推奨事項: 時間枠: M15 通貨ペア: GBPJPY、EURJPY、USDJPY、NZDUSD、XAUUSD アカウントの種類: ECN、Raw、またはスプレッドが非常に低い R
    FX Power: 通貨の強弱を分析して、より賢い取引を実現 概要 FX Power は主要通貨と金の実際の強弱をあらゆる市場状況で理解するための必須ツールです。強い通貨を買い、弱い通貨を売ることで、 FX Power は取引の意思決定を簡素化し、高い確率の取引機会を見出します。トレンドを追従する場合でも、極端なデルタ値を使用して反転を予測する場合でも、このツールはあなたの取引スタイルに完全に適応します。ただ取引するだけではなく、 FX Power で賢く取引をしましょう。 1. なぜ FX Power がトレーダーにとって非常に有益なのか 通貨と金のリアルタイム強弱分析 • FX Power は主要通貨と金の相対的な強弱を計算し、マーケットダイナミクスに関する明確な洞察を提供します。 • どの資産がリードしているか、または後れを取っているかを監視して、取引するペアを賢く選びましょう。 マルチタイムフレームの包括的なビュー • 短期、中期、長期のタイムフレームで通貨と金の強弱を追跡し、マーケットトレンドに基づいて取引戦略を調整できます。 • スキャルピングからスイングトレード
    OmniSync Projection
    Antonio-alin Teculescu
    5 (1)
    Chronos Fractal Engine is an innovative price projection indicator for MetaTrader 5, designed to transform your technical analysis by intelligently identifying and projecting historical price patterns. Built upon an advanced correlation algorithm and the fractal principles of the market, this powerful tool visualizes potential future price movements, giving you a unique edge in your trading decisions. What is Chronos Fractal Engine? At its core, the Chronos Fractal Engine employs a sophisticat
    Bill Williams Advanced is designed for automatic chart analysis using Bill Williams' "Profitunity" system. The indicator analyzes four timeframes at once. Manual (Be sure to read before purchasing) Advantages 1. Analyzes the chart using Bill Williams' "Profitunity" system. Signals are displayed in a table in the corner of the screen and on the price chart. 2. Finds all known AO and AC signals, as well as zone signals. Equipped with a trend filter based on the Alligator. 3. Finds "Divergence Bar
    Berma Bands
    Muhammad Elbermawi
    5 (8)
    Berma Bands (BBs) インジケーターは、市場のトレンドを特定して活用したいトレーダーにとって貴重なツールです。価格と BBs の関係を分析することで、トレーダーは市場がトレンド段階にあるか、レンジ段階にあるかを判断できます。 詳細については、[ Berma Home Blog ] をご覧ください。 バーマ バンドは、上部バーマ バンド、中部バーマ バンド、下部バーマ バンドの 3 つの異なる線で構成されています。これらの線は価格の周りにプロットされ、全体的な傾向に対する価格の動きを視覚的に表します。これらのバンド間の距離から、ボラティリティや潜在的な傾向の反転についての洞察を得ることができます。 バーマ バンドの線がそれぞれ離れると、市場が横ばいまたはレンジ相場の期間に入っていることを示すことがよくあります。これは、明確な方向性の偏りがないことを示しています。トレーダーは、これらの期間中にトレンドを特定するのが難しいと感じる可能性があり、より明確なトレンドが出現するまで待つ場合があります。 バーマ バンドの線が 1 本の線に収束すると、強いトレンド環境の兆候となること
    Crystal Heikin Ashi Signals - Professional Trend & Signal Detection Indicator Advanced Heikin Ashi Visualization with Intelligent Signal System for Manual & Automated Trading Final Price: $149 ---------> Price goes up $10 after every 10 sales . Limited slots available — act fast . Overview Crystal Heikin Ashi Signals is a professional-grade MetaTrader 5 indicator that combines pure Heikin Ashi candle visualization with an advanced momentum-shift detection system. Designed for both manual traders
    Market Structure Order Block Dashboard MT5 は、市場構造と主要な価格反応ゾーンをチャート上で直接読み取りたいトレーダー向けに設計された MT5 インジケーターです。BOS、ChoCH、オーダーブロック、Fair Value Gap (FVG)、流動性、Kill Zones、Volume Profile、そして素早い分析のためのコンパクトなダッシュボードを組み合わせています。 本インジケーターは、市場構造、ICT、Smart Money の概念を意思決定の枠組みとして使用するトレーダーを対象としています。トレンド継続、反転の可能性、価格の不均衡、流動性ターゲット、注目ゾーンをより構造的に特定する助けとなります。 購入者向けの付属リソース 購入後、MQL5 のプライベートメッセージにてご依頼いただくと、完全な PDF ユーザーガイドとパラメータ設定のヒントを提供いたします。MQL5 のプライベートメッセージによる直接的な技術サポート。 バージョン 1.20 では 2 つの重要な追加機能があります: Pending BOS / Pending Cho
    Auto Optimized Parabolic RSI: 高度な3Dモメンタムエンジン ほとんどのリテール向けインジケーターは、市場のボラティリティが変化した瞬間に破綻する静的な入力値に依存しているため、失敗に終わります。Auto Optimized Parabolic RSIは、自らの数学的優位性を継続的に再計算することで「インジケーターの陳腐化」問題を解決し、機関投資家レベルの定量的適応力をMT5ターミナルに直接もたらします。 最大の強み: カスタムインメモリ3D最適化 標準的な自動最適化ツールは、インジケーターの呼び出しで端末に過負荷をかけるため、頻繁にMT5プラットフォームをフリーズさせます。本ツールは、このボトルネックを完全に回避しています。RAMベースのカスタムネイティブ計算機を内蔵した内部エンジンは、チャートを読み込んだりタイムフレームを変更したりするたびに、超高速の3Dグリッド探索を実行します。RSI期間(頻度)、SARステップ(加速度)、SAR最大値(制限速度)を同時にスイープし、プラットフォームを遅延させることなく、数万通りものパラメーターの組み合わせを絶対的なミ
    Meridian Pro
    Ottaviano De Cicco
    5 (1)
    Meridian Pro:MT5用プロフェッショナル・マルチタイムフレーム・トレンドマトリックス 概要 Meridian Pro は Merkava Labs が開発したマルチタイムフレーム・トレンドマトリックスで、方向性の状態、強度、モメンタムの状況、マトリックスの合意をひとつのコンパクトなパネルに集約します。ひとつのアダプティブエンジンがM1からW1まで一貫して適用されます。シンボルごとの調整は不要。インジケーターの積み重ねも不要。すべてのアセットとすべてのタイムフレームをカバーするひとつの構造化された読み取りです。 発売キャンペーン — Meridian Proを USD 99 (導入価格)で入手。通常価格:USD 149 。 1. Meridian Proが他と異なる理由 ひとつのエンジン、バラバラなインジケーターのダッシュボードではない 多くのMTFダッシュボードは、タイムフレームごとに生のインジケーター値を繰り返すだけです。Meridian Proはマトリックス全体でひとつのアダプティブ・トレンドエンジンを使用するため、パネルの各行が同じ構造化フレームワークから導出されます
    FX Volume MT5
    Daniel Stein
    4.79 (24)
    FX Volume:ブローカー視点で捉える本物の市場センチメント クイック概要 トレード手法をさらに高めたいとお考えですか? FX Volume は、リテールトレーダーやブローカーのポジション状況をリアルタイムで提供します。これは、COTのような遅延レポートよりもはるかに早く知ることができます。安定した利益を目指す方も、さらなる優位性を求める方も、 FX Volume は大きな不均衡を見極め、ブレイクアウトを確認し、リスク管理を洗練させるのに役立ちます。今すぐ始めて、実際の出来高データがどのように意思決定を変革するかを体感してください! 1. FX Volume がトレーダーにとって非常に有益な理由 高精度の早期警戒シグナル • 各通貨ペアを売買しているトレーダー数を、他者よりも早く、ほぼリアルタイムで把握できます。 • FX Volume は、複数のリテールブローカーから得られる本物の出来高データを収集し、分かりやすい形式で提供する 唯一 のツールです。 強力なリスク管理 • ロングやショートの大きな偏り(インバランス)を特定し、潜在的なトレンド転換を見逃しません。ストップ
    Trend Ai indicatorは、トレンドの識別と実用的なエントリポイントと反転アラートを組み合わせることで、トレーダーの市場分析を強化する優れたツールです。 この指標は、ユーザーが自信と正確さで外国為替市場の複雑さをナビゲートすることを可能にします トレンドAiインジケーターは、主要なシグナル以外にも、プルバックやリトレースメント中に発生するセカンダリエントリポイントを識別し、トレーダーが確立されたトレンド内の価格修正を活用できるようにします。 重要な利点: *MT4およびMT5の仕事 *明確な買いまたは売りシグナル *再描画しません ·すべての資産で動作します 私はeaやセットをtelegram it詐欺で販売しないように注意してください。 すべての設定はここでブログで無料です。  重要! 指示とボーナスを得るために購入後すぐに私に連絡してください! 私の他のプロダクトと同様、実質操作の監視はここに見つけることができます: https://www.mql5.com/en/users/mechanic/seller&nbsp ; 設定および入力: すべての
    Gannスクエアインジケーターは、W.D. Gannによって執筆された「市場予測のための数学的な式」の記事に基づく強力な市場分析ツールです。このツールは、解析に数学的な概念を応用し、Gann理論に基づいています。それは、144、90、52のスクエアや9のスクエアなど、Gannの関連テクニックの要素を取り入れています。さらに、の方法を組み込んでおり、9のスクエアとその関連性についてのチャネルやスターパターンに焦点を当てています。 ユーザーマニュアルと使用方法: このインジケーターを使用する前に、ユーザーマニュアルを読んで疑問点を解決するためにお問い合わせいただくことをお勧めします。ユーザーマニュアルの完全版は、当社のウェブサイトで入手できます。 MT5の完全版は購入できますし、MT4の無料版も試すことができます。両方のバージョンへのリンクを提供していますので、ご利用ください。 主な機能と機能: Gannスクエアインジケーターは、市場分析のための完全なツールセットを提供し、幾何学的な概念とGann理論に基づいて的確な判断を行う手助けをします。以下に主な機能を示します。 9のスクエアの分析:
    Cvd Divergence
    Thalles Nascimento De Carvalho
    CVD Divergence ― オーダーフローとダイバージェンスのプロフェッショナル分析 CVD Divergence は、価格と Cumulative Delta Volume(CVD)との間に発生する信頼性の高いダイバージェンスを検出するために開発されたテクニカル指標です。実際の注文フローが価格の動きを確認していない局面を正確に捉え、反転、勢いの減衰、そして機関投資家による操作の可能性を示します。 このインジケーターは、アグレッシブボリュームの読み取りと価格構造の分析を組み合わせ、明確で客観的かつ先行性のあるシグナルを提供します。 インジケーターの機能 CVD Divergence は、累積デルタボリュームを用いて注文フローの方向と価格の方向を比較します。両者が大きく乖離した際、チャート上にマーカーを表示し、ダイバージェンスの方向を視覚的に示します。 検出できる内容: 強気ダイバージェンス(価格が下落しているが CVD が上昇している場合) 弱気ダイバージェンス(価格が上昇しているが CVD が下降している場合) 買い手・売り手の勢いの枯渇 機関投資家の不均衡によるフェイクムーブ
    作者のその他のプロダクト
    - Real price is 80$ - 40% Discount (It is 49$ now) Contact me for instruction, add group and any questions! - Non-repaint - I just sell my products in Elif Kaya profile, any other websites are stolen old versions, So no any new updates or support. - Lifetime update free Related product:   Bitcoin Expert Introduction The breakout and retest strategy is traded support and resistance levels. it involves price breaking through a previous level.  The break and retest strategy is designed to help tr
    - Real price is 100$ - 50% Discount (It is 49$ now) -   It is enabled for 2 purchases. Contact me for extra bonus (Gann Trend   indicator), instruction or any questions! - Non-repaint, No lag - I just sell my products in Elif Kaya Profile, any other websites are stolen old versions, So no any new updates or support. - Lifetime update free Gann Gold EA MT5 Introduction W.D. Gann’s theories in technical analysis have fascinated traders for decades. It offers a unique approach beyond traditional c
    - Final real price is 999$ - Discount and price is 99$ (Next price is 200$),  Price will be increased after 2 purchases. Welcome, Gold GANN Expert opens automatically trade with Highly profit, Fixed small Stop loss. After purchase, You will receive one more EA for Free! Contact me for this BONUS! (BUY 1, GET 1 FREE) - Lifetime update free No Martingale, No Grid, No Scam I am focused on help my clients, not just earn. The Gann Gold EA is High safety by small fix Stop Loss, which set
    - Real price is 300$ - Limited Discount (It is 49$) -  Only 2 purchase is 49$. - Lifetime update free Welcome, Bitcoin Expert opens automatically trade with Highly profit, Fixed Stop loss. No Martingale, No Grid, No Scam Bitcoin is a cryptocurrency, a peer-to-peer digital currency that operates independently of a central governing authority . Bitcoin enables direct transactions between users, secured by cryptographic technology and recorded on a transparent and immutable ledger   without centra
    - Final real price is 999$ - Discount and price is 99$ (Next price is 200$),  Price will be increased after 2 purchases. Welcome, Gold GANN Expert opens automatically trade with Highly profit, Fixed small Stop loss. After purchase, You will receive one more EA for Free! Contact me for this BONUS! (BUY 1, GET 1 FREE) - Lifetime update free No Martingale, No Grid, No Scam I am focused on help my clients, not just earn. The Gann Gold EA is High safety by small fix Stop Loss, which s
    - Real price is 100$ - 50% Discount (It is 49$ now) -   It is enabled for 2 purchases. Contact me for extra bonus (Gann Trend indicator), instruction or any questions! - Non-repaint, No lag - I just sell my products in Elif Kaya Profile, any other websites are stolen old versions, So no any new updates or support. - Lifetime update free Gann Gold EA MT5 Introduction W.D. Gann’s theories in technical analysis have fascinated traders for decades. It offers a unique approach beyond traditional cha
    It is FREE on EURUSD chart. All Symbols version! Contact me for any questions Introduction The breakout and retest strategy is traded support and resistance levels. it involves price breaking through a previous level.  The   break and retest   strategy is designed to help traders do two main things, the first is to avoid false breakouts. Many false breakouts start with a candlestick that breaks out of a level but ends with an immediate candlestick that brings the price back into the level. The
    FREE
    - Real price is 70$ - 50% Discount (It is 35$ now) Contact me for instruction, any questions! - Lifetime update free - Non-repaint - I just sell my products in Elif Kaya Profile, any other websites are stolen old versions, So no any new updates or support. Introduction Breakout Trend Scanner indicator works based on the Elliott Wave in technical analysis describes price movements in the financial market that are related to changes in trader sentiment and psychology and finds end of movement and
    Contact me for instruction, any questions! - Lifetime update free - Non-repaint - I just sell my products in Elif Kaya Profile, any other websites are stolen old versions, So no any new updates or support. Introduction Breakout Trend Scanner indicator works based on the Elliott Wave in technical analysis describes price movements in the financial market that are related to changes in trader sentiment and psychology and finds end of movement and breakout trend. The Elliott Wave pattern that is f
    - Real price is 80$ - 40% Discount (It is 49$ now) Contact me for instruction, any questions! - Non-repaint - I just sell my products in Elif Kaya Profile, any other websites are stolen old versions, So no any new updates or support. - Lifetime update free Related product: Bitcoin Expert Introduction The Breakout and Retest strategy is traded support and resistance levels. it involves price breaking through a previous level.  The break and retest strategy is designed to help traders do two main
    Contact me for instruction, any questions! Introduction Chart patterns   are an essential tool traders and investors use to analyze the future price movements of securities. One such pattern is the triple bottom or the triple top pattern, which can provide valuable insights into potential price reversals. This pattern forms when a security reaches a low   price level   three times before reversing upward or reaches a high price level three times before reversing downward.   Triple Top Bottom P
    - Real price is 80$ - 40% Discount (It is 49$ now)   Contact me for instruction, any questions! Related Product:  Gold Trade Expert MT5  ,  Professor EA - Non-repaint - Lifetime update free I just sell my products in   Elif Kaya Profile , any other websites are stolen old versions, So no any new updates or support. Introduction Flag patterns are an important tool for technical traders. Flags are generally considered to be a period of consolidation where the price of a security is caught in a r
    -   Real price is 80$   - 50% Discount ( It is 39$ now ) Contact me for instruction, any questions! Related Product:  Gold Expert  ,  Professor EA - Non-repaint - Lifetime update free I just sell my products in Elif Kaya Profile, any other websites are stolen old versions, So no any new updates or support. Introduction Flag patterns are an important tool for technical traders. Flags are generally considered to be a period of consolidation where the price of a security is caught in a range afte
    -   Real price is 60$   - 50% Discount ( It is 30$ now ) Contact me for instruction, any questions! Introduction Triangle chart patterns are used in   technical analysis , which is a trading strategy that involves charts and patterns that help traders identify trends in the market to make predictions about future performance.   Triangle Pattern Scanner Indicator It is usually difficult for a trader to recognize classic patterns on a chart, as well as searching for dozens of charts and time f
    -   Real price is 90$   - 50% Discount ( It is 45$ now ) Contact me for instruction, any questions! Introduction V Bottoms and Tops (or Fibonacci Retracement) are popular   chart patterns   among traders due to their potential for identifying trend reversals. These patterns are characterized by sharp and sudden price movements, creating a V-shaped or inverted V-shaped formation on the   chart . By recognizing these patterns, traders can anticipate potential shifts in market direction and posi
    -   Real price is 1000$   - Limited Discount (It is now 299$) Welcome, Professor Expert opens   automatically   trade with Highly profit, Fixed Stop loss. After purchase, You can receive  Bitcoin Expert  or  Gold Trade Expert  for  Free ! Contact me for this  BONUS ! No Martingale, No Grid, No Scam Strategy Tester is not covered critical news. The most popular forex markets is the EUR/USD pair, which connects two of the world's biggest economies. The euro and U.S. dollar (EUR/USD) major currenc
    -   Real price is 1000$   - Limited Discount (It is now 199$) Welcome, Gold Trade Expert opens automatically trade with Highly profit, Fixed Stop loss. No Martingale, No Grid, No Scam Strategy Tester can't filter critical news. Gold price is widely followed in financial markets around the world. Gold was the basis of economic capitalism for hundreds of years until the repeal of the Gold standard, which led to the expansion of a flat currency system in which paper money doesn't have an implied b
    - Real price is 80$ - 60% Discount (It is 30$ now) -   It is enabled for 1 purchase. Contact me for extra   bonus   tool, instruction or any questions! - Non-repaint, No lag - I just sell my products in Elif Kaya Profile, any other websites are stolen old versions, So no any new updates or support. - Lifetime update free Introduction Smart Money Concepts (SMC) strategy was initially popularized the Inner Circle Trading (ICT) method which is claimed to be the evolved version of the SMC.  Essenti
    Contact me for instruction, any questions! Introduction V Bottoms and Tops  (or Fibonacci Retracement)  are popular   chart patterns   among traders due to their potential for identifying trend reversals. These patterns are characterized by sharp and sudden price movements, creating a V-shaped or inverted V-shaped formation on the   chart . By recognizing these patterns, traders can anticipate potential shifts in market direction and position themselves accordingly.  V pattern is a powerful bul
    - Real price is 1000$ - Limited Discount (It is now 199$) Welcome, Gold Trade Expert opens automatically trade with Highly profit, Fixed Stop loss. No Martingale, No Grid, No Scam Strategy Tester can't filter critical news. Gold price is widely followed in financial markets around the world. Gold was the basis of economic capitalism for hundreds of years until the repeal of the Gold standard, which led to the expansion of a flat currency system in which paper money doesn't have an implied backi
    フィルタ:
    leduan199x
    44
    leduan199x 2026.01.23 14:06 
     

    áp dụng tốt và tôi đăng sử dụng nó

    Sivakashi
    345
    Sivakashi 2025.10.13 16:20 
     

    A reliable indicator backed by reliable support—I highly recommend this to any serious M1 scalper!

    Bob0511
    632
    Bob0511 2025.10.06 14:37 
     

    This is a great indicator. I use it with a few other things and it has been the perfect addition to my current trading system. It also has excellent customer support. Author responds very quickly and will answer any questions. I highly recommend.

    Joan Carlos Rosario Nunez
    499
    Joan Carlos Rosario Nunez 2025.10.04 19:12 
     

    ⭐️⭐️⭐️⭐️⭐️ M1 Scalper Pro MT5 es una herramienta excelente para scalping en M1: fácil de configurar, señales claras y ejecución rápida. Me ha dado entradas consistentes cuando se usa con buena gestión de riesgo y disciplina. Se nota estable y bien mantenido por el autor. Lo recomiendo al 100%.

    Elif Kaya
    19085
    開発者からの返信 Elif Kaya 2025.10.05 05:46
    English: ⭐️⭐️⭐️⭐️⭐️ M1 Scalper Pro MT5 is an excellent tool for scalping on M1: easy to set up, clear signals, and fast execution. It has given me consistent entries when used with good risk management and discipline. It seems stable and well maintained by the author. I recommend it 100%.
    Mercier Guillaume Patrick
    750
    Mercier Guillaume Patrick 2025.09.10 06:11 
     

    Very nice one, and support very fast.

    Hassan
    105
    Hassan 2025.08.25 14:02 
     

    If there was a rating over 5 start I would give it to Elif without any hesitation. My high rating came for 2 main reasons; the quality of the products and the support I am getting. She always answers my question. She always provides full support. If you want great results with this scalper just use higher time frame alignment and boom! You will get good results. Follow the bias of 1hr or 30m timeframes and pray for me ;) I am still testing the product to find the best rules that work with me but it already paid back it's amount. Amazing customer service. Amazing product.

    Forest37030129
    19
    Forest37030129 2025.08.11 12:05 
     

    This is a good indicator for scalping. It is easy to use. it has TP and also SL.

    K Hidaka
    115
    K Hidaka 2025.05.22 13:08 
     

    good indicator. This software gives us a great opportunity. However, it is one decision to make regarding each alert. It is a great hint for your own trading strategy.

    Aravind Kolanupaka
    10069
    Aravind Kolanupaka 2025.05.13 16:17 
     

    Good scalp signals

    MeHmEt Akİf
    29
    MeHmEt Akİf 2025.04.21 08:30 
     

    Good indicator from author

    squidme
    801
    squidme 2025.04.12 04:54 
     

    No recommended because of excessive drawdown

    レビューに返信