Smart Liquidity Profile
- インディケータ
-
Suvashish Halder
 💧 PRO TIP - Don't Open Orders Where You See, Open Them Where Others Can't!
📈 Decoding Market Phases Like Never Before – The SuvashishFx Revolution! - バージョン: 2.0
- アップデート済み: 13 8月 2024
- アクティベーション: 7
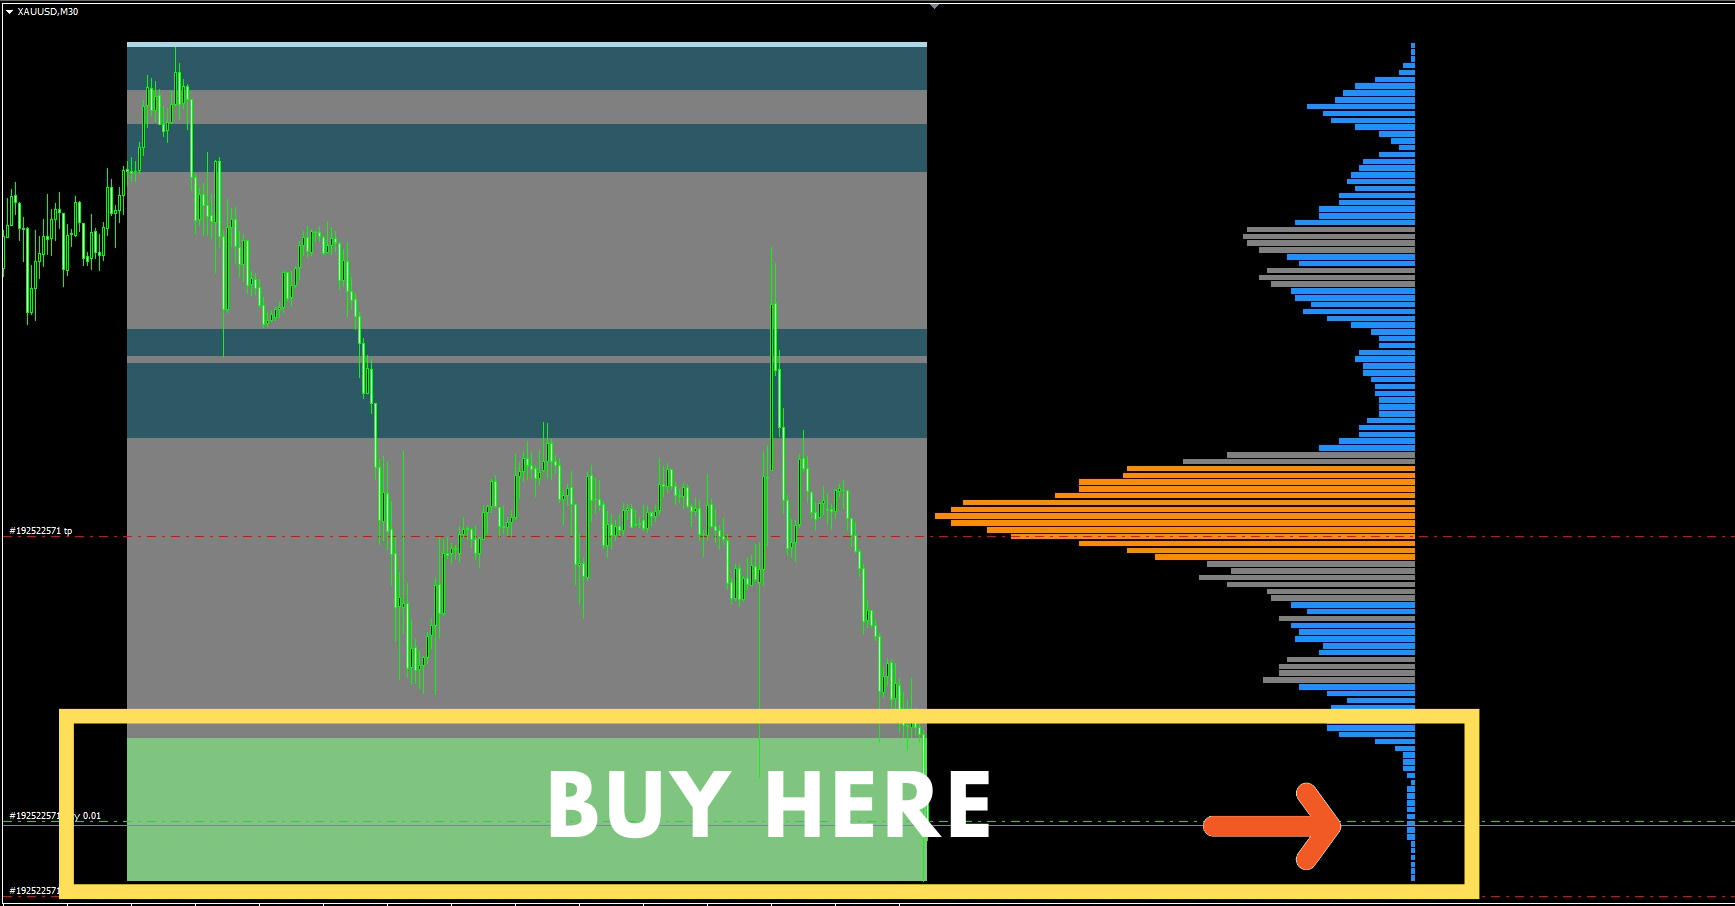
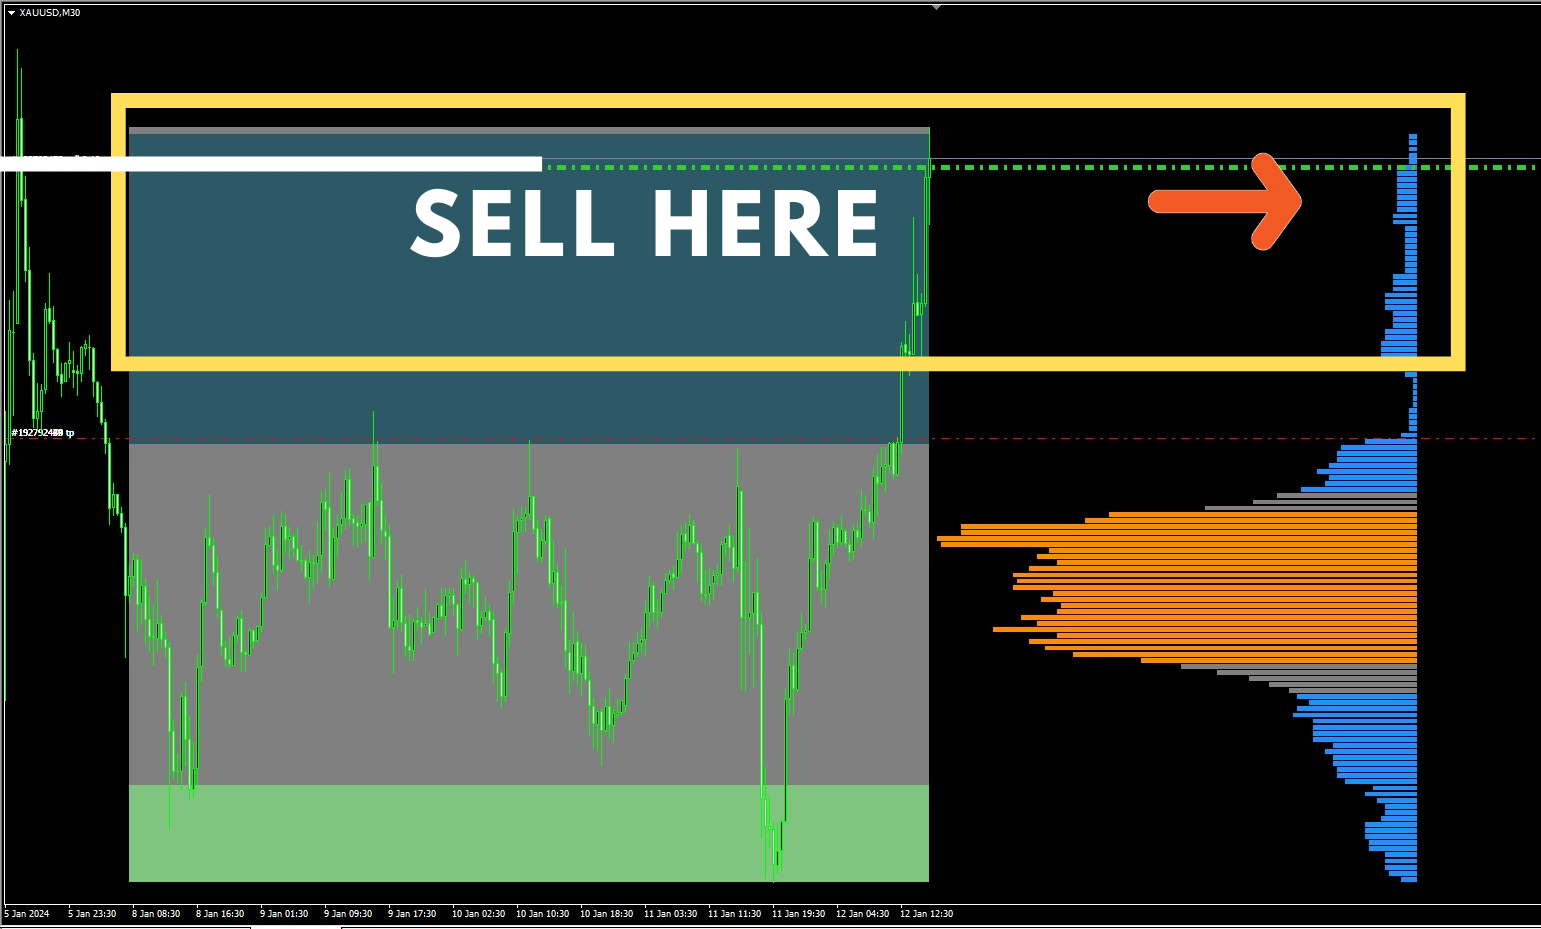
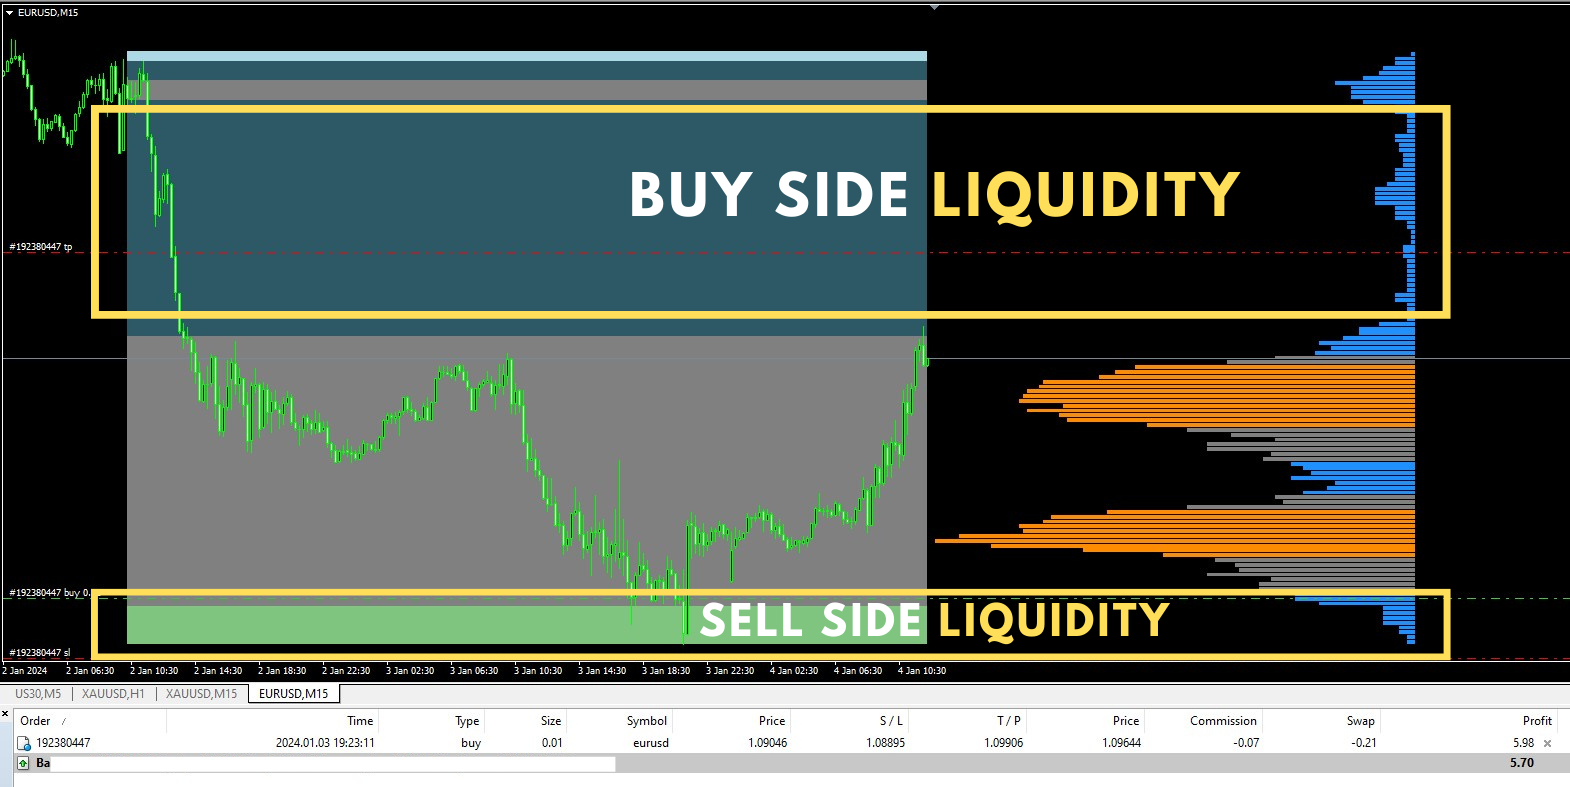
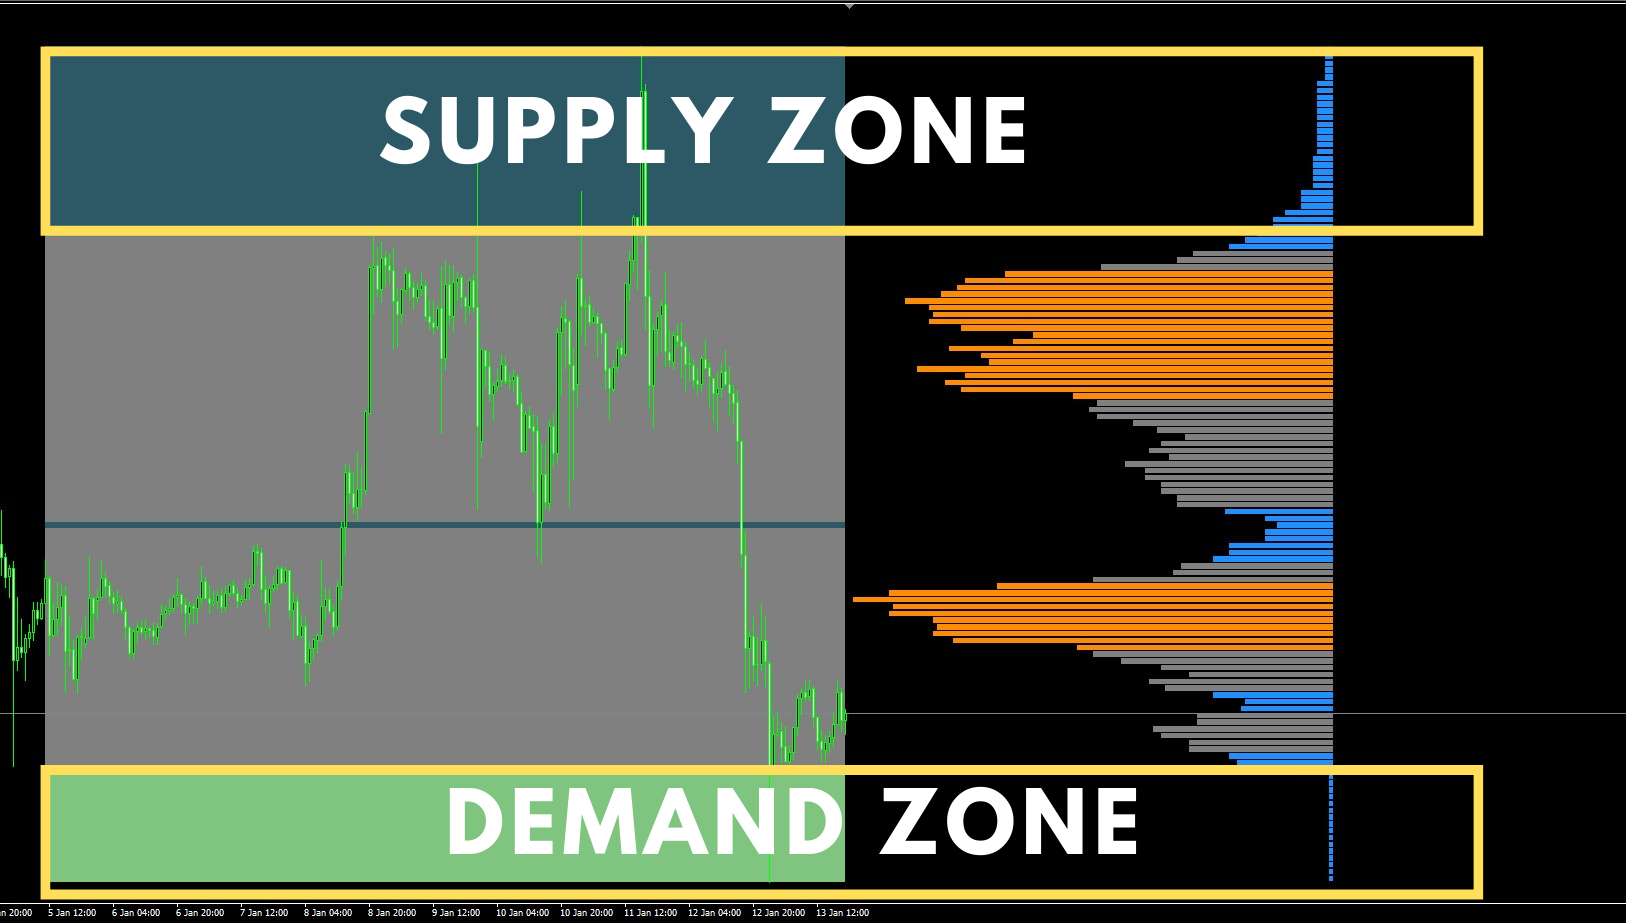
The Smart Liquidity Profile is color-coded based on the importance of the traded activity at specific price levels, allowing traders to identify significant price levels such as support and resistance levels, supply and demand zones, liquidity gaps, consolidation zones, Buy-Side/Sell-Side Liquidity and so on. Smart Liquidity Profile allows users to choose from a number of different time periods including 'Auto,' 'Fixed Range,' 'Swing High,' 'Swing Low,' 'Session,' 'Day,' 'Week,' 'Month,' 'Quarter,' and 'Year'.
Smart Liquidity Profile will show where retail traders are trading as well as where institutions are most likely opening positions. However, please avoid trading during news releases.
MT5 Version - https://www.mql5.com/en/market/product/109841
Also shows the changes in the price levels with the most traded activity (POC Level).
Liquidity Zones - Shows Liquidity Levels, commonly known as Supply and Demand Zones.
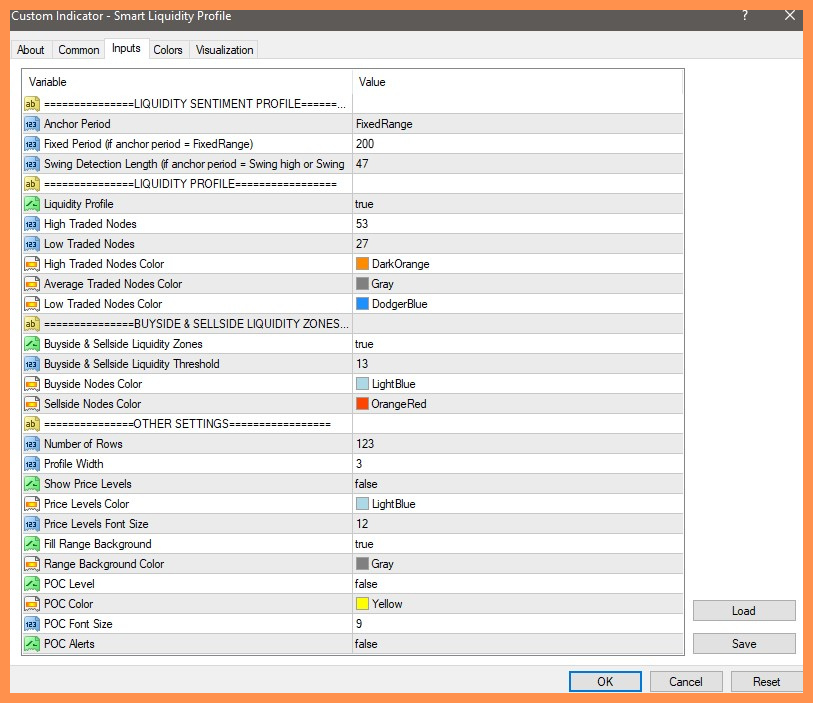
Liquidity Profile Inputs:
- Liquidity Profile: True/False (Visibility of the Liquidity Profiles)
- High Traded Nodes: Color option for High Traded Nodes
- Average Traded Nodes: Color option for Average Traded Nodes
- Low Traded Nodes: Color option for Low Traded Nodes
Buy-side & Sell-side Liquidity Zones:
- Buy-side & Sell-side Liquidity Zones: True/False (Visibility of the Liquidity Levels)
- Buy-side Liquidity Nodes: Color option for Buyside Liquidity Nodes
- Sell-side Liquidity Nodes: Color option for Sell-side Liquidity Nodes
Other Settings:
- Number of Rows: Specify how many rows each profile histogram will have.
- Profile Width: Width of the rows in the histogram.
- Price Levels: Highest/Lowest of the profile price.
- Visibility of the Profiles Range and Color.
Please do not hesitate to contact me if you have any problems, but please avoid using too many indicators in a single chart.


Fantastic Indicator