True Order Blocks

5

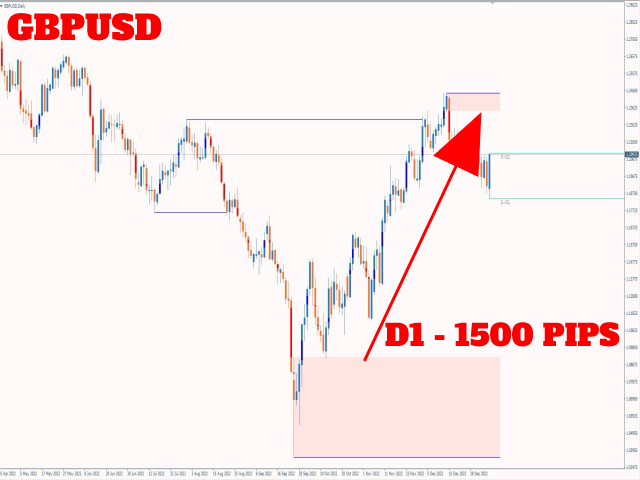
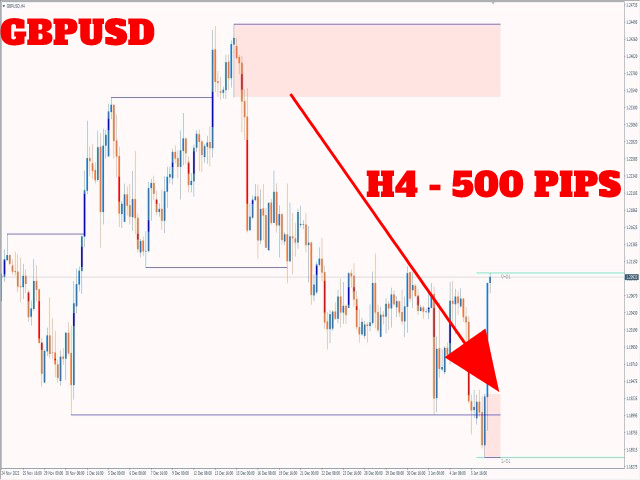
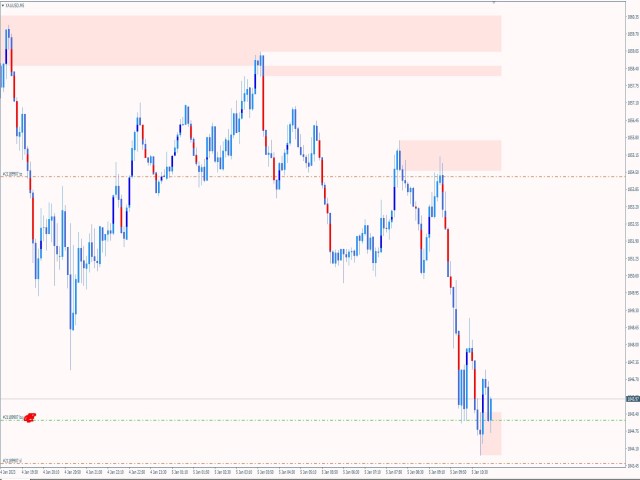
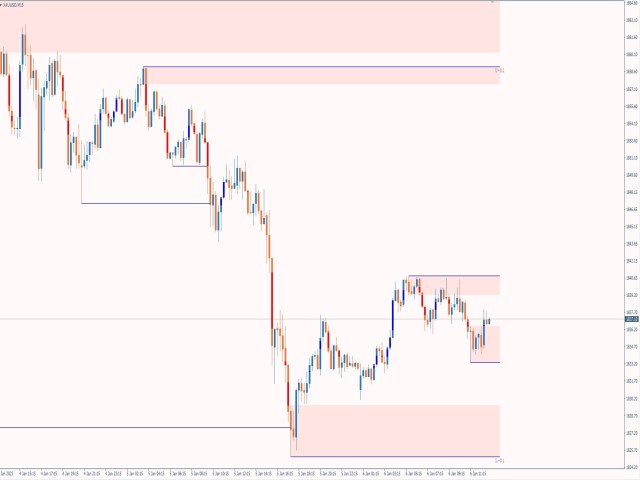
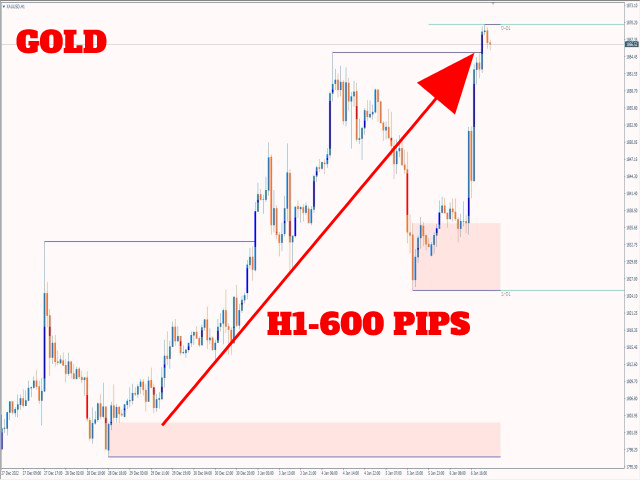
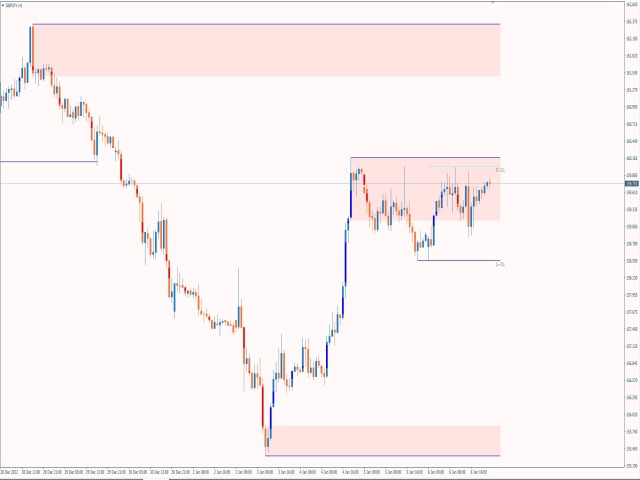
True Order Blocks is an excellent indicator for day traders, swing traders, and even scalpers. It is combined with multiple market-moving strategies.

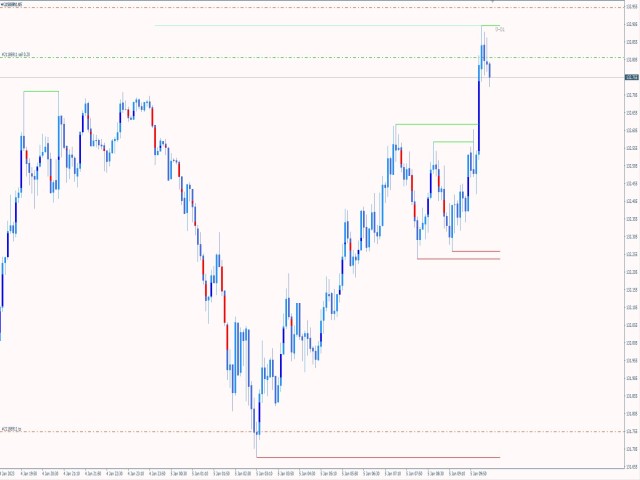
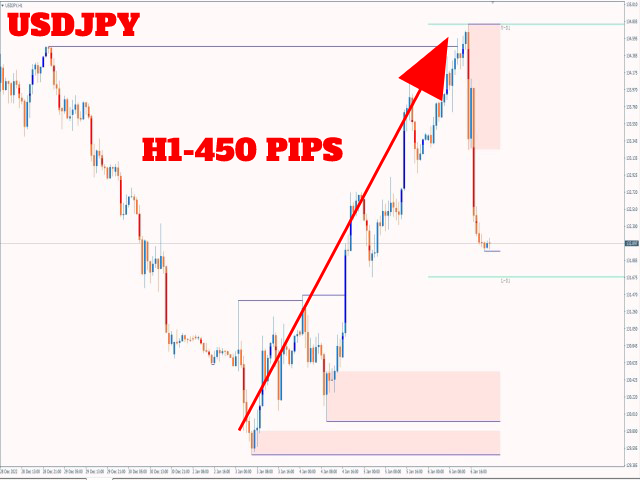
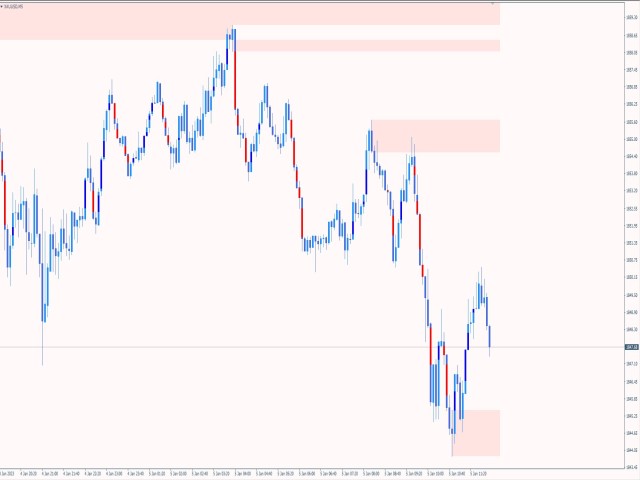
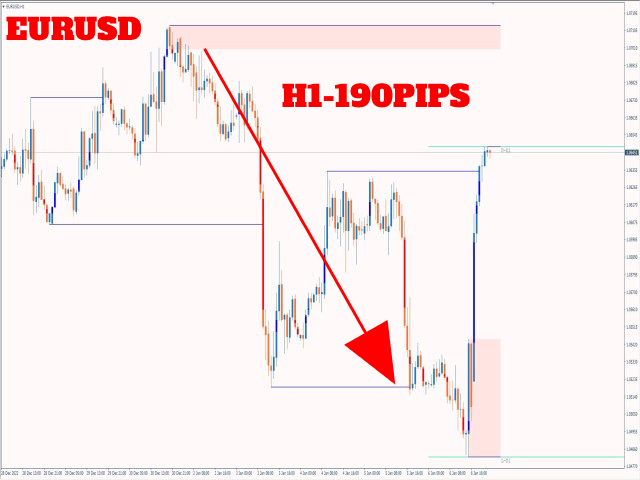
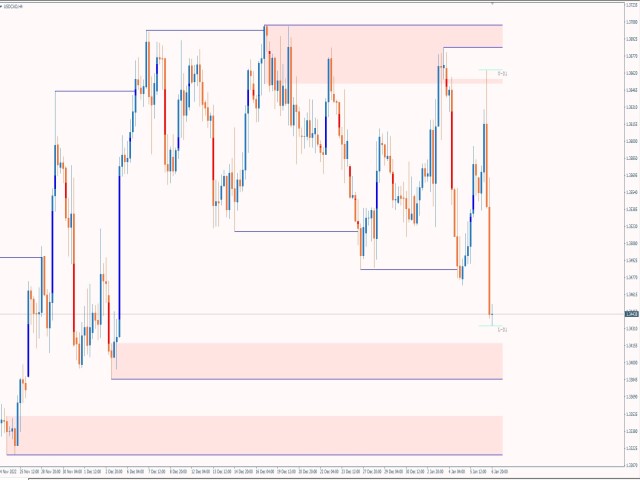
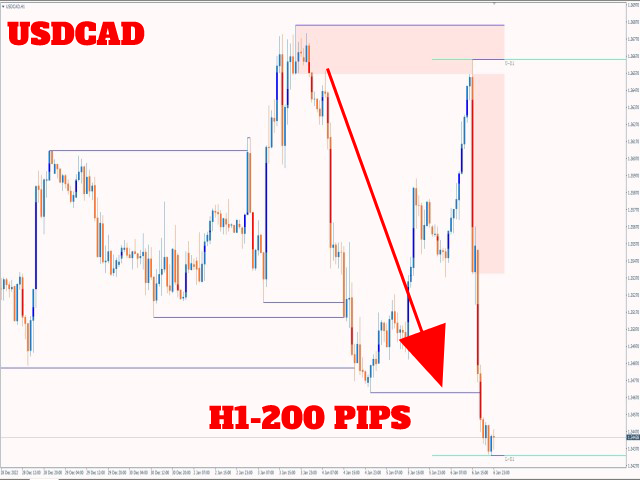
It identifies market structure, marks supply and demand zones, displays imbalance moves, structure break, trendline breakout, and much more.

True order blocks are compatible with forex, stocks, cryptocurrency, and any market with any timeframe.

And I'll show you how to use this tool in your day-to-day trading life.

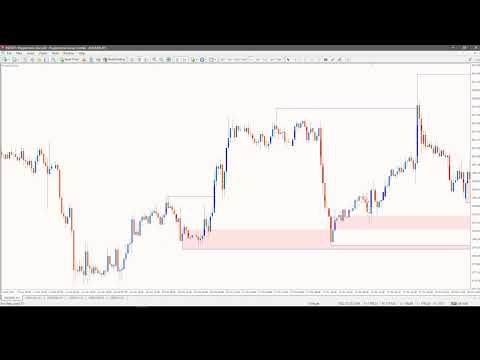
Please watch the video to learn how it works.

It will not provide you with Buy/Sell signals, which is extremely detrimental to your trading journey.


True Order Blocks assist you in identifying the market, after which you must deal with your own analysis.

TOB Features :

  • Order Blocks
  • Candle Close Time Remaining
  • Imbalance
  • Break of Structure
  • High/Low
  • Trendline
  • Take Profit Projections

[+] ALERT SETTINGS

I make alert options for each section and provide very user-friendly input. I've added a pop-up alert, email notifications, and push notifications.

  • Support & resistance zone Alert
  • Support & resistance breakout Alert
  • BOS/CHOCH Alert
  • Daily High/Low Breakout Alert
  • Trendline Breakout Alert

And please contact me immediately if you see any errors. I'll fix it asap. Thanks for your support.


レビュー 3
Juan Feliciano
1731
Juan Feliciano 2023.01.23 20:27 
 

Really good indicator. Great customer service

MrShuvo
31
MrShuvo 2023.01.17 17:25 
 

A Perfect Indicator. Excellent support.

おすすめのプロダクト
Super Reversal Pattern Indicator Unlock the power of advanced pattern recognition with our Super Reversal Pattern Indicator. Designed for traders seeking precision and reliability, this indicator identifies one of the most effective reversal patterns in technical analysis, offering a significant edge in your trading strategy. Key Features: Non-Repainting Accuracy: Enjoy the confidence of non-repainting technology. Once a Super Reversal Pattern is detected, it remains static, providing consiste
The new update makes this indicator a complete tool for studying, analyzing and operating probabilistic patterns. It includes: On-chart Multi-asset percentage monitor. Configurable martingales. Twenty-one pre-configured patterns , including Mhi patterns and C3. An advanced pattern editor to store up to 5 custom patterns. Backtest mode to test results with loss reports. Trend filter. Hit operational filter. Martingale Cycles option. Various types of strategies and alerts. Confluence between patte
Order Block Tracker is here to solve one of the biggest challenges traders face: identifying order blocks. Many traders fail to spot these critical zones, often missing out on key market entries. But with Order Block Tracker , you no longer have to worry about that. This advanced indicator automatically highlights these crucial zones for you, giving you the confidence to enter the market at the right time. MT5 Version -  https://www.mql5.com/en/market/product/123362/ Key Features of Order Block
The Auto Fibonacci Indicator is a professional technical analysis tool that automatically draws Fibonacci retracement levels based on the most recent closed Daily (D1) or 4-Hour (H4) candle. These levels are widely used by traders to identify key support , resistance , and trend reversal zones . This version is designed for manual trading and supports a powerful trading strategy using Fibonacci levels combined with a 50-period EMA (Exponential Moving Average) , which you can easily add from MT4
FREE
We do not want to make you confused with an imaginary high profit screenshot from Strategy Tester which has no relation/guarantee of future profit! We just want to tell you the real thing about our EA. TrendEx Pro has been developed to trade on Gold specially, combining multiple strategies algorithm to ensure Trend catching and trading on. It can identify both short and long trends and opens positions accordingly with excellent built-in risk management logic. There is no use of any dangerous met
Trend PRO Expert Advisor  is developed base on the PipFinite Trend PRO Indicator, the best indicators on the market so far. PipFinite  Trend Pro's smart algorithm detects the trend, filters out market noise and gives entry signals with exit levels.  This EA open order when the indicator has buy/sell signals and set SL/TP follow the indicator rules. You can read more information about PipFinite Trend PRO indicator  here . Important Information   This EA will only work if you purchased  PipFinte
「ダイナミック・スキャルピング・オシレーター」は、MT4向けの高度なカスタムCrypto_Forexインジケーターです。効率的な取引ツールです! - 新世代のオシレーター - 使い方は画像をご覧ください。 - ダイナミック・スキャルピング・オシレーターは、適応型の売られ過ぎ/買われ過ぎゾーンを備えています。 - オシレーターは、動的な売られ過ぎ/買われ過ぎエリアから正確なエントリーポイントを見つけるための補助ツールです。 - 売られ過ぎ値:グリーンラインより下、買われ過ぎ値:オレンジラインより上。 - このインジケーターは、プライスアクションパターンと組み合わせるのに最適です。 - 標準的なオシレーターよりもはるかに正確です。対応時間枠:M30、H1、H4、D1、W1。 - PCとモバイルの両方でアラート機能付き。 高品質のトレーディングロボットとインジケーターをご覧になるにはここをクリックしてください! これは、このMQL5ウェブサイトでのみ提供されるオリジナル製品です。
[ZhiBiCCI]インディケータは全てのサイクル使用に適しており、そして全ての市場品種にも適しています。 [ZhiBiCCI]緑色の実線は強気の発散の逆転です。緑色の点線は古典的な強気の発散です。 [ZhiBiCCI]赤への実線は逆弱気の発散である。赤い点線は古典的な弱気の発散です。 [ZhiBiCCI]はパラメータ(アラート、メール送信、通知送信)で設定でき、(true)に設定するとインスタント信号をアラームウィンドウに送信し、Eメール、インスタントメッセージを送信できます。 パラメータ設定の説明 [displayAlert]:これはアラームスイッチで、trueに設定され、矢印が表示されればプロンプトに自動的に警告され、falseに設定されれば警告されません。 [sendmail_NO_OFF]:これはメールを送信するためのスイッチで、trueに設定します。矢印が表示されていればMT4で設定したメールボックスにメールを送信し、falseに設定されていればメールを送信しません。 [sendnotification_NO_OFF]:これはインスタントメッセージを送信するた
Quantum Falcon Signal Free is a smart visual trading indicator for MetaTrader 4 designed for Forex and Gold traders. The indicator combines: • Trend analysis • RSI momentum confirmation • MACD momentum filtering • ATR volatility filtering • Higher timeframe confirmation • Smart exit signal detection Main Features: • Smart Buy and Sell signals • Exit Buy / Exit Sell alerts • Real-time dashboard on chart • Professional candle arrows • Multi-timeframe trend confirmation • ATR market volatility filt
FREE
The Binary Profit Maker,  This indicator works on MT4 and is very easy to use. When you receive a signal from it, you wait for that candle with the signal to close and you enter your trade at the beginning of the next new candle . A Up Purple arrow means Buy and a Down Purple arrow means Sell. All arrows comes with Alert  like for easy identification of trade signal. Are you okay with that? How To Enter Trade? 1 minute candle 1 minute expire
このインジケーターは アグレッシブなスキャルピング と バイナリーオプションの速いエントリー のために設計されており、 毎バー でシグナルを生成し、常に何が起こっているかを正確に把握できます。 Happy Scalpingチャンネルに参加する: MQL5 再描画しません :現在のバーのシグナルは リアルタイム で生成されるため、まだバーが形成されている間に、前のバーの終値に対して価格が上がるか下がるかによってシグナルが変わる可能性があります。 しかし、バーが 閉じる と、シグナルの色は 完全に固定されます 。変更されず、消えず、動かず、 見るものがそのまま残ります。 なぜこのように設計されたのか? 多くのスキャルパーは、特に価格が ブレイクアウトや急激な動き をする際に、すぐにシグナルを受け取ることを重視しています。そのため、その瞬間に迅速に取引を行い、すぐにピップを獲得することができます。 一方で、バーが閉じた後の 確認を待つ ことを好むトレーダーもおり、その場合でもこのインジケーターを問題なく使用できます。 どちらのアプローチも有効です 。このシステムはどちらのスタイルにも
Noize Absorption Index - is the manual trading system that measures the difference of pressure between bears forces and bulls forces. Green line - is a noize free index that showing curent situation. Zero value of index shows totally choppy/flat market.Values above zero level shows how powerfull bullish wave is and values below zero measures bearish forces.Up arrow appears on bearish market when it's ready to reverse, dn arrow appears on weak bullish market, as a result of reverse expectation. S
The Smart Divergence Dashboard is your ultimate tool for identifying high-probability trading opportunities. This cutting-edge indicator is meticulously designed to detect Regular Divergences, offering traders a clear and actionable advantage. MT5 Version -  https://www.mql5.com/en/market/product/120703/ Key Features: Real-time Divergence Detection: Instantly pinpoints Higher High/Lower Low and Oscillator Higher Low divergences across multiple currency pairs and timeframes using   Awesome Oscill
Improved version of the free HMA Trend indicator (for MetaTrader 4) with statistical analysis. HMA Trend is a trend indicator based on the Hull Moving Average (HMA) with two periods. HMA with a slow period identifies the trend, while HMA with a fast period determines the short-term movements and signals in the trend direction. The main differences from the free version: Ability to predict the probability of a trend reversal using analysis of history data. Plotting statistical charts for analyzi
We present you the indicator "Candle closing counter", which will become your indispensable assistant in the world of trading. That’s why knowing when the candle will close can help: If you like to trade using candle patterns, you will know when the candle will be closed. This indicator will allow you to check if a known pattern has formed and if there is a possibility of trading. The indicator will help you to prepare for market opening and market closure. You can set a timer to create a pre
EARLY REMINDER: The Starting price is 65 price will rise soon up to 365$ and then 750$ after first 10 copies of sales. Grab this offer now! Introduction Hello, traders! Welcome to the demonstration of the Forex Beast Indicator , a comprehensive tool designed to assist aspiring traders in navigating the complexities of the forex market. This indicator incorporates seven essential components to provide a well-rounded trading experience: Moving Averages Colored Zones Support and Resistance Levels
Advanced Stochastic Scalper - is a professional indicator based on the popular Stochastic Oscillator. Advanced Stochastic Scalper is an oscillator with dynamic overbought and oversold levels, while in the standard Stochastic Oscillator, these levels are static and do not change. This allows Advanced Stochastic Scalper to adapt to the ever-changing market. When a buy or a sell signal appears, an arrow is drawn on the chart and an alert is triggered allowing you to open a position in a timely mann
Power Renko is an indicator which plots Renko bricks underneath the chart using a histogram. You can select the brick size and the timeframe of the Renko bricks as well as whether or not to use the close price or the high/low price of the candles. Renko bricks are based on price alone, not time, therefor the Renko bricks will not be aligned with the chart's time. They are extremely useful for trend trading and many different strategies can be formed from them. Buffers are provided allowing you t
Binary Options Support Resistance Indicator This indicator is designed for binary options trading and effectively shows retracements from support and resistance levels. Signals appear on the current candle. A red arrow pointing downwards indicates a potential selling opportunity, while a blue arrow pointing upwards suggests buying opportunities. All that needs adjustment is the color of the signal arrows. It is recommended to use it on the M1-M5 timeframes as signals are frequent on these timef
「Auto FIBO Pro」Crypto_Forex インジケーターは、取引の補助ツールとして最適です。 - インジケーターは、フィボナッチ レベルとローカル トレンド ライン (赤色) を自動的に計算してチャート上に配置します。 - フィボナッチ レベルは、価格が反転する可能性のある重要な領域を示します。 - 最も重要なレベルは、23.6%、38.2%、50%、61.8% です。 - リバーサル スキャルピングやゾーン グリッド取引に使用できます。 - Auto FIBO Pro インジケーターを使用して、現在のシステムを改善する機会も多数あります。 - Info Spread Swap Display があり、接続されている外国為替ペアの現在のスプレッドとスワップを表示します。 - ディスプレイには、アカウントの残高、エクイティ、マージンも表示されます。 - Info Spread Swap Display は、チャートのどのコーナーにも配置できます。 0 - 左上コーナー、1 - 右上、2 - 左下、3 - 右下。 高品質のトレーディングロボットとインジケーターをご覧にな
「調整可能なフラクタル」はフラクタル インジケーターの高度なバージョンで、非常に便利なトレーディング ツールです。 - ご存知のとおり、標準フラクタル MT4   インジケーターには設定がまったくありません。これはトレーダーにとって非常に不便です。 - 調整可能なフラクタルは、この問題を解決しました。必要な設定がすべて揃っています。 - インジケーターの調整可能な期間 (推奨値 - 7 以上)。 - 価格の高値/安値からの距離を調整可能。 - フラクタル矢印のデザインを調整可能。 - インジケーターにはモバイルおよび PC アラートが組み込まれています。 高品質のトレーディングロボットとインジケーターをご覧になるにはここをクリックしてください! これは、この MQL5 Web サイトでのみ提供されるオリジナル製品です。
This is a multi-timeframe version of the popular Hull Moving Average (HMA). The Double HMA MTF Light indicator combines two timeframes on a single chart. The HMA of the higher timeframe defines the trend, and the HMA of the current timeframe defines short-term price movements. The indicator is freely distributed and hasn't audio signals or messages. Its main function is the visualization of price movements. If you need advanced functionality of the HMA multi-timeframe indicator (information ab
FREE
Color Stochastic Enhanced Stochastic Oscillator with Cross Detection and Visual Signal Support Overview Color Stochastic is a customized version of the classic Stochastic Oscillator designed for momentum analysis and crossover visualization. The indicator provides color-based signal marking and configurable crossover detection at user-defined overbought and oversold levels. It can be used as part of: Momentum analysis Mean reversion workflows DCA-based strategies Multi-indicator confirmation sys
Not a traditional support resistance, or pivot point indicator. RevCan's " Early Reversal - MTF Trading Zones " is an Advanced tool that identifies potential market reversal points, or change of a trend at an early stage using MTF chart analysis. >> It analyzes multiple chart timeframes (MTF) to find these key price turnover zones where big banks and institutions are likely to place their trades, hence chances for you for high probability trade entry, Stop loss, and Take profit targets to maximi
Introduction It is common practice for professional trades to hide their stop loss / take profit from their brokers. Either from keeping their strategy to the themselves or from the fear that their broker works against them. Using this indicator, the stop loss / take profit points will be drawn on the product chart using the bid price. So, you can see exactly when the price is hit and close it manually.  Usage Once attached to the chart, the indicator scans the open orders to attach lines for t
SMT (Smart Money Technique) Divergence refers to the price divergence between correlated assets or their relationship to inversely correlated assets.  By analyzing SMT Divergence, traders can gain insights into the market's institutional structure and identify whether smart money is accumulating or distributing assets.  Every price fluctuation should be confirmed by market symmetry, and any price asymmetry indicates an SMT Divergence, suggesting a potential trend reversal. MT5 Version -  https:/
Magical Arrow
Ranguni Abdulsamir Abdulmajid
Magical Arrow Indicator – Clear & Reliable Signals The Magical Arrow Indicator is a non-repainting, trend-following tool that gives you crystal-clear Buy and Sell signals . It  high-probability reversals and entries . No more guesswork – just follow the arrows on your chart! The Magical Arrow Indicator is a powerful, easy-to-use trading tool that helps you catch the most profitable Buy and Sell opportunities in the Forex market. It is designed for beginners and professional traders , giving y
Forex Gump
Andrey Kozak
2.4 (5)
Forex Gump is a fully finished semi-automatic trading system. In the form of arrows, signals are displayed on the screen for opening and closing deals. All you need is to follow the instructions of the indicator. When the indicator shows a blue arrow, you need to open a buy order. When the indicator shows a red arrow, you need to open a sell order. Close orders when the indicator draws a yellow cross. In order to get the most effective result, we recommend using the timeframes H1, H4, D1. There
Trend PA
Mikhail Nazarenko
5 (3)
The Trend PA indicator uses   Price Action   and its own filtering algorithm to determine the trend. This approach helps to accurately determine entry points and the current trend on any timeframe. The indicator uses its own algorithm for analyzing price changes and Price Action. Which gives you the advantage of recognizing, without delay, a new nascent trend with fewer false positives. Trend filtering conditions can be selected in the settings individually for your trading style. The indicator
Heiken Ashi candle chart is an improved version of The Japanese candle chart, which can effectively filter the market "noise" of the Japanese candle chart. It is favored by many traders for its simplicity and intuition. For trend traders, the HA candle chart is a magic tool. Unlike the traditional Japanese candle chart, Heikenashi does not reflect the opening price, high price, low price and closing price of the market. Instead, Heikenashi calculates the value of a single K line in the dominant
このプロダクトを購入した人は以下も購入しています
Genesis Matrix Pro is a professional multi-timeframe trend detection indicator designed to help traders identify high-quality market alignment with clarity and structure. It combines 12 different technical indicators into one visual alignment matrix, allowing traders to quickly see when market conditions are bullish, bearish, or neutral. A signal is generated only when the selected strategies are aligned, helping reduce noise and improve decision-making. PLEASE CONTACT ME AFTER PURCHASE TO GET
Gann Made Easy は、ミスター・ギャンの理論を使用した取引の最良の原則に基づいた、プロフェッショナルで使いやすい外国為替取引システムです。 W・D・ガン。このインジケーターは、ストップロスとテイクプロフィットレベルを含む正確な買いと売りのシグナルを提供します。 PUSH通知を利用して外出先でも取引可能です。 ご購入後、取引方法の説明と優れた追加インジケーターを無料で入手するには、私にご連絡ください! おそらく、ギャンの取引手法についてはすでに何度も聞いたことがあるでしょう。通常、ギャンの理論は初心者のトレーダーだけでなく、すでにある程度の取引経験がある人にとっても非常に複雑なものです。なぜなら、ギャンの取引手法は理論的にはそれほど簡単に適用できるものではないからです。私はその知識を磨き、最良の原則を私の外国為替インジケーターに組み込むために数年を費やしました。 このインジケーターは非常に簡単に適用できます。必要なのは、それをチャートに添付し、簡単な取引推奨事項に従うだけです。このインジケーターは常に市場分析の仕事を行い、取引の機会を探します。適切なエントリーポイントを検出す
The Propfolio Master Suite is the ultimate all-in-one analytical workstation for professional traders. Combining the power of the Beat The Market Maker (BTMM) methodology, Smart Money Concepts (SND/Liquidity), and Advanced Volume Profile, this suite replaces multiple different indicators with one optimized engine. Monitor up to 14 pairs simultaneously from a single chart, instantly identify market cycles, and seamlessly map institutional footprints with the click of a button. The Command Center
Scalper Inside PRO Scalper Inside PRO は、MetaTrader 4 向けの短期トレンドおよびスキャルピング用インジケーターです。独自アルゴリズムを用いて、市場の方向性と主要なターゲットレベルを素早く検出します。エントリー、イグジット、複数の利確ターゲットを自動計算し、詳細なパフォーマンス統計を表示することで、さまざまな銘柄やストラテジーがどのように機能してきたかを確認できます。これにより、現在のマーケットコンディションに最も適した取引銘柄を選択するのに役立ちます。さらに、Scalper Inside PRO には、お使いの矢印インジケーターを簡単に接続でき、その統計と過去のパフォーマンスを素早く評価できます。 本インジケーターは、あらゆる銘柄と時間足で動作し(短期トレードには M5 を推奨)、複数の内蔵ストラテジーを備えています。そのため、単体のスキャルピングツールとしても、トレーディングシステム内の強力な分析コンポーネントとしても活用できます。 主な機能 独自アルゴリズム(Next‑Generation Trend Detection Algor
M1 SNIPER は使いやすいトレーディングインジケーターシステムです。M1時間足向けに設計された矢印インジケーターです。M1時間足でのスキャルピングのためのスタンドアロンシステムとして、また既存のトレーディングシステムの一部としても使用できます。このトレーディングシステムはM1時間足での取引に特化して設計されていますが、他の時間足でも使用できます。元々、この手法はXAUUSDとBTCUSDの取引用に設計しましたが、他の市場においても役立つと考えています。 インジケーターのシグナルは、トレンドの方向と逆方向に取引できます。インジケーターのシグナルを利用して両方向に取引するのに役立つ特別な取引テクニックをご紹介します。この手法は、特別な動的なサポートとレジスタンスの価格帯を利用することに基づいています。 ご購入後、M1 SNIPER矢印インジケーターをすぐにダウンロードできます。さらに、M1 SNIPERツールのすべてのユーザーに、以下のスクリーンショットに表示されているApollo Dynamic SRインジケーターを無料で提供しています。この2つのインジケーターを組み合わせることで
PRO Renko Systemは、特別にRENKOチャートを取引するために設計された高精度の取引システムです。 これは、様々な取引商品に適用することができる普遍的なシステムです。 システムは効果的に正確な逆転信号へのアクセスを与えるいわゆる市場の騒音を中和する。 表示器は非常に使いやすく、信号の生成に責任がある1つの変数だけがあります。 あなたは簡単にお好みの任意の取引ツールとレンコバーのサイズにツールを適応させることができます。 私はいつもあなたが私のソフトウェアで収益性の高い取引を支援するために余分なサポートを提供する準備ができています! 私はあなたに幸せで収益性の高い取引をしたいです! ご購入後にご連絡ください! 私はあなたに私のレンコチャートジェネレータを送信します。 私はまた、私の個人的な推奨事項やシステムの他のモジュールを無料で共有します!
Auto Optimized Parabolic RSI: 高度な3Dモメンタムエンジン ほとんどのリテール向けインジケーターは、市場のボラティリティが変化した瞬間に破綻する静的な入力値に依存しているため、失敗に終わります。Auto Optimized Parabolic RSIは、自らの数学的優位性を継続的に再計算することで「インジケーターの陳腐化」問題を解決し、機関投資家レベルの定量的適応力をMT5ターミナルに直接もたらします。 最大の強み: カスタムインメモリ3D最適化   標準的な自動最適化ツールは、インジケーターの呼び出しで端末に過負荷をかけるため、頻繁にMT5プラットフォームをフリーズさせます。本ツールは、このボトルネックを完全に回避しています。RAMベースのカスタムネイティブ計算機を内蔵した内部エンジンは、チャートを読み込んだりタイムフレームを変更したりするたびに、超高速の3Dグリッド探索を実行します。RSI期間(頻度)、SARステップ(加速度)、SAR最大値(制限速度)を同時にスイープし、プラットフォームを遅延させることなく、数万通りものパラメーターの組み合わせを絶対的
NAM Order Blocks
NAM TECH GROUP, CORP.
3.67 (3)
MT4マルチタイムフレームオーダーブロック検出インジケーター。 特徴 -チャートコントロールパネルで完全にカスタマイズ可能で、完全な相互作用を提供します。 -必要な場所でコントロールパネルを表示および非表示にします。 -複数の時間枠でOBを検出します。 -表示するOBの数量を選択します。 -さまざまなOBユーザーインターフェイス。 -OBのさまざまなフィルター。 -OB近接アラート。 -ADRの高線と低線。 -通知サービス(画面アラート|プッシュ通知)。 概要 注文ブロックは、金融機関や銀行からの注文収集を示す市場行動です。著名な金融機関と中央銀行が外国為替市場を牽引しています。したがって、トレーダーは市場で何をしているのかを知る必要があります。市場が注文ブロックを構築するとき、それは投資決定のほとんどが行われる範囲のように動きます。 注文の構築が完了すると、市場は上向きと下向きの両方に向かって急激に動きます。注文ブロック取引戦略の重要な用語は、機関投資家が行っていることを含むことです。それらは主要な価格ドライバーであるため、機関投資家の取引を含むあらゆる戦
LHおよびHLブレイクアウトを見つけるための純粋な価格アクションによって行われる高度な計算。 それはあなたに市場で素晴らしい逆転ポイントを与えるでしょう。LHとHL信号は同様にトレイングルブレイクアウトに使用することができます。 ブレイクアウトが発生すると、強い反転を示します。移動平均の優れたフィルターです。トレンドインジケーターと一緒に使用することを強くお勧めします。 サポートとレジスタンス、供給需要指標の追加確認として使用できます。 詳細については、次の外国為替スレッドをご覧ください。 インジケーターは再描画されていません。 Buffers :   SetIndexBuffer ( 0 ,UpBar);      SetIndexBuffer ( 1 ,UpBar2);           SetIndexBuffer ( 2 ,DnBar);      SetIndexBuffer ( 3 ,DnBar2);           SetIndexBuffer ( 4 ,UpBarTop);      SetIndexBuffer ( 5 ,UpBarLow);     
Dynamic Forex28 Navigator - 次世代の Forex 取引ツール。 現在 49% オフ。 Dynamic Forex28 Navigator は、長年人気のインジケーターを進化させたもので、3 つの機能を 1 つにまとめています。 Advanced Currency Strength28 インジケーター (レビュー 695 件)  + Advanced Currency IMPULSE with ALERT (レビュー 520 件) + CS28 コンボ シグナル (ボーナス)。 インジケーターの詳細 https://www.mql5.com/en/blogs/post/758844 次世代の Strength インジケーターが提供するもの  オリジナルで気に入っていたすべての機能が、新機能と精度の向上によって強化されました。 主な機能: 独自の通貨強度計算式。 すべての時間枠でスムーズかつ正確な強度ライン。 トレンドの特定と正確なエントリーに最適です。 ダイナミックマーケットフィボナッチレベル (マーケットフィボナッチ)。 このインジケーターに固有
これはほぼ間違いなく、MetaTraderプラットフォームで見つけることができる最も完全な調和価格形成自動認識インジケーターです。 19種類のパターンを検出し、フィボナッチプロジェクションをあなたと同じように真剣に受け止め、潜在的逆転ゾーン(PRZ)を表示し、適切なストップロスとテイクプロフィットレベルを見つけます。 [ インストールガイド | 更新ガイド | トラブルシューティング | よくある質問 | すべての製品 ] 19の異なる調和価格形成を検出します プライマリ、派生および補完フィボナッチ投影(PRZ)をプロットします 過去の価格行動を評価し、過去のすべてのパターンを表示します この指標は、独自の品質とパフォーマンスを分析します 適切なストップロスとテイクプロフィットのレベルを表示します ブレイクアウトを使用して適切な取引を通知します すべてのパターン比をグラフにプロットします 電子メール/音声/視覚アラートを実装します スコット・M・カーニーの本に着想を得て、この指標は最も純粋で急を要するトレーダーのニーズを満たすように設計されています。ただし、トレードを容易にする
このインジケーターは、反転ポイントと価格戻りゾーンを正確に表示します。     主要プレーヤー 。新たなトレンドが形成される場所を把握し、最大限の精度で意思決定を行い、すべての取引をコントロールします。 TREND LINES PRO インジケーターと組み合わせることで、その潜在能力を最大限に発揮します。 VERSION MT5 インジケーターが示す内容: 新しいトレンドの始まりに活性化する反転構造と反転レベル。 リスクと報酬の比率を最小限に抑えた利益 確定 と 損失停止の レベルの表示     RR 1:2   。 インテリジェントな削減ロジックによるストップロス。 指定されたインジケーターから 2 つのトレンド タイプの反転パターンを表示します。 指標: トレンドを追う   TREND LINES PRO   (世界的なトレンドの変化) TREND PRO   (クイックトレンド変更) シンプルで効果的   スキャナー   リアルタイムトレンド(新機能)。 マルチタイムフレームのインストゥルメント フィルタリング。 画面   利益     LOGIC AI信号の後。 当日プラス方
トレンドキャッチャーインジケーター トレンドキャッチャーインジケーターは、開発者独自の適応型トレンド分析指標を組み合わせることで、市場価格の動きを分析します。短期的なノイズを除去し、根底にあるモメンタムの強さ、ボラティリティの拡大、価格構造の挙動に焦点を当てることで、真の市場方向性を特定します。また、移動平均線、RSI、ボラティリティフィルターなどの平滑化およびトレンドフィルタリング機能を備えたカスタマイズ指標も使用します。 実際の運用状況のモニタリングやその他の製品については、こちらをご覧ください: https://www.mql5.com/en/users/mechanic/seller ご注意ください。私はTelegramでEAや設定を販売していません。詐欺です。すべての設定はブログで無料で公開しています。 重要!ご購入後すぐにご連絡ください。手順とボーナスをお送りします!
Apollo SR Master は、サポート/レジスタンスゾーンを利用した取引をより容易かつ確実にする特別な機能を備えたサポート/レジスタンスインジケーターです。このインジケーターは、ローカル価格の高値と安値を検出することで、タイムラグなしでリアルタイムにサポート/レジスタンスゾーンを計算します。そして、新たに形成されたSRゾーンを確認するために、インジケーターは特別なシグナルを表示します。このシグナルは、SRゾーンを実際の売りまたは買いシグナルとして考慮して使用できることを示します。この場合、SRゾーンの強度が高まり、SRエリアからの取引が成功する確率も高まります。これがこのインジケーターの基本的な考え方です。 SRゾーンは、ストップロスとテイクプロフィットの設定を容易にします。シグナルの方向に応じて、SRゾーンの上または下のスペースをストップロスとして設定できます。さらに、反対側のSRゾーンは、潜在的なテイクプロフィットエリアとして設定できます。 また、Apollo SRマスターインジケーターをご利用のすべてのユーザーには、「Apollo Price Action System」
優れたテクニカルインジケーター「Grabber」をご紹介します。これは、すぐに使える「オールインワン」トレーディング戦略として機能します。 ひとつのコードに、市場のテクニカル分析ツール、取引シグナル(矢印)、アラート機能、プッシュ通知が強力に統合されています。 このインジケーターを購入された方には、以下の特典を無料で提供します: Grabberユーティリティ:オープンポジションを自動で管理するツール ステップバイステップのビデオマニュアル:インジケーターのインストール、設定、取引方法を解説 カスタムセットファイル:インジケーターをすばやく自動設定し、最大限の成果を出すための設定ファイル 他の戦略はもう忘れてください!Grabberだけが、あなたを新たなトレードの高みへと導いてくれるのです。 Grabber戦略の主な特徴: 推奨タイムフレーム:M5〜H4 対応通貨ペア・資産:どれでも使用可能ですが、私が実際に検証した以下を推奨します(GBPUSD、GBPCAD、GBPCHF、AUDCAD、AUDUSD、AUDSGD、AUDCHF、NZDUSD、NZDCAD、EURCAD、EURUSD、E
デイトレーダーマスターは、デイトレーダーのための完全なトレーディングシステムです。システムは2つのインジケーターで構成されています。 1つの指標は売買する矢印信号です。それはあなたが得る矢印インジケーターです。 2つ目のインジケーターを無料で提供します。 2番目のインジケーターは、これらの矢印と組み合わせて使用​​するために特別に設計されたトレンドインジケーターです。 インジケーターは繰り返さず、遅れないでください! このシステムの使用は非常に簡単です。 2色の線で表示されている現在のトレンドの方向に矢印信号をたどる必要があります。青は買いの傾向です。赤い色は売りの傾向です。青い矢印は買いシグナルです。赤い矢印は売りの合図です。トレンドラインの色と一致するように、矢印の色と信号の方向が必要です。 矢印インジケーターは、主に時間間隔M5とM15での日中取引のために作成されました。ただし、技術的には、システムは他の時間間隔で使用できます。 インジケータには、PUSHメッセージ機能を備えたポップアップアラートが装備されています。 購入後、必ず私に書いてください!私はあなたにシステムとの取引の
ゴールドラッシュ・トレンド・アロー・シグナル ゴールドラッシュ・トレンド・アロー・シグナル 指標は、XAU/USDにおける高速・短期スキャルパー向けに最適化された、正確でリアルタイムのトレンド分析を提供します。 1分足専用に設計されたこのツールは、明確なエントリーポイントを示す方向矢印を表示し、スキャルパーが変動の激しい市場状況でも自信を持って取引できるよう支援します。 この指標は、PRIMARY(主要)とSECONDARY(補助)のアラート矢印で構成されています。PRIMARYシグナルは、トレンドの方向転換を示す白と黒の方向矢印であり、SECONDARYシグナルは、PRIMARY矢印が示す方向を確認し、潜在的なエントリーポイントを示す青と赤の矢印です。 注意:トレンド方向の変化後にPRIMARYアラート矢印が1つだけ表示される場合、複数のSECONDARY青/赤矢印が表示される点に注意が必要です。SECONDARYシグナルは、シグナル基準を満たす任意のローソク足後に表示されます。したがって、長期的なトレンド移動の場合、画面に多くのSECONDARY矢印が表示されます(添付の
Introduction to Fractal Pattern Scanner Fractal Indicator refers to the technical indicator that makes use of the fractal geometry found in the financial market. Fractal Pattern Scanner is the advanced Fractal Indicator that brings the latest trading technology after the extensive research and development work in the fractal geometry in the financial market. The most important feature in Fractal Pattern Scanner is the ability to measure the turning point probability as well as the trend probabi
現在40%オフ 初心者やエキスパートトレーダーに最適なソリューション! このインジケーターは、独自の機能と新しい計算式を取り入れた、ユニークで高品質、かつ手頃な価格のトレーディングツールです。たった1枚のチャートで28の為替ペアの通貨強度を読み取ることができます。新しいトレンドやスキャルピングチャンスの引き金となるポイントを正確に特定することができるので、あなたのトレードがどのように改善されるか想像してみてください。 ユーザーマニュアルはこちら  https://www.mql5.com/en/blogs/post/697384 これが最初の1本、オリジナルだ! 価値のないクローンを買わないでください。 特別な サブウィンドウの矢印で強い通貨の勢いを表示 GAPがあなたのトレードを導く! 基準通貨や気配値が売られすぎ・買われすぎのゾーン(外相フィボナッチレベル)にあるとき、個別チャートのメインウィンドウに警告表示。 通貨がレンジの外側から反落した場合、プルバック/リバーサルのアラート。 クロスパターンの特別なアラート 複数の時間枠を選択可能で、トレンドを素早く確認できます
Advanced Supply Demand
Bernhard Schweigert
4.91 (300)
現在40%オフ 初心者にもエキスパートトレーダーにも最適なソリューション このインジケーターは独自の機能と新しい公式を多数内蔵しており、ユニークで高品質かつ手頃な取引ツールです。このアップデートでは、2つの時間枠ゾーンを表示できるようになります。より長いTFだけでなく、チャートTFとより長いTF(ネストゾーンを表示)の両方を表示できます。すべてのSupply Demandトレーダーの皆さんのお気に召すはずです。:) 重要情報の公開 Advanced Supply Demandの可能性を最大化するには、 https://www.mql5.com/ja/blogs/post/720245 にアクセスしてください。   エントリーまたはターゲットの正確なトリガーポイントを正確に特定できれば取引がどのように改善されるか想像してみてください。新しい基盤となるアルゴリズムに基づいて構築されているため、買い手と売り手の間の潜在的な不均衡をさらに簡単に特定できます。これは、最も強い需要と供給のゾーンと、過去のパフォーマンス(古いゾーンを表示)がグラフィカルに表現されるためです。これらの機能は、最適な
Market Structure Patterns   is an indicator based on   smart money concepts   that displays   SMC/ICT   elements that can take your trading decisions to the next level. Take advantage of the   alerts ,   push notifications   and   email messages   to keep informed from when an element is formed on the chart, the price crosses a level and/or enters in a box/zone. Developers can access the values of the elements of the indicator using the   global variables  what allows the automation of trading d
Advanced UT BOT ALERTS for MT4 プロフェッショナル多重フィルター型トレンド検出システム|強化版 UT BOT エンジン 私たちは高品質なインジケーターのみを提供します。 Advanced UT BOT はプロフェッショナル向けに設計されており、安定したシグナルロジックと安全な計算構造によって遅延や誤更新を防止します。 過去のシグナルを 再描画・修正・削除することはありません 。 すべての BUY / SELL シグナルは ローソク足の確定後に生成され固定されます 。 リアルタイム取引中に 再描画は一切なく 、足が確定した時点で即座に表示されます。 期間限定オファー — 次回価格は 49 ドルになります。 価格が上がる前に今すぐ入手してください。 製品概要 Advanced UT BOT ALERTS   は、 UT BOT   のコアロジックに基づいて再構築された次世代のトレンドシグナルシステムです。 MT5 に完全対応し、複数のフィルター、動的ビジュアル化、高精度アラートを統合しています。 UT Bot インジケーターはもともと   Yo_adrii
購入後、このインジケーターに基づいたボーナスEAを受け取るためにご連絡ください。 Self Optimizing Double MA Strategyは、パラメータ推測の必要性を排除するために設計されたプロフェッショナルグレードの取引ツールです。組み込みの自動最適化エンジンを搭載し、バックグラウンドで何千ものパラメータの組み合わせをシミュレートすることで、変化する市場状況に継続的に適応し、統計的な優位性を維持します。 静的で時代遅れの設定に依存するのではなく、インジケーターは自身のロジックを動的に更新し、現在の時間枠と取引商品にとって最も収益性の高い構成を見つけ出します。 主な機能 組み込みの自動最適化: 選択した更新頻度に基づいて、システムはFast MA、Slow MA、およびRSIの期間を定期的に再計算し、設定が常に現在の市場のリズムと一致するようにします。 MAダイバージェンスフィルター: 移動平均線が明確に乖離している(広がっている)場合にのみシグナルを検証する、トレンド強度のコア指標です。これにより、移動平均線が収束している相場や平坦なレンジ相場での誤ったエントリーを防ぎ
もしあなたがFX取引をしているなら、通貨の強さと通貨ペアの相関関係に関する詳細な情報を持つことは、取引パフォーマンスを飛躍的に向上させることができます。相関関係を活用すればリスクを半減でき、強さの分析を活用すれば利益を最大化することが可能です。 このインジケーターは、通貨の強さ分析と通貨ペアの相関関係を組み合わせたハイブリッドなアプローチにより、最適な通貨ペアを選択するサポートをします。 通貨の強さ分析の使い方 例えば、あなたの取引戦略でAUD/JPYの買いシグナルが出たとします。しかしKTの通貨強さ分析を使うと、JPYがAUDよりも強くなっていることがわかりました。この場合、その取引は損失に終わる可能性が高いです。このインジケーターがあれば、そのような損失を未然に防ぐことができます。 通貨ペア相関関係の使い方 例えば、NZD/USDとGBP/JPYの同時売りシグナルが出たとします。KTの通貨ペア相関ツールを使うと、これらのペアの相関率が77%であることが判明します。  これらのペアは強く相関しているため、同時に取引するとリスクが二重になります。もしNZD/USDで損失が出れば、
KURAMA GOLD SIGNAL PRO(MT4版)— 7層フィルター・自動TP/SL・品質スコア搭載 XAUUSD完全トレードシステム リペイントなし。リドローなし。ラグなし。すべてのサインは確定後に変わりません。見たままが結果です。 特典:買い切りライセンスをご購入いただいた方に、AI Zone Radar($59相当)+PDFマニュアルを無料プレゼント。購入後にMQL5でメッセージをお送りください。 AI Zone Radar: https://www.mql5.com/en/market/product/175834 トレーダーから信頼されています:ゴールドトレーダーのコミュニティで実際に使用され、精度と使いやすさで高く評価されています。 あなたの問題 — そしてその解決策 ゴールドは1日$30〜$50動く。チャンスがあるのは分かっている。でもこういう経験はないか: - エントリーが早すぎて、$10逆行してから思った方向に動く - MAタッチのたびに入って、半分は負ける - TP/SLの基準がないから、持ちすぎるか早すぎる決済をする - 動かない時間帯にトレ
「 Dynamic Scalper System 」インジケーターは、トレンド波の中でスキャルピング取引を行う手法のために設計されています。 主要通貨ペアと金でテスト済みで、他の取引商品との互換性があります。 トレンドに沿った短期的なポジションオープンのシグナルを提供し、追加の価格変動サポートも提供します。 インジケーターの原理 大きな矢印はトレンドの方向を決定します。 トレンド波の中では、小さな矢印の形でスキャルピングシグナルを生成するアルゴリズムが機能します。 赤い矢印は強気方向、青い矢印は弱気方向です。 トレンドの方向には敏感な価格変動ラインが描かれ、小さな矢印のシグナルと連動します。 シグナルは次のように機能します。適切なタイミングでラインが現れるとエントリーシグナルが形成され、ラインが開いている間はポジションが保持され、完了すると取引が終了します。 推奨される動作時間枠はM1~H4です。 矢印は現在のローソク足に形成され、次のローソク足が開いている場合は、前のローソク足の矢印は再描画されません。 入力パラメータ Trend Wave Period - トレンド方向
頭と肩のパターンは、3つのピークを持つベースラインに似たチャート構成であり、外側の2つは高さが近く、中央は最高です。強気から弱気のトレンド反転を予測し、最も信頼性の高いトレンド反転パターンの1つと考えられています。これは、トレンドが終わりに近づいていることをさまざまな精度で知らせるいくつかのトップパターンの1つです。 [ インストールガイド | 更新ガイド | トラブルシューティング | よくある質問 | すべての製品 ] クリアな取引シグナル カスタマイズ可能な色とサイズ パフォーマンス統計を実装します カスタマイズ可能なフィボナッチリトレースメントレベル 適切なストップロスおよび利益レベルを表示します インジケーターを使用して、継続パターンまたは反転パターンを見つけることができます 再描画および非再描画ではありません 電子メール/音声/視覚アラートを実装します 設定 チャートにインジケーターをロードすると、入力パラメーターとして一連のオプションが表示されます。パラメーターが自明のブロックにグループ化されているため、それらが多すぎると思う場合でも、絶望しないでください。これは、パ
このインディケーターはダブルトップとダブルボトムの反転パターンを見つけ、ブレイクアウトを使用して取引シグナルを発生させます。 [ インストールガイド | 更新ガイド | トラブルシューティング | よくある質問 | すべての製品 ] クリアな取引シグナル カスタマイズ可能な色とサイズ パフォーマンス統計を実装します カスタマイズ可能なフィボナッチリトレースメントレベル 適切なストップロスとテイクプロフィットのレベルを表示します 電子メール/音声/視覚アラートを実装します これらのパターンは拡張でき、インジケーターは再描画によってパターンに追従します。ただし、インジケーターはトレードを容易にするためにツイストを実装します。トレードをシグナルする前に正しい方向へのドンチャンブレイクアウトを待機し、シグナルを非常に信頼性が高く、ほとんど再描画しません。 入力パラメータ 振幅:振幅は、代替価格ポイント間のバーの最小量を表します。大きなパターンを見つけるには、振幅パラメーターを大きくします。小さなパターンを見つけるには、振幅パラメーターを小さくします。 最小リトレースメント:パターンに
チャートを構成し、周期的な価格変動を識別するテクニカル指標。 どのチャートでも動作します。 いくつかの種類の通知。 グラフ自体に追加の矢印があります。 履歴を再描画せずに、キャンドルのクローズに取り組みます。 M5以上のTFを推奨します。 パラメータの使用と設定が簡単です。 異なるパラメータを持つ 2 つのインジケーターを使用する場合、他のインジケーターなしで使用できます。 入力パラメータは2つあります 周期性と信号持続時間 これら 2 つのパラメータは、チャート構造の処理を扱います。 Cyclicity - 反転サイクルが変化する頻度を調整し、サイクルを滑らかにします。 Signal duration - 最小数では価格変動の衝動を検出し、最大数では長期的なトレンドの動きを検出します。
After purchase, contact me privately to receive 1 month of free testing with EA Forex Proton! This advanced MT4 trading robot automatically executes signals from any MT4 indicator, including Market Makers. The latest version also includes AI integration, allowing each trade signal to be analyzed using Artificial Intelligence. Live Signal with EA Forex Proton: Click here Market Makers is a powerful price action trading system designed to identify high-probability Buy and Sell opportunities based
作者のその他のプロダクト
The   Area of Interest (AOI) Indicator   is a powerful tool designed to help traders identify key market zones where price reactions are highly probable. This indicator specifically highlights two critical zones: Seller AOI (Area of Interest) : This zone represents areas where sellers are likely to enter the market, often acting as resistance. When the price approaches or touches this zone, it signals that a potential sell-off could occur. Buyer  A OI (Area of Interest) : The BOI zone identifie
FREE
This is the best Support and Resistance Indicator on the market, and it shows both confirmed Support and Resistance as well as Retests. Support & Resistance: Support marks where buying demand halts price declines, acting as a safety net. Resistance caps price surges, driven by selling pressure. Traders leverage these levels to predict reversals, plan entries, exits, and manage risks, making them trading's fundamental guideposts. Join To Learn Market Depth -   https://www.mql5.com/en/channels/su
FREE
Introducing   Order Blocks Breaker , a brand-new way to identify and leverage order blocks in your trading strategy. After developing multiple order block tools with unique concepts, I’m proud to present this tool that takes things to the next level. Unlike previous tools,   Order Blocks Breaker   not only identifies order blocks but also highlights   Breaker Order Blocks —key areas where the price is likely to retest after a breakout. MT4 -  https://www.mql5.com/en/market/product/124101/ This t
Price Retest MT5
Suvashish Halder
4.83 (6)
Introducing our exciting new Price Retest indicator! Get instant alerts when the price retests, giving you a powerful edge in your trading strategy. Remember to do your own analysis before making any moves in the market. MT4 Version -  https://www.mql5.com/en/market/product/118031 Join To Learn Market Depth -   https://www.mql5.com/en/channels/suvashishfx Here’s a detailed explanation of how the Price Retest indicator works, its components, and how you can incorporate it into your trading strat
FREE
Live Trading Results   MT4 Version Contact for Manual Guide   Next Price $125 Free Scanner   Dashboard  (Contact me)   Strategy -   Breakout  /   Retest   /   Aggressive Hello Everyone, We are excited to introduce one of the most reliable and high win rate patterns in trading: the Cup and Handle . This is the first time we are releasing this meticulously crafted indicator, boasting an impressive 95% success rate . It is versatile and effective across all types of pairs, stocks
The "Power of Three" (PO3) is a concept developed by the Inner Circle Trader (ICT) to illustrate a three-stage approach used by smart money in the markets:   Accumulation, Manipulation, and Distribution . ICT traders view this as a foundational pattern that can explain the formation of any candle on a price chart. In simple terms, this concept is effective for any time frame, as long as there's a defined start, highest point, lowest point, and end. MT4 -  https://www.mql5.com/en/market/product/1
FREE
Consolidation Zone   Indicator is a powerful tool designed for traders to identify and capitalize on consolidation patterns in the market. This innovative indicator detects consolidation areas and provides timely alerts when the price breaks above or below these zones, enabling traders to make informed trading decisions. MT4 Version :  https://www.mql5.com/en/market/product/118734 Join To Learn Market Depth -   https://www.mql5.com/en/channels/suvashishfx Key Features: 1.   Consolidation Det
FREE
Smart Fibo Zones   are powerful, auto-generated Fibonacci Retracements that are anchored to key   market structure shifts . These zones serve as critical   Supply and Demand   levels, guiding you to identify potential price reactions and confirm market direction.  Fibonacci  calculations, widely used by professional traders, can be complex when it comes to identifying highs and lows. However,  Smart Fibo Zones  simplify this process by automatically highlighting order blocks and key zones, compl
Area of Interest
Suvashish Halder
4.78 (9)
The Area of Interest (AOI) Indicator is a powerful tool designed to help traders identify key market zones where price reactions are highly probable. This indicator specifically highlights two critical zones: Seller AOI (Area of Interest) : This zone represents areas where sellers are likely to enter the market, often acting as resistance. When the price approaches or touches this zone, it signals that a potential sell-off could occur. Buyer  A OI (Area of Interest) : The BOI zone identifies re
FREE
Higher Timeframe Chart Overlay will display higher timeframe candles, including the number of candles high/low you specify. You no longer need to switch timeframes to check the candles. Everything can be shown in one chart. MT5 Version :  https://www.mql5.com/en/market/product/115682 Almost everything can be change as you want. You can change/set: - Choose different colors for the body and top/bottom wicks. - Panel's height and width. - The width of the body and wicks - Change background a
Smart Fibo Zones are powerful, auto-generated Fibonacci Retracements that are anchored to key market structure shifts . These zones serve as critical Supply and Demand levels, guiding you to identify potential price reactions and confirm market direction.  Fibonacci calculations, widely used by professional traders, can be complex when it comes to identifying highs and lows. However, Smart Fibo Zones simplify this process by automatically highlighting order blocks and key zones, complete with St
Power of Three
Suvashish Halder
4.67 (3)
The "Power of Three" (PO3) is a concept developed by the Inner Circle Trader (ICT) to illustrate a three-stage approach used by smart money in the markets: Accumulation, Manipulation, and Distribution . ICT traders view this as a foundational pattern that can explain the formation of any candle on a price chart. In simple terms, this concept is effective for any time frame, as long as there's a defined start, highest point, lowest point, and end. MT5 -  https://www.mql5.com/en/market/product/124
FREE
Price Retest
Suvashish Halder
4.88 (8)
Introducing our exciting new Price Retest indicator! Get instant alerts when the price retests, giving you a powerful edge in your trading strategy. Remember to do your own analysis before making any moves in the market. MT5 Version -  https://www.mql5.com/en/market/product/118159/ Join To Learn Market Depth -   https://www.mql5.com/en/channels/suvashishfx Here’s a detailed explanation of how the Price Retest indicator works, its components, and how you can incorporate it into your trading str
FREE
Consolidation Zone Indicator is a powerful tool designed for traders to identify and capitalize on consolidation patterns in the market. This innovative indicator detects consolidation areas and provides timely alerts when the price breaks above or below these zones, enabling traders to make informed trading decisions. MT5 Version :  https://www.mql5.com/en/market/product/118748 Join To Learn Market Depth -   https://www.mql5.com/en/channels/suvashishfx Key Features: 1. Consolidation Detecti
FREE
Tired of manually adjusting stop-loss and take-profit levels for multiple positions across different pairs? The Manage Multiple Positions Expert Advisor is your solution. MT4 Version -  https://www.mql5.com/en/market/product/120916/ This powerful tool streamlines your trading experience by allowing you to manage multiple positions on a single pair with ease. Modify stop-loss and take-profit levels for all open positions on a specific pair with a single click. Plus, the EA provides clear visibili
Introducing the Volume Order Blocks indicator, a game-changing tool designed for traders who demand precision and clarity in their market analysis. This advanced indicator not only identifies order blocks but also integrates crucial volumetric data, allowing you to gauge the strength of these blocks with unparalleled accuracy. MT4 version -  https://www.mql5.com/en/market/product/121237/ Key Features of the Volume Order Blocks: Bullish & Bearish Order Blocks: Easily visualize and differentiat
This is the best Support and Resistance Indicator on the market, and it shows both confirmed Support and Resistance as well as Retests. Support & Resistance: Support marks where buying demand halts price declines, acting as a safety net. Resistance caps price surges, driven by selling pressure. Traders leverage these levels to predict reversals, plan entries, exits, and manage risks, making them trading's fundamental guideposts. Join To Learn Market Depth -   https://www.mql5.com/en/channels/suv
FREE
Introducing   Volume Orderflow Profile , a versatile tool designed to help traders visualize and understand the dynamics of buying and selling pressure within a specified lookback period. Perfect for those looking to gain deeper insights into volume-based market behavior! MT4 Version -  https://www.mql5.com/en/market/product/122656/ The indicator gathers data on high and low prices, along with buy and sell volumes, over a user-defined period. It calculates the maximum and minimum prices during t
This is one of the most popular and highly rated   volatility index (VIX)   indicators on the market. It provides the same readings as the VIX does for stock indexes. However, this indicator works across all asset classes.  VIX Fix Finds Market Bottoms.  This indicator is not for inexperienced traders. Use it for day and swing trading. MT4 Version -  https://www.mql5.com/en/market/product/112238 Join To Learn Market Depth -   https://www.mql5.com/en/channels/suvashishfx Bernard Baruch summe
FREE
Volume Delta Candles offer a straightforward way to analyze trading activity within each candle, making it easier to see what's happening without needing an extra volume indicator. This tool uses lower timeframe or real-time data to show the percentage of buying and selling volume within a candle as a colored bar. Make sure you understand Volume and Volume Delta before jumping in. If you’re not sure, reach out to me first for a quick rundown. But if you're already familiar, you're good to go! Ke
Trading Notes   is an innovative tool designed for traders to streamline their decision-making process by allowing them to write and display important reminders or short details directly over their trading charts. This essential feature ensures that traders have quick access to their personalized checklist before opening any positions, enhancing their trading efficiency and accuracy. MT4 Version -  https://www.mql5.com/en/market/product/120613 Join To Learn Market Depth -  https://www.mql5.co
FREE
Introducing the   Volume Order Blocks  indicator, a game-changing tool designed for traders who demand precision and clarity in their market analysis. This advanced indicator not only identifies order blocks but also integrates crucial volumetric data, allowing you to gauge the strength of these blocks with unparalleled accuracy. MT5 version -  https://www.mql5.com/en/market/product/121238/   Key Features of the Volume   Order Blocks: Bullish & Bearish Order Blocks:   Easily visualize and dif
We mark the fair value gap (FVG) and wait for the price to reach that zone, but sometimes it reverses before getting there. This can happen because we didn't notice the Balanced Price Range (BPR). My tools will enhance your analysis by displaying everything on the chart, helping you identify potential price reversal areas so you can make informed decisions about when to enter the market. MT4 -  https://www.mql5.com/en/market/product/119216 So, what is BPR or Balanced Price Range? A Balanced Pri
The Smart Liquidity Profile is color-coded based on the importance of the traded activity at specific price levels, allowing traders to identify significant price levels such as support and resistance levels, supply and demand zones, liquidity gaps, consolidation zones, Buy-Side/Sell-Side Liquidity and so on.  Smart Liquidity Profile allows users to choose from a number of different time periods including 'Auto,' 'Fixed Range,' 'Swing High,' 'Swing Low,' 'Session,' 'Day,' 'Week,' 'Month,' 'Quart
The Fibonacci Volatility Bands indicator is a refined tool designed to enhance your market analysis by integrating Fibonacci retracements with the Bollinger Bands concept. This indicator visually highlights potential areas of support and resistance, providing traders with a clearer understanding of price fluctuations and volatility. MT4 Version -  https://www.mql5.com/en/market/product/126421/ The core of the Fibonacci Volatility Bands is built around a Volume Weighted Moving Average (VWMA) that
FREE
Order Block Tracker is here to solve one of the biggest challenges traders face: identifying order blocks. Many traders fail to spot these critical zones, often missing out on key market entries. But with Order Block Tracker , you no longer have to worry about that. This advanced indicator automatically highlights these crucial zones for you, giving you the confidence to enter the market at the right time. MT5 Version -  https://www.mql5.com/en/market/product/123362/ Key Features of Order Block
Smart Liquidity Levels is a valuable tool for identifying optimal liquidity levels, enabling retail traders like us to strategically set our stop-loss orders. T he essential tool for traders seeking to maximize their trading success.  The liquidity level is a critical component of inner circle trading (ICT). It assists us in determining when and how we should enter the market. Watch the video for detailed instructions. Here's why understanding liquidity levels is crucial in trading and how our
We mark the fair value gap (FVG) and wait for the price to reach that zone, but sometimes it reverses before getting there. This can happen because we didn't notice the Balanced Price Range (BPR). My tools will enhance your analysis by displaying everything on the chart, helping you identify potential price reversal areas so you can make informed decisions about when to enter the market. MT5 -  https://www.mql5.com/en/market/product/119228/ So, what is BPR or Balanced Price Range? A Balanced Pr
Higher Timeframe Chart Overlay will display higher timeframe candles, including the number of candles high/low you specify. You no longer need to switch timeframes to check the candles. Everything can be shown in one chart. MT4 Version :  https://www.mql5.com/en/market/product/115680 Almost everything can be change as you want. You can change/set: - Choose different colors for the body and top/bottom wicks. - Panel's height and width. - The width of the body and wicks - Change background an
Higher Timeframe Chart Overlay will display higher timeframe candles, including the number of candles high/low you specify. You no longer need to switch timeframes to check the candles. Everything can be shown in one chart. Get Full Version -  https://www.mql5.com/en/market/product/115680 Please feel free Contact me if you have any questions regarding    this tool. 
FREE
フィルタ:
Joshua Hollings
23
Joshua Hollings 2023.01.28 19:18 
 

ユーザーは評価に対して何もコメントを残しませんでした

Suvashish Halder
174352
開発者からの返信 Suvashish Halder 2023.01.28 19:23
Thank you for your trust 💚
Juan Feliciano
1731
Juan Feliciano 2023.01.23 20:27 
 

Really good indicator. Great customer service

Suvashish Halder
174352
開発者からの返信 Suvashish Halder 2023.01.24 02:49
Thank you for your trust 💚
MrShuvo
31
MrShuvo 2023.01.17 17:25 
 

A Perfect Indicator. Excellent support.

Suvashish Halder
174352
開発者からの返信 Suvashish Halder 2023.01.24 02:49
Thank you for your trust 💚
レビューに返信