BPR and FVG Zones
- インディケータ
- バージョン: 1.0
- アクティベーション: 10

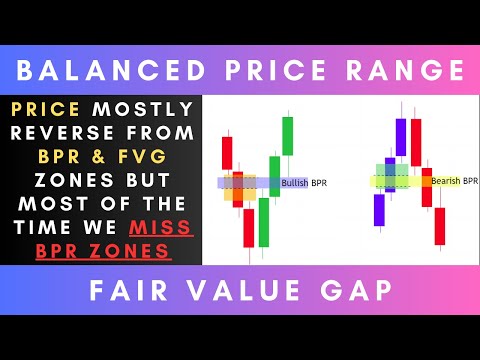
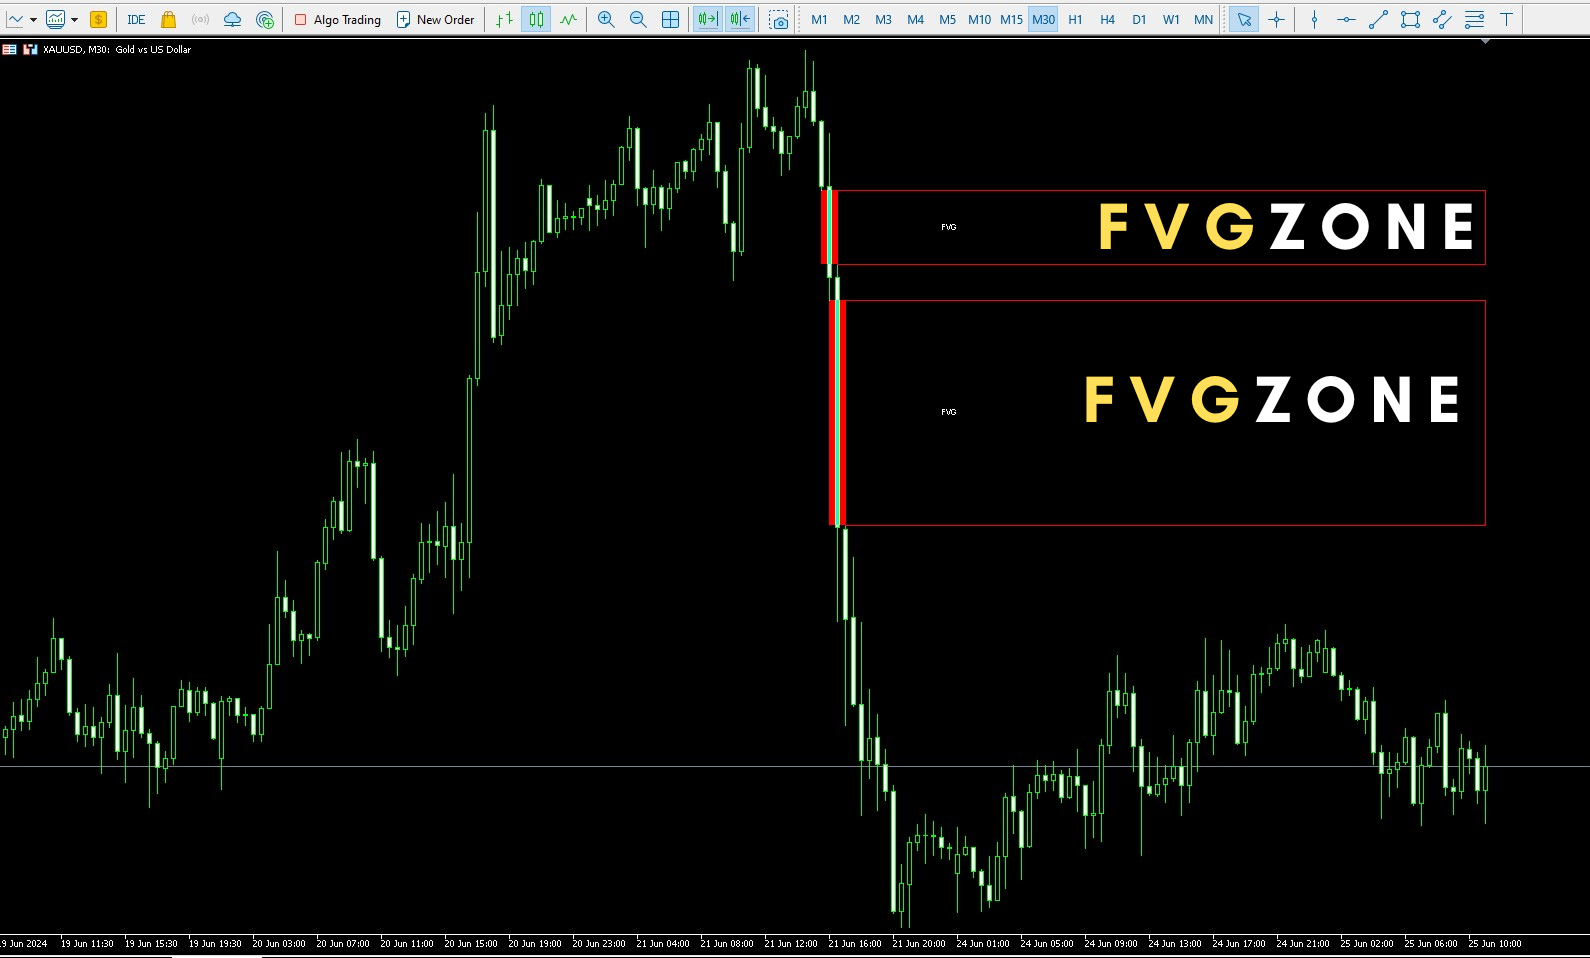
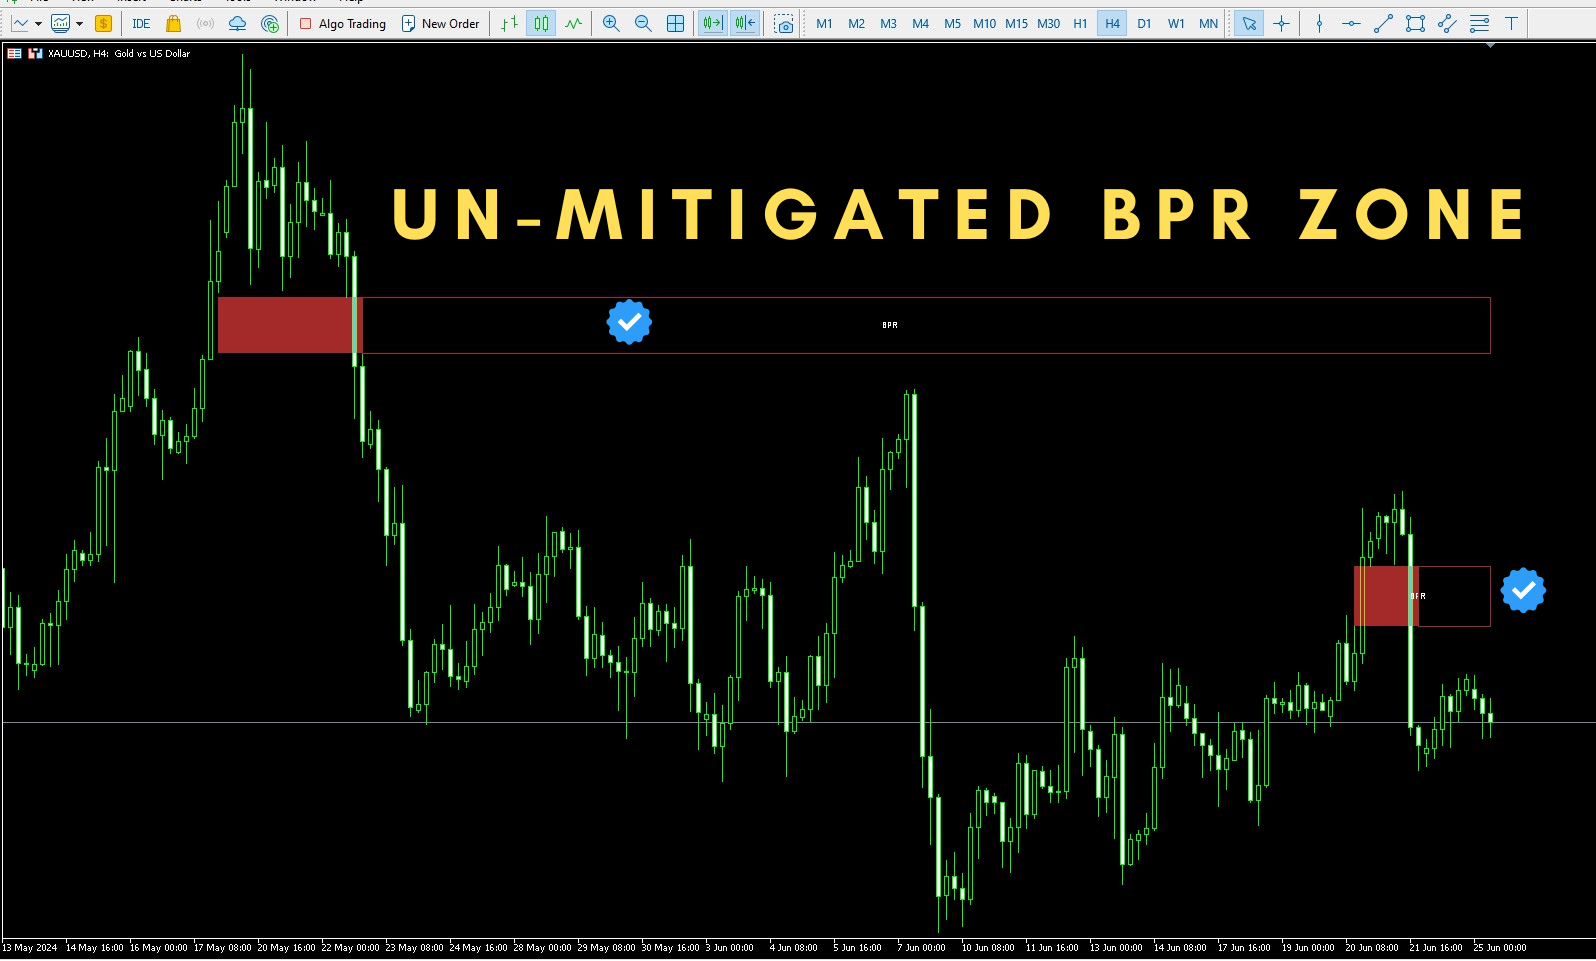
We mark the fair value gap (FVG) and wait for the price to reach that zone, but sometimes it reverses before getting there. This can happen because we didn't notice the Balanced Price Range (BPR). My tools will enhance your analysis by displaying everything on the chart, helping you identify potential price reversal areas so you can make informed decisions about when to enter the market.
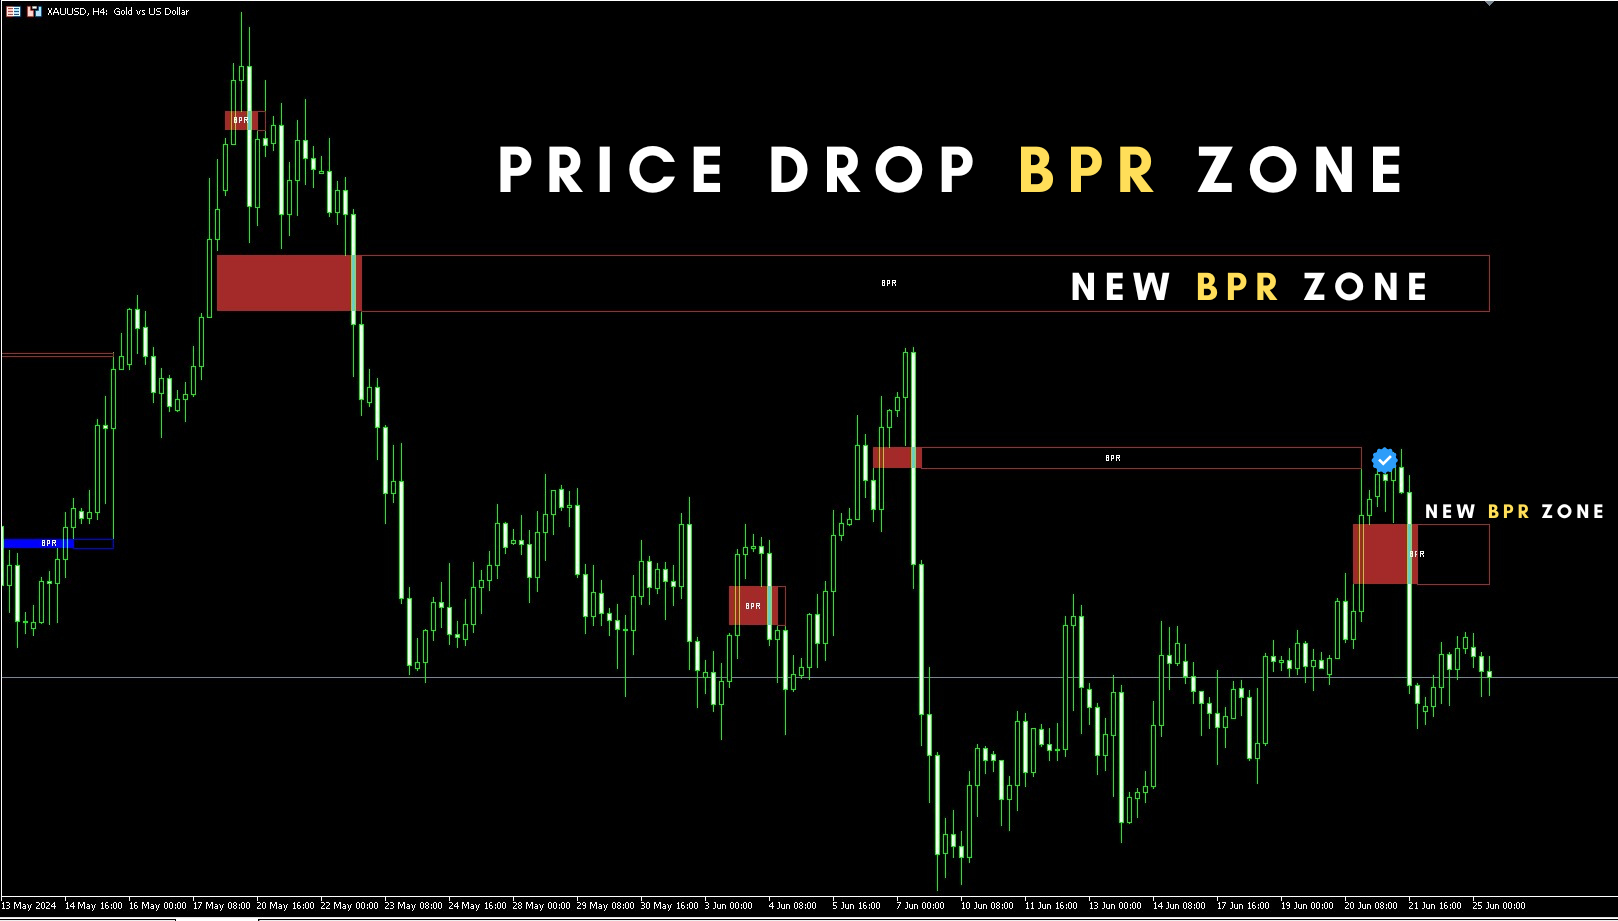
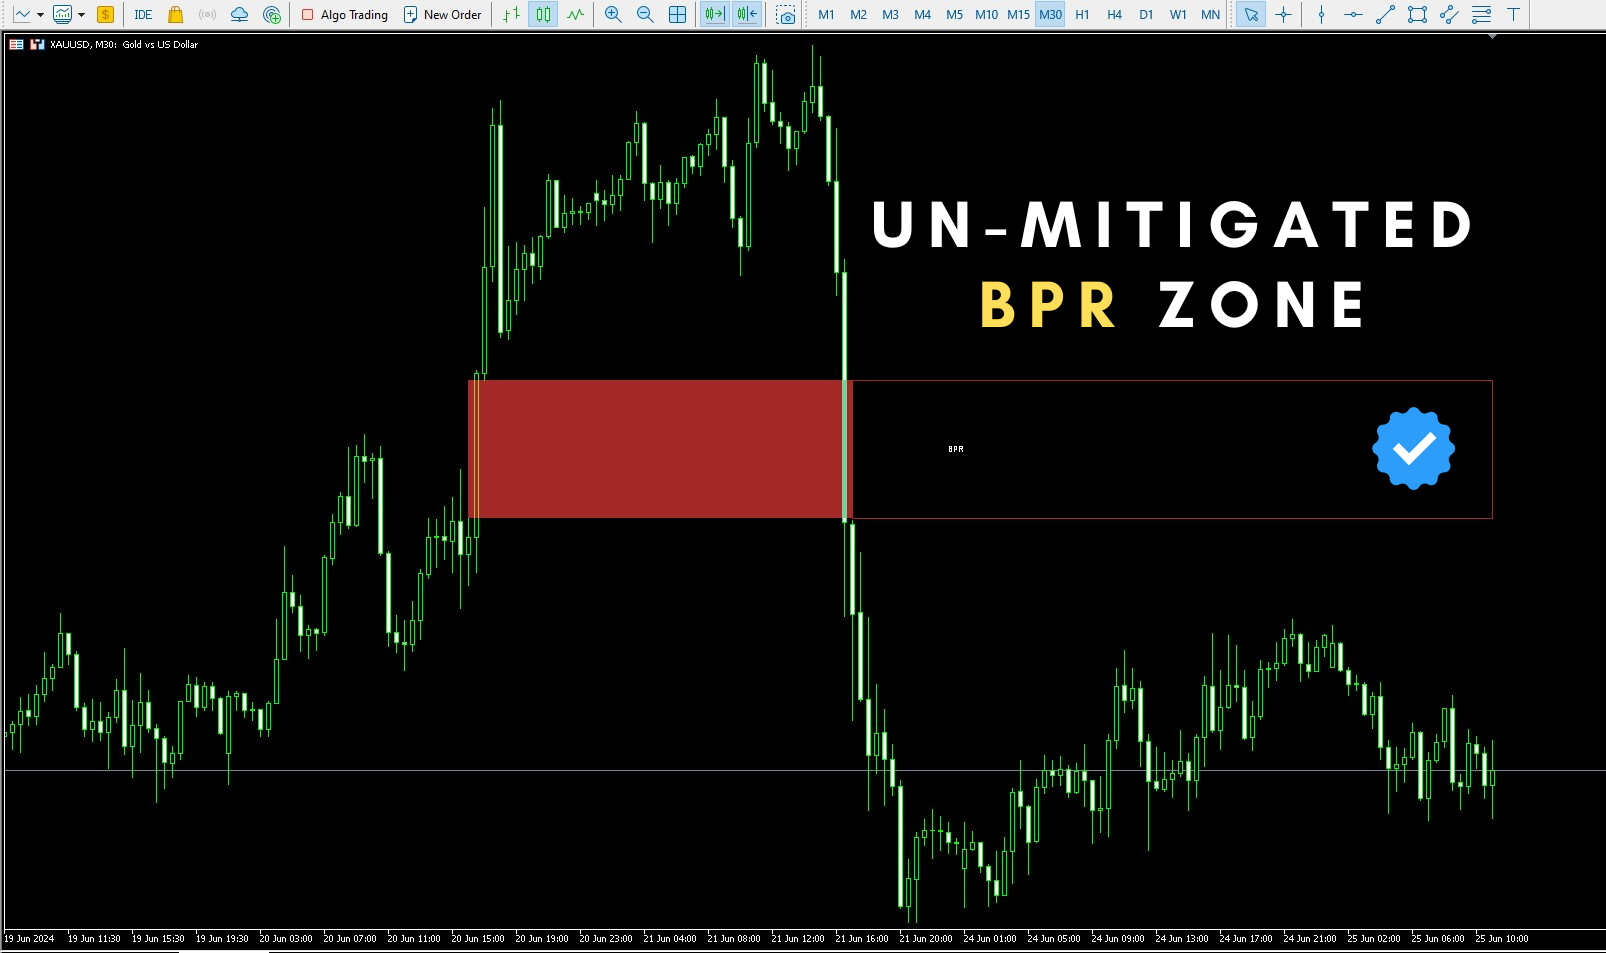
So, what is BPR or Balanced Price Range? A Balanced Price Range occurs when a price rapidly rises and then just as quickly falls. This creates two "fair value gaps," which are areas where the price tends to linger. These gaps often attract the price back to them before it makes its next move up or down.
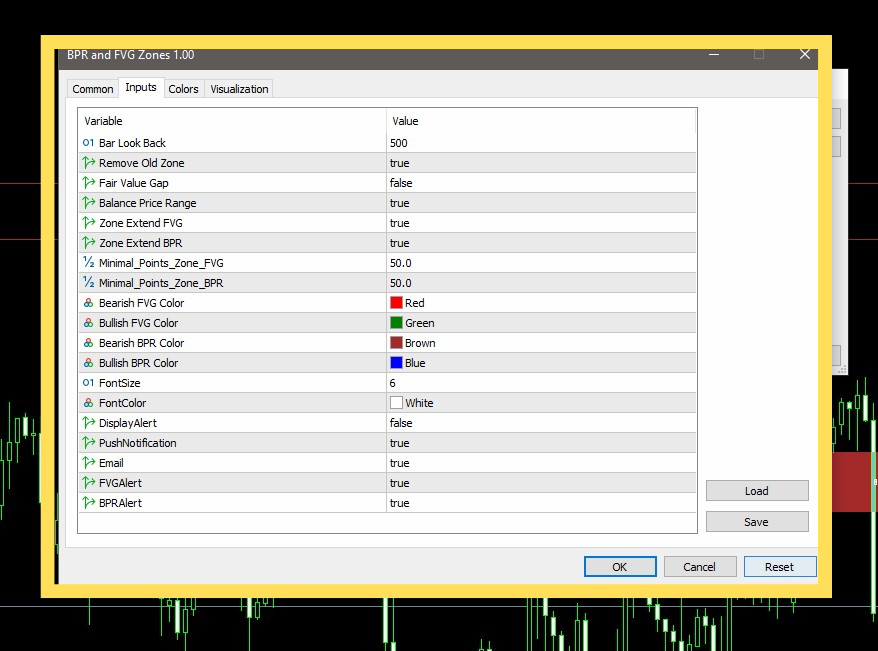
For more details, you can watch the video or check the attached screenshot. I’ve also added an alert feature that notifies you when the price touches FVG or BPR zones.
If you encounter any issues with this indicator, please feel free to contact me.


I bought this indicator and its fantastic! Mr Halder I wnat to contact you for the "Volume Delta Candles" Indicator.. Many Thanks