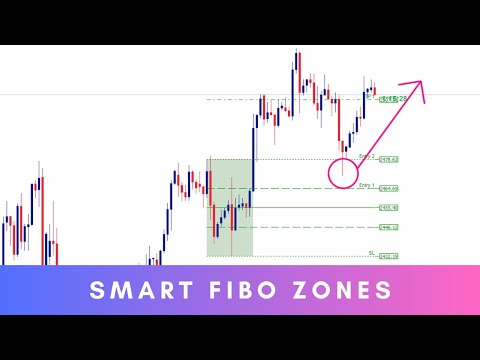
Smart Fibo Zones
- インディケータ
-
Suvashish Halder
 💧 PRO TIP - Don't Open Orders Where You See, Open Them Where Others Can't!
📈 Decoding Market Phases Like Never Before – The SuvashishFx Revolution! - バージョン: 2.0
- アップデート済み: 29 8月 2024
- アクティベーション: 10
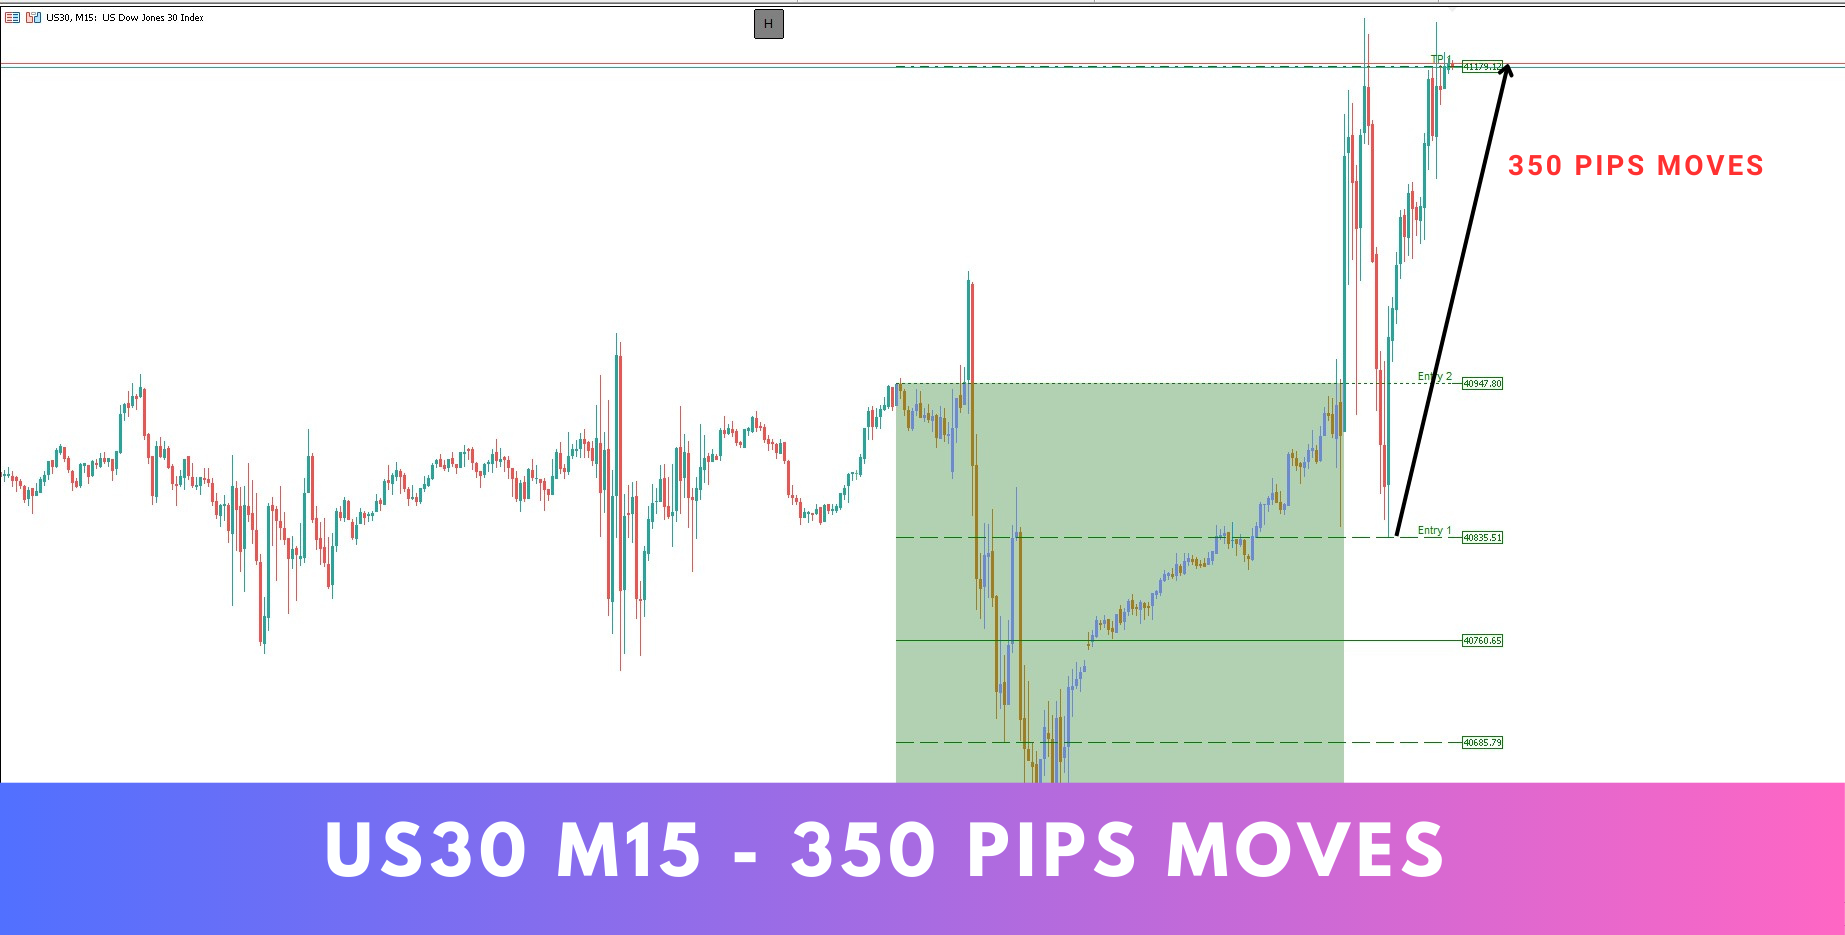
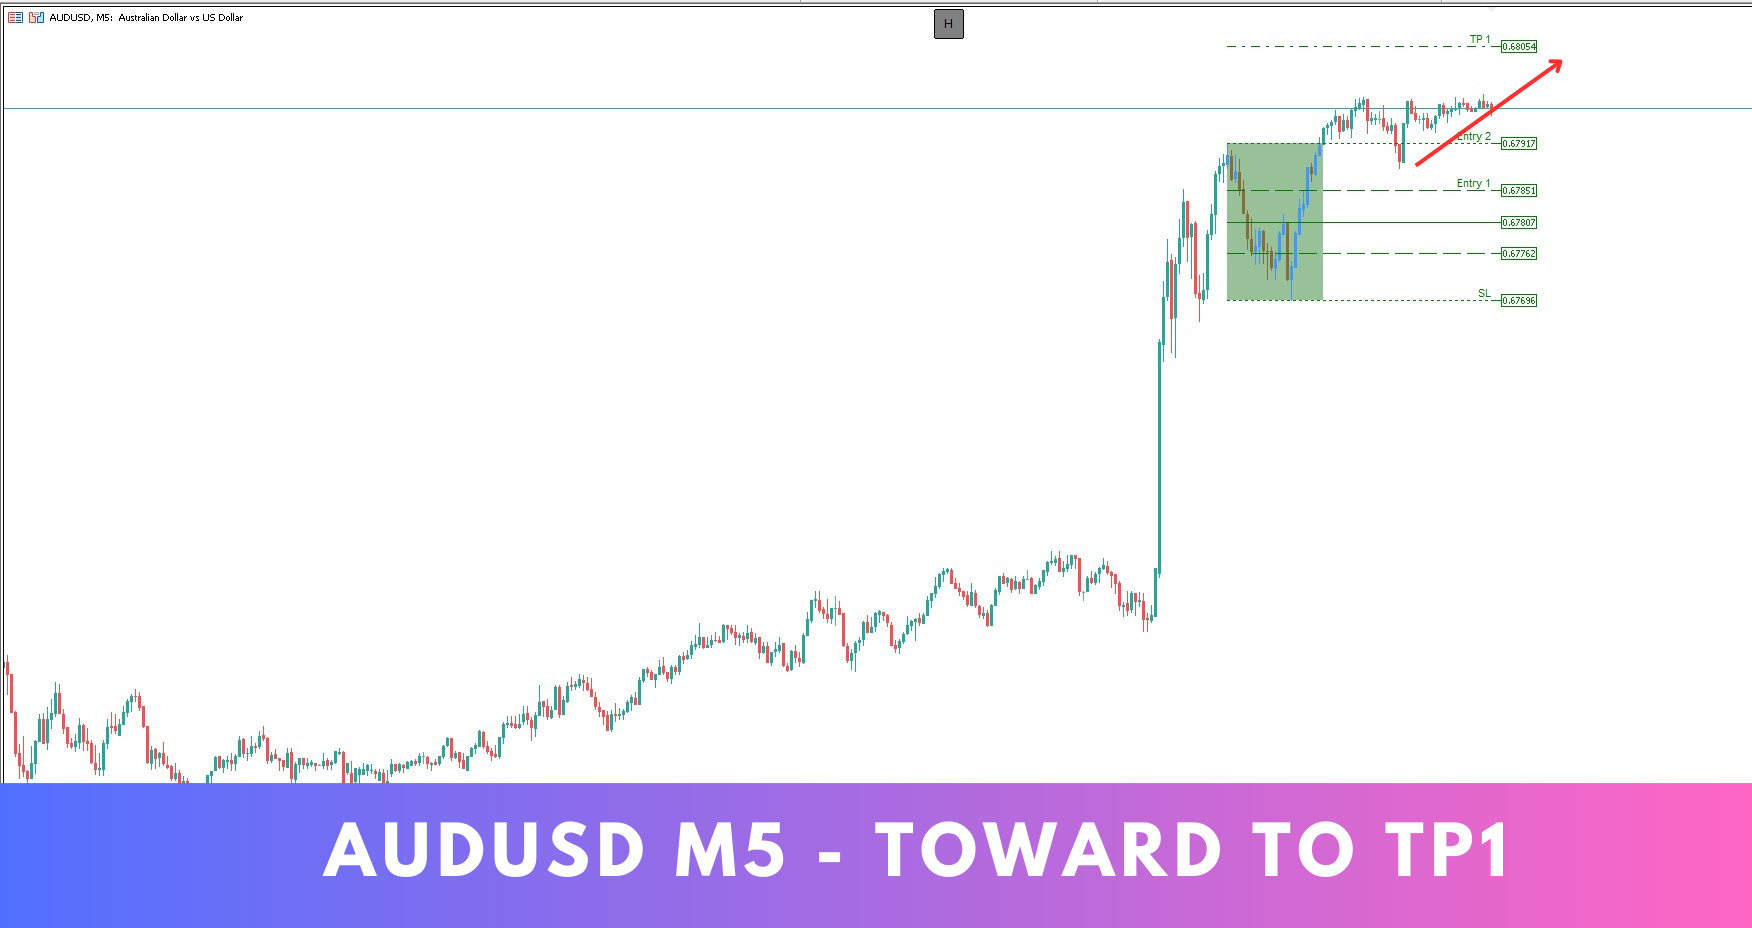
Smart Fibo Zones are powerful, auto-generated Fibonacci Retracements that are anchored to key market structure shifts. These zones serve as critical Supply and Demand levels, guiding you to identify potential price reactions and confirm market direction. Fibonacci calculations, widely used by professional traders, can be complex when it comes to identifying highs and lows. However, Smart Fibo Zones simplify this process by automatically highlighting order blocks and key zones, complete with Stop Loss, Take Profit, and Entry Price levels.
MT5 Version - https://www.mql5.com/en/market/product/122192
🔑 Key Features:
-
Strategic Retracement Levels: Smart Fibo Zones are drawn exclusively from significant market structure shifts, such as Break of Structure (BOS) or Change of Character (CHoCH). This ensures that retracements focus only on the most crucial areas, enhancing their relevance and impact.
-
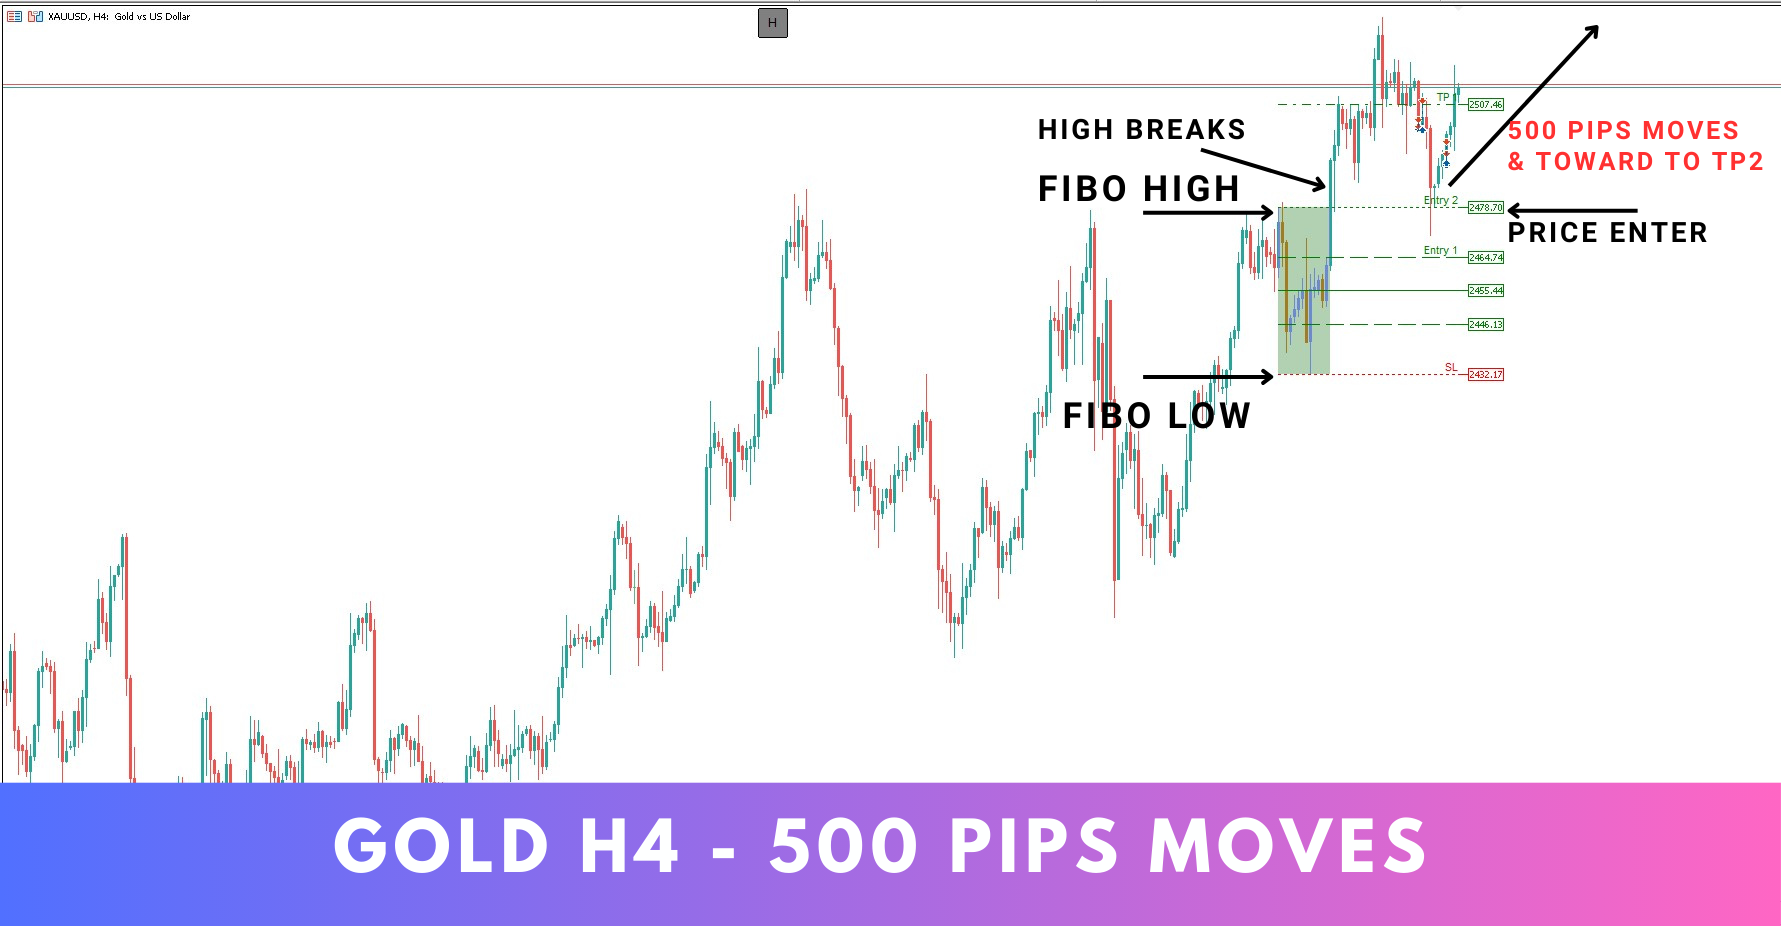
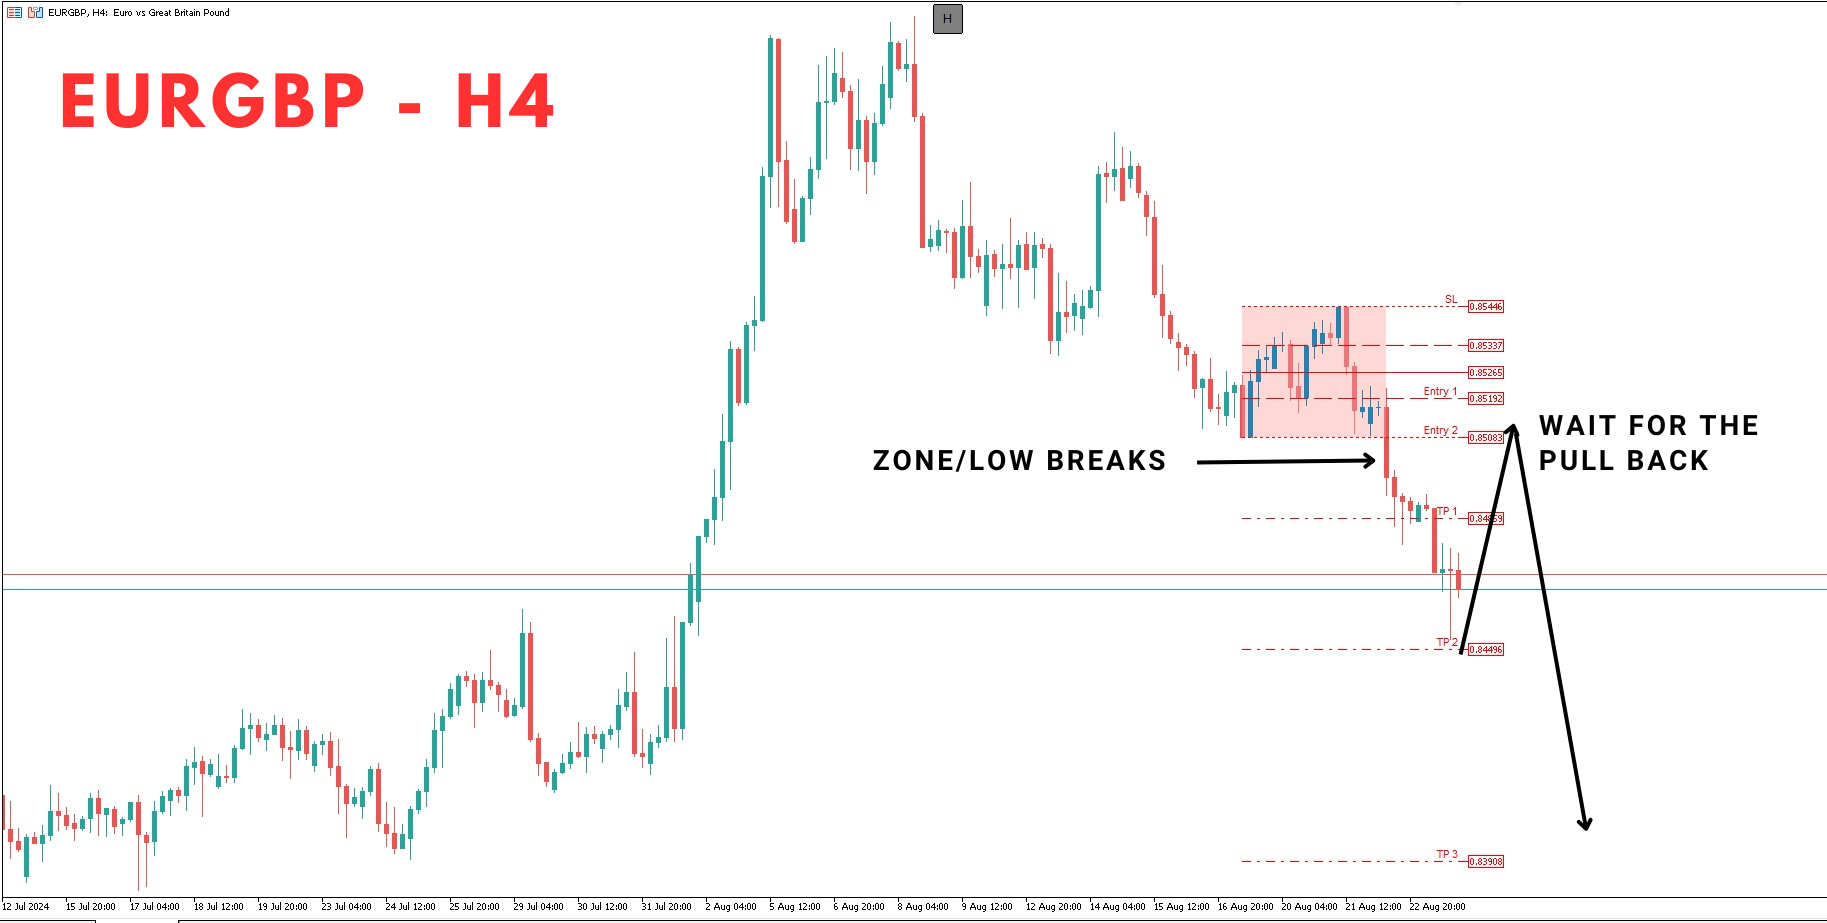
Dynamic Market Structure Shifts: When price breaks above or below a specific swing point, a retracement is automatically generated, spanning from the point of break to the highest or lowest point since that shift. These retracements are designed to be responsive, but not all are immediately actionable, depending on market conditions.
-
Visual Swing Point Identification: Key swing points are clearly marked with shapes above or below the relevant swing high or low candle, making it easy to spot potential areas of interest.
-
Comprehensive Fibonacci Levels: Display up to 8 customizable Fibonacci levels within each zone. Each level can be tailored with options for display, value, line style, and color, giving you full control over how the zones are presented.
-
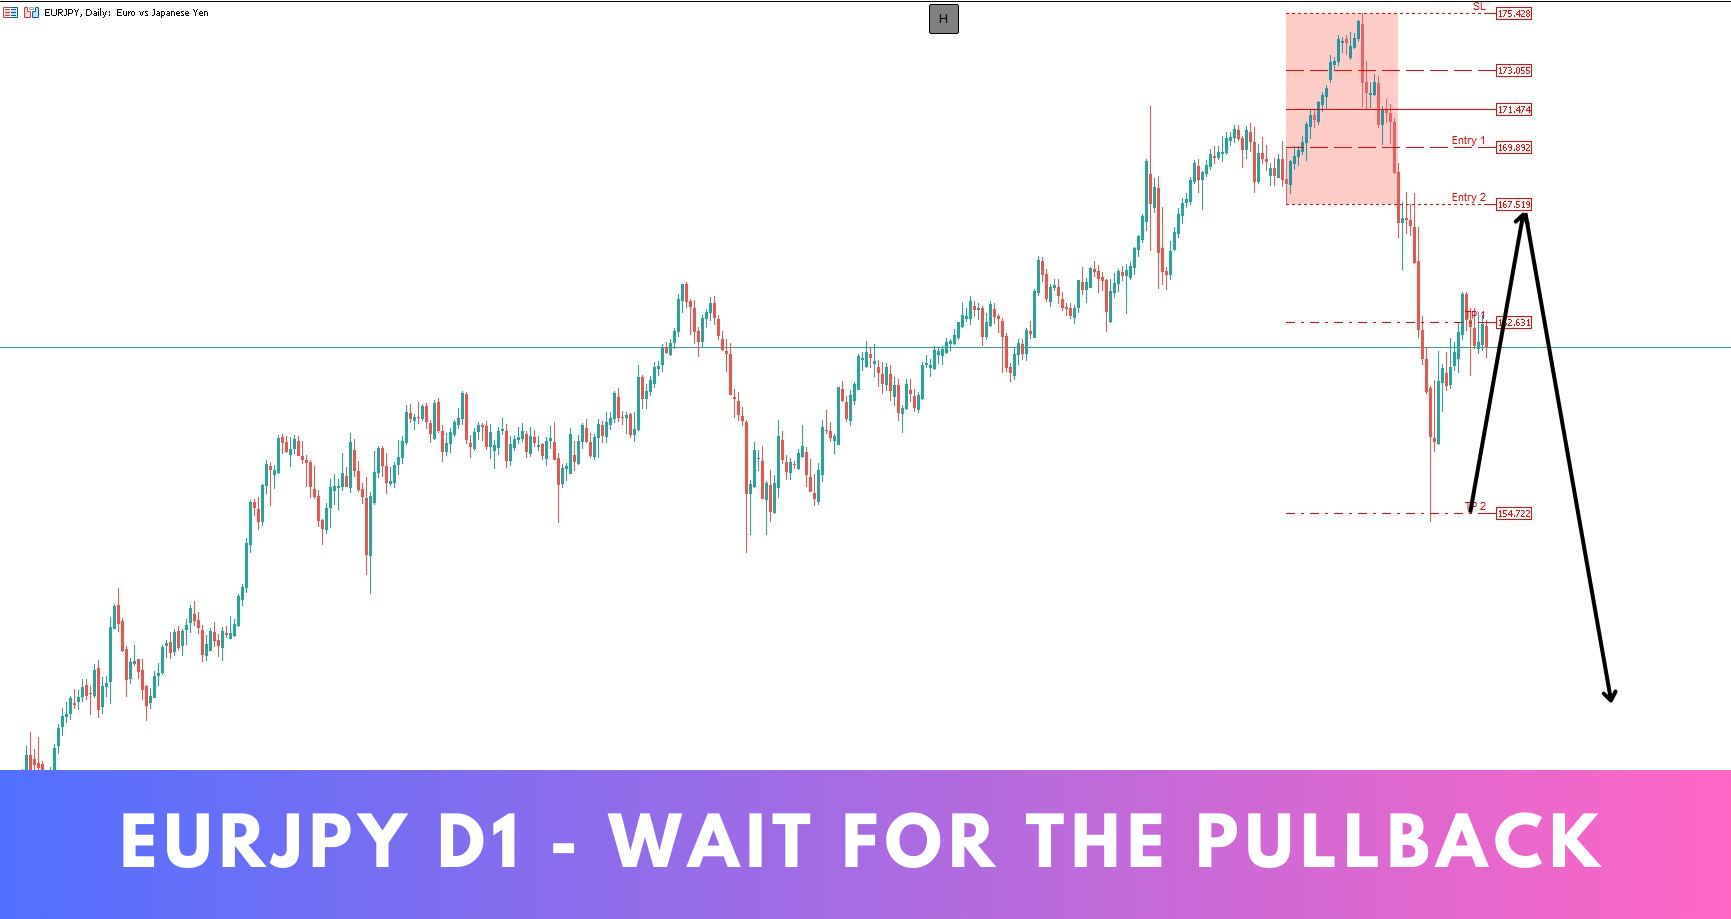
Complete Trading Strategy Support: Each zone includes Stop Loss, Entry Points, and Take Profit areas, offering a full framework to plan your trades effectively.
-
Directional Sensitivity: Fibonacci calculations adjust based on market direction. In Bullish zones, the retracement is drawn from 0 at the bottom to 1 at the top, while in Bearish zones, this is reversed.
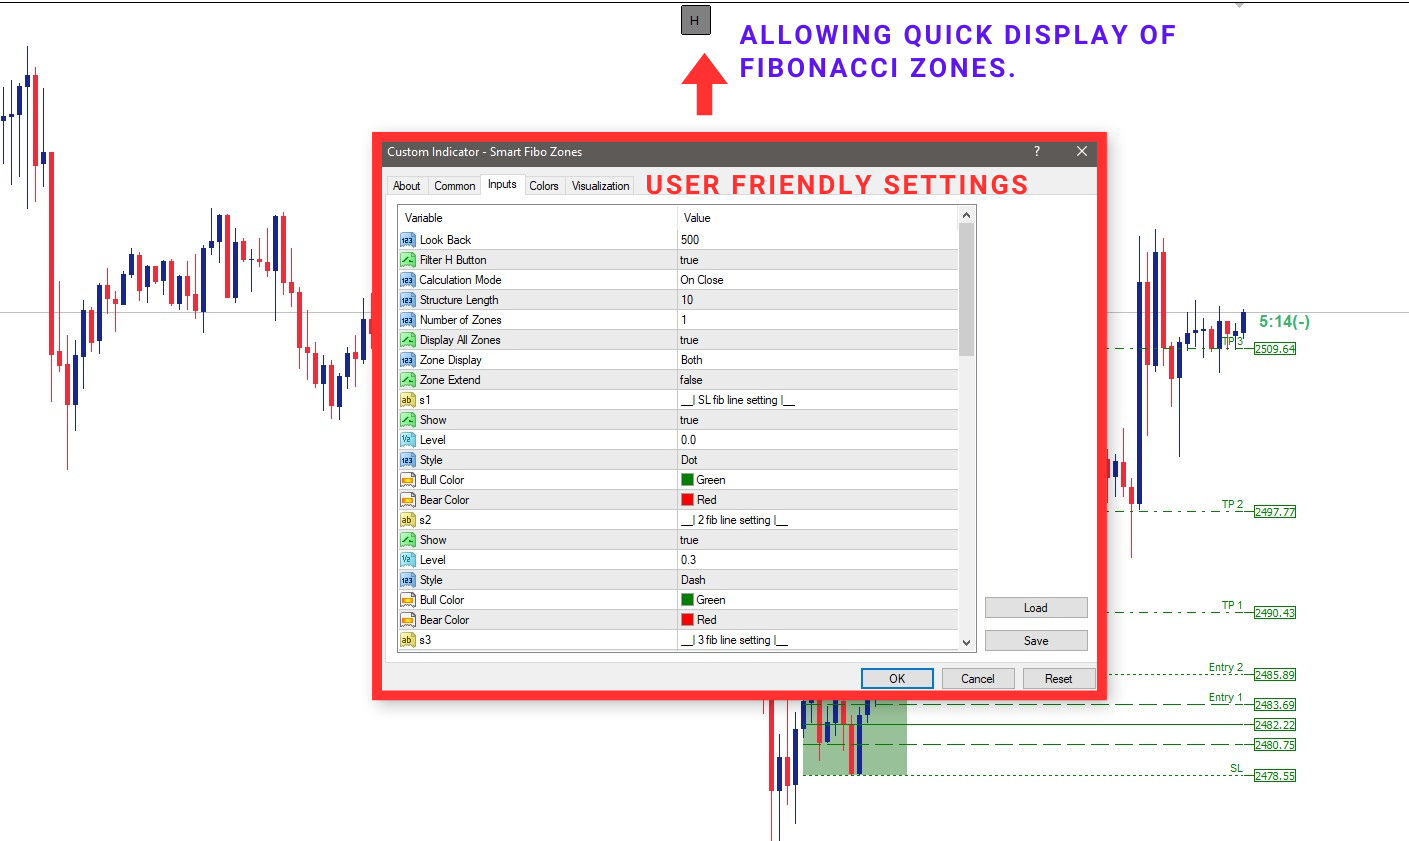
⚙️ Settings Overview:
-
Look Back: Analyzes the last 500 candles to identify significant market structure shifts.
-
Filter H Button: Toggle True/False to show the H button on the chart, allowing quick display of Fibonacci zones.
-
Calculation Mode: Choose between Wick and Close. Selecting Wick alerts you when the price touches the Fibonacci zone, while Close alerts when the candle closes within the zone.
-
Structure Length: Defines the SMC structure length for identifying Market Structure Shifts.
-
Zone Number: Displays a specified number of retracement zones.
-
Zone Display: Choose to display only Bearish, only Bullish, or Both types of zones.
-
Fib Levels: Fully customize and display up to 8 Fibonacci levels for each zone, tailoring them to fit your trading strategy.
Smart Fibo Zones aren't just another Fibonacci tool—they are a sophisticated, market-sensitive approach to understanding and capitalizing on market movements, giving you the edge in your trading decisions.
Feel free to contact me if you need any assistance.


Simple easy to use indicator. Great product.