Point Directions
- 지표
- 버전: 1.50
- 업데이트됨: 26 9월 2025
- 활성화: 10

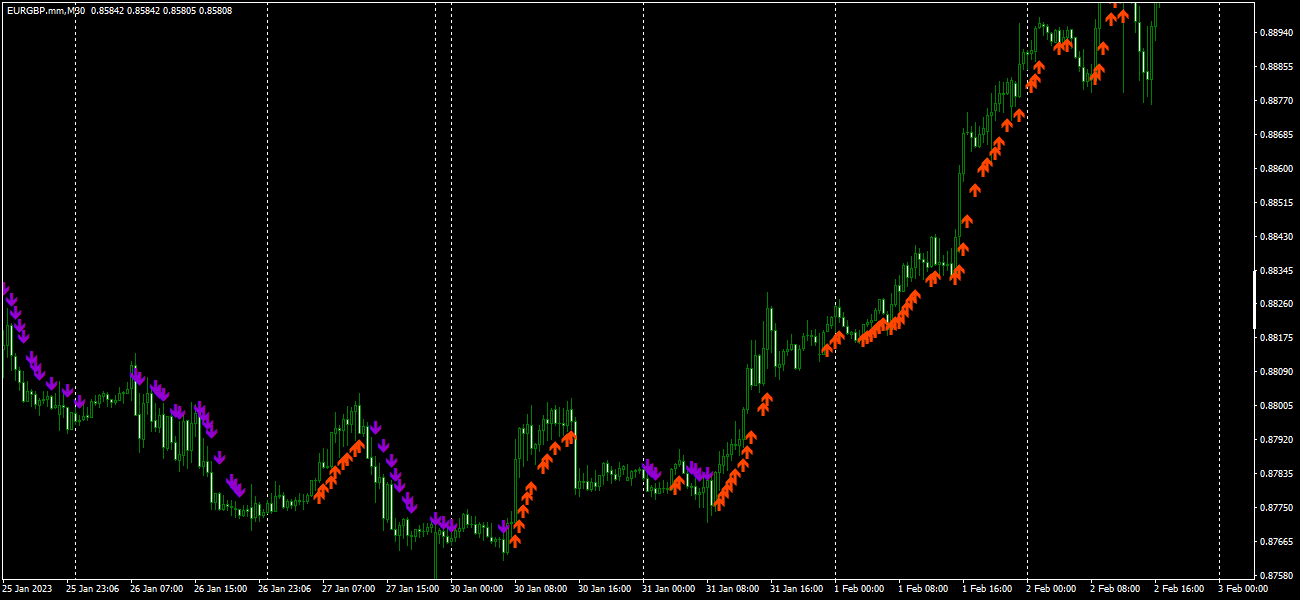
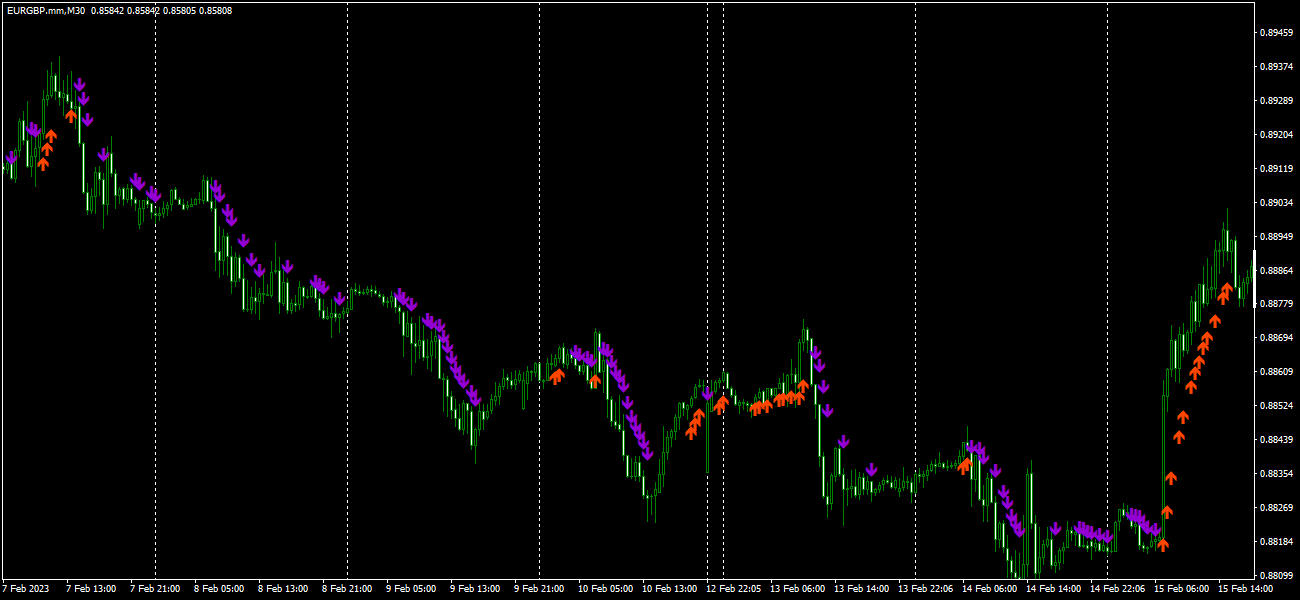
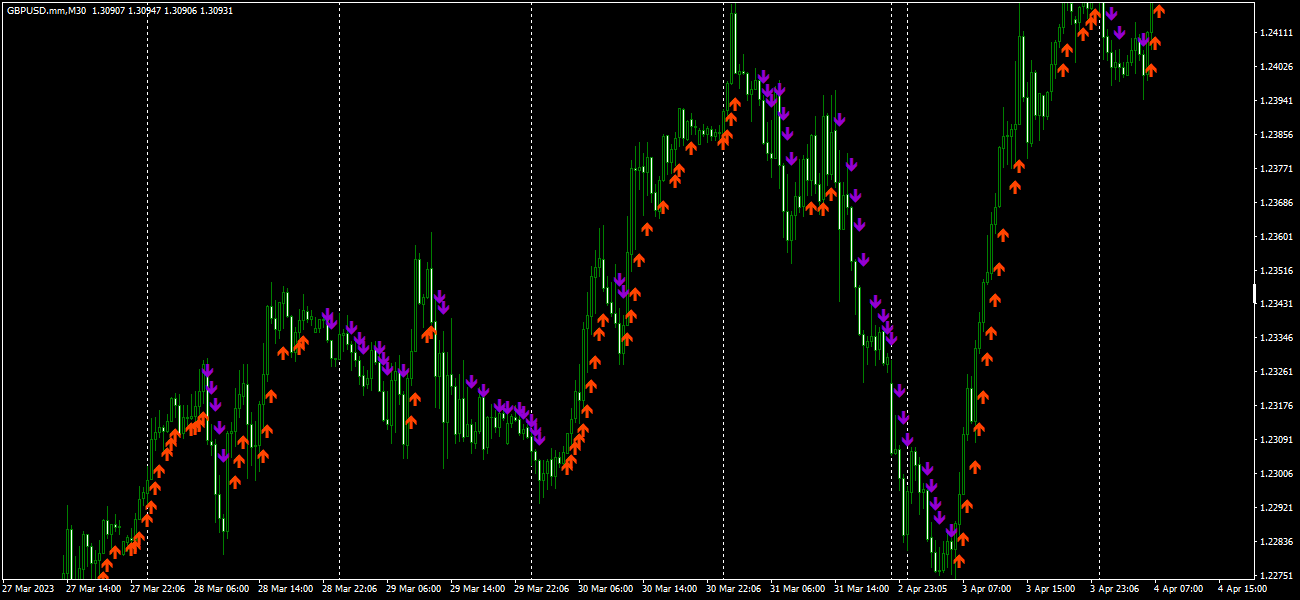
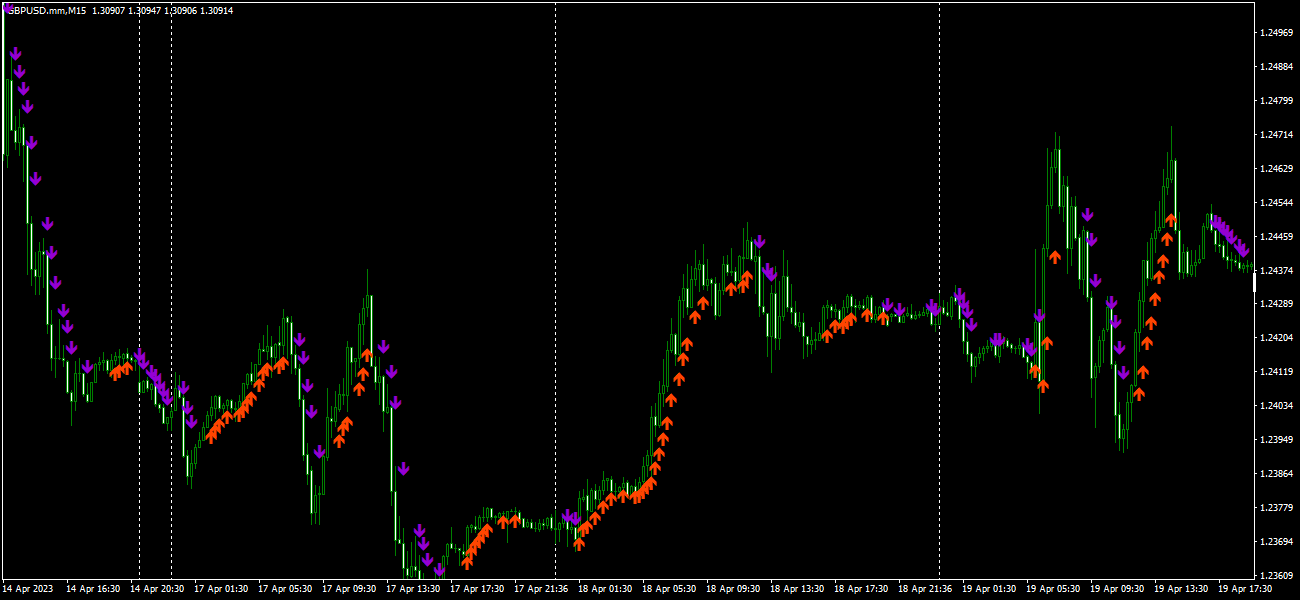
Point Directions – 가격 변동 중 포인트 지지선과 저항선을 표시하는 지표입니다. 화살표는 지정된 방향으로 가격이 반등할 때를 나타냅니다.
화살표는 다시 그려지지 않으며 현재 캔들을 기준으로 형성됩니다. 모든 시간대와 거래 상품에서 작동합니다. 여러 유형의 알림을 사용할 수 있습니다.
모든 차트에 대한 신호를 사용자 정의할 수 있는 고급 설정이 있으며, 추세 및 조정 거래에 맞게 구성할 수 있습니다.
화살표를 표시하려면 두 가지 유형의 이동 평균선과 화살표 강도 수준을 사용할 수 있습니다. 자세한 설정은 입력 매개변수에 설명되어 있습니다.
사용 관련 문의는 비공개 메시지를 보내주세요.
입력 매개변수
화살표는 다시 그려지지 않으며 현재 캔들을 기준으로 형성됩니다. 모든 시간대와 거래 상품에서 작동합니다. 여러 유형의 알림을 사용할 수 있습니다.
모든 차트에 대한 신호를 사용자 정의할 수 있는 고급 설정이 있으며, 추세 및 조정 거래에 맞게 구성할 수 있습니다.
화살표를 표시하려면 두 가지 유형의 이동 평균선과 화살표 강도 수준을 사용할 수 있습니다. 자세한 설정은 입력 매개변수에 설명되어 있습니다.
사용 관련 문의는 비공개 메시지를 보내주세요.
입력 매개변수
- Method MA – 화살표 생성에 이동 평균을 사용할지 선택합니다(표준 또는 가속).
- Accelerated MA period/Standard MA period – 이동 평균 기간(5~500)을 변경합니다.
- Ma Metod –이동 평균 방식을 변경합니다.
- Ma Price – 이동 평균 가격을 변경합니다.
- Arrow Intensity - 화살표 강도(값이 커질수록 증가)
- Arrow thickness - 화살표 두께
- Sell arrow color/Buy arrow color - 화살표 색상
- play sound / display message / send notification / send email - 신호 지점이 나타나면 알림을 사용합니다.
- Sound file signal arrows - 신호 화살표의 사운드 파일입니다.

ITS GREAT Product Its Arrow Gives siganal like magic