Смотри обучающее видео по маркету на YouTube
Как купить торгового робота или индикатор
Запусти робота на
виртуальном хостинге
виртуальном хостинге
Протестируй индикатор/робота перед покупкой
Хочешь зарабатывать в Маркете?
Как подать продукт, чтобы его покупали
Торговые роботы и индикаторы для MetaTrader 5 - 51
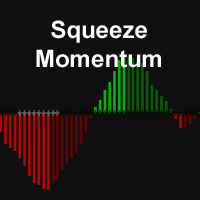
The Squeeze Momentum Indicator, identifies periods of low volatility ("squeeze") when Bollinger Bands are inside the Keltner Channel, marked by black crosses on the midline. This suggests the market is preparing for a significant move.
Gray crosses indicate a "squeeze release," signaling potential breakout. To use it, wait for the first gray cross after a black cross, then enter a trade in the direction of momentum (long if above zero, short if below). Exit when momentum shifts (color change i
FREE
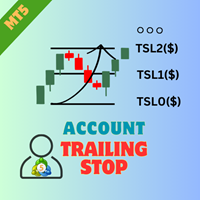
Улучшите управление рисками вашего портфеля с помощью Account Trailing Stop Manager MT5 — мощного экспертного советника (EA), предназначенного для автоматического отслеживания и трейлинга общей прибыли по счету или сделкам с определенным магическим номером на платформе MetaTrader 5, закрывая все сделки, когда текущая прибыль падает ниже последнего пика прибыли. Высоко ценится на MQL5, Forex Factory и Reddit’s r/Forex за свой динамический механизм фиксации прибыли, этот EA популярен среди скальпе
FREE
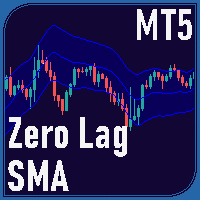
Zero Lag SMA для MT5 Индикатор Zero Lag SMA (ZLSMA) для MT5 представляет собой модификацию простой скользящей средней (SMA), разработанную для минимизации запаздывания, что позволяет быстрее реагировать на изменения цен. Это делает его полезным для определения потенциальных разворотов тренда и ключевых уровней цены своевременно. Основные характеристики: Расчет без запаздывания : В основе этого индикатора лежит метод двойного сглаживания, который уменьшает запаздывание, обеспечивая более быструю
FREE

Trend Dashboard / Trend Scanner – Smart Multi-Timeframe Tool Our Trend Dashboard is an advanced tool for trend analysis that allows you to monitor multiple symbols and timeframes in one place. It displays the current trend direction on popular intervals such as M1, M5, M15, M30, H1, H4, and D1, enabling traders to quickly assess market conditions without manually checking multiple charts. Features: Trend indicators for multiple timeframes in a single dashboard Color-coded trend display: bullish,
FREE

Make Your Own Strategy. Master Strategy expert advisor is designed for traders who want complete features and create their own strategies. For those who do not have their own strategy, we provide a strategy setfile that can be downloaded below. Some of the features we provide are:
Signal Features : MFI Force Index De Marker WPR CCI RSI Stochastic Bollinger Bands Moving average PSAR Fractal MACD ADX Engulfing candle Always ON
Trade Management : SL and TP (individual trade) Basket SL and TP Trai
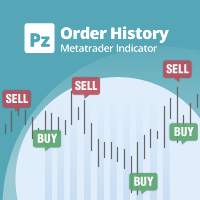
Индикатор общего назначения, отображающий историю сделок/ордеров любого живого графика, очень похожий на визуальный режим тестера стратегий. Это позволяет вам изучить реальную торговую историю любого конкретного символа в образовательных, улучшенных, обратно-инжиниринговых или диагностических целях. Его можно успешно использовать как с мастер-паролем, так и с паролем инвестора.
[ Руководство по установке | Руководство по обновлению | Устранение неполадок | Часто задаваемые вопросы | Все продукт
FREE
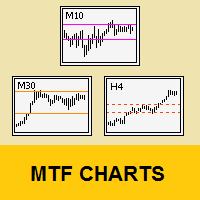
Tool that allows viewing more than one timetime in the same window (up to 3 timeframes). Then, the tool helps the analysis in multiple timesframes.
This is another product developed by Renato Fiche Junior and available to all MetaTrader 5 users!
Input Parameters
- Timeframes 1, 2 and 3: Timeframes of sub-charts
- Show Dates: Shows the dates on the sub-charts on the X-axis (Yes / No)
- Show Prices: Shows on the Y-axis the prices in the sub-charts (Yes / No)
- Show Subwindow: Shows the s
FREE
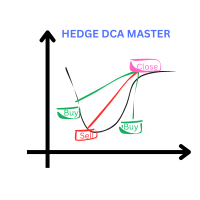
Wealth gained hastily will dwindle, but whoever gathers little by little will increase it.
This Expert is using DCA and Hedging Strategy. Live Account with startlot 0.04 : Hedge DCA Master HighRisk x4
Live Account with Middle Risk and recovery from loss other EA : https://www.mql5.com/en/signals/2289704
www.myfxbook. com/portfolio/hedge-dca-master/11230507 delete space before com I cut the loss and change the demo to Gold m15 because more happening on gold pair
The Key point: Use my cu
FREE

Smoothed Supertrend Indicator - Индикатор тренда на основе волатильности с функцией сглаживания Smoothed Supertrend Indicator - это усовершенствованный вариант классического индикатора Supertrend для MetaTrader 5. Благодаря интеграции дополнительной функции сглаживания, рыночный шум уменьшается, а качество трендовых сигналов улучшается. Техническое описание: Индикатор основан на Average True Range (ATR) для измерения рыночной волатильности и сочетает его со сглаживанием ценовых данных скользяще
FREE

Обзор Epicus Prime: Epicus Prime - это первоклассное, усовершенствованное, выдающееся, уникальное и исключительное решение в мире алгоритмической торговли. В сфере торговли на рынке Форекс Epicus Prime спроектирован таким образом, чтобы справляться со значительными задачами и исключительно хорошо работать в контексте торговли, отличаясь высокой производительностью, точностью и надежностью, что позиционирует его как ведущий, заметный и надежный вариант для трейдеров.

Gold Range Breakout Bot for MetaTrader 5 This Expert Advisor trades based on a defined price range between 3:00 and 6:00 AM server time on XAUUSD. When the price breaks out of this range, a single trade is triggered — either long or short. The trade automatically closes at 6:55 PM. A fixed stop loss of 1% is used. The strategy follows a time-based logic with daily resets and no overnight exposure. No indicators are required. Built using structured conditions and tested logic for controlled execu
FREE

Click and Go Trade Manager: The Ultimate MT5 Execution Suite Precision Execution. Professional Performance Tracking. Total Control. In the world of Smart Money Concepts (SMC) , ICT, and high-frequency scalping, precision is your only edge. Most traders lose not because their analysis is wrong, but because their execution is slow and their psychology is undisciplined. The Hard Truth: If you are still manually calculating lot sizes or dragging lines while the price moves against you, you

Этот полезный Экспертный Советник использует индикатор Parabolic SAR для динамической установки и трейлинга уровня Стоп-Лосс (SL) открытых ордеров, обеспечивая защиту прибыли и минимизируя ручное управление сделками. Ключевые особенности Динамическая корректировка SL: Советник автоматически корректирует Стоп-Лосс (SL) любой открытой позиции до уровня, указанного текущей точкой Parabolic SAR, на каждом новом баре. Защита при следовании за трендом: Обеспечивает точное следование SL за ценой во вре
FREE

PipsCounter Basic — это индикатор для MetaTrader 5, который в реальном времени отображает изменение позиций в пунктах и предоставляет ежедневное резюме по закрытым сделкам. Вся информация выводится непосредственно в основном окне графика в понятном и ненавязчивом формате. Возможности Отслеживание пунктов в реальном времени
Непрерывное обновление разницы в пунктах для каждой активной позиции на каждом тике рынка. Ежедневный итог в пунктах
Отображает чистое значение в пунктах по всем закрытым сд
FREE
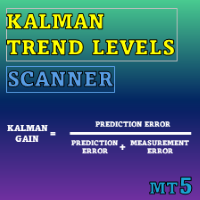
Special offer : ALL TOOLS , just $35 each! New tools will be $30 for the first week or the first 3 purchases ! Trading Tools Channel on MQL5 : Join my MQL5 channel to update the latest news from me Kalman Trend Levels — это продвинутый индикатор следования за трендом, который использует передовую технологию фильтра Калмана для предоставления трейдерам мощных аналитических сигналов. Разработанный для точности и адаптивности, этот инструмент не только выявляет ключевые зоны поддержки

APICT Chart Patterns – Trend Line & Pattern Recognition for MT5 Enhance your technical analysis with the APICT Chart Patterns Indicator — an advanced tool for automatic pattern and trend line detection in MetaTrader 5. Key Features Automatic Pattern Detection: Identifies over 10 classic chart patterns, including pennants, wedges, channels, and double tops/bottoms. Real-Time Trend Lines: Draws support and resistance lines using smart algorithms. Custom Sensitivity: Adjust detection for major or
FREE

1. Overview The Ichimoku Kinko Hyo (or Ichimoku Cloud) is a comprehensive, all-in-one technical analysis indicator designed to provide a deep understanding of market trends, momentum, and dynamic support and resistance levels. This indicator provides a clean, standard implementation of the five core Ichimoku lines. Its key feature is a non-intrusive Status Dashboard that gives you an at-a-glance summary of the current market situation according to the Ichimoku system, allowing for quick and effi
FREE
Forex Trade Manager Grid MT5 helps you to managing orders and achieve the goal. You only need to place first order with Take Profit, run EA and set in params profit (pips) you want to get. EA will be managing your positions, as will gather appointed amount of pips. It’s a strategy for management of manual trades opened on current pair. The strategy adds positions to currently opened trades in a grid management (with chosen distance in pips between trades) - up to 15 trades (or less). First up to
FREE
Candle Countdown Pro – Real-Time Timeframe & Spread Tracker Love it? Hate it? Let me know in a review! Feature requests and ideas for new tools are highly appreciated. :) Try "The AUDCAD Trader":
https://www.mql5.com/en/market/product/151841 Never miss a candle close again! Candle Countdown Pro is an essential trading tool that displays real-time countdowns for multiple timeframes,
live spread monitoring , and key trading information—all in one clean, customizable panel.
Key Features:
FREE

Ultimate MACD MTF Pro — это мощная, обновленная версия классического MACD, переработанная для современной торговли. Этот индикатор предлагает мульти-таймфрейм MACD, динамические цвета гистограммы, маркеры сигналов пересечения и умную смену цвета линий в зависимости от моментума. Создан для трейдеров, которым нужны чистые сигналы, раннее определение тренда и визуальная ясность профессионального уровня. Ключевые особенности Мульти-таймфрейм MACD (MTF) Легко переключайтесь между текущим таймфр
FREE

Highly configurable Trader Dynamic Index (TDI) indicator.
Features: Highly customizable alert functions (at levels, crosses, direction changes via email, push, sound, popup) Multi timeframe ability (higher and lower timeframes also) Color customization (at levels, crosses, direction changes) Linear interpolation and histogram mode options Works on strategy tester in multi timeframe mode (at weekend without ticks also) Adjustable Levels Parameters:
TDI Timeframe: You can set the lower/higher ti
FREE

Read This : Please provide comments and reviews for future improvements. WaveTrendPro_Indi v1.05
WaveTrend indicator with enhanced histogram visualization: WaveTrendPro_Indi v1.05
Indikator WaveTrend dengan tampilan histogram yang lebih jelas: Histogram otomatis lebih tinggi (bisa diatur dengan parameter HistScale ). Warna histogram berbeda untuk positif & negatif → tren naik lebih mudah dibaca. Tetap ringan & responsif di berbagai pair/timeframe. Cocok untuk scalper, swing trader,
FREE

This indicator creates a Renko-based custom symbol in MetaTrader 5. Renko charts are built using price movement only, not time, making them useful for analyzing trends and filtering noise. Features Customizable brick size in points. Option to calculate brick size using ATR (adaptive). Ability to show or hide wicks. Creates and updates a custom Renko chart symbol. Automatically opens the chart window (optional). Maintains a limited bar history for performance. Inputs BrickSizePoints – brick size
FREE
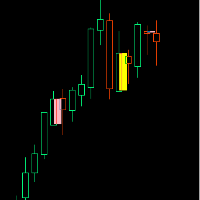
If you like this product, please give it a 5 star rating as a token of appreciation.
Inside Bar: A candle that is completely contained within the high-low range of the previous candle
Outside Bar: A candle that completely engulfs the high-low range of the previous candle (also called an "Engulfing Bar")
Inside Bars Consolidation Signals : Indicates market indecision/compression Breakout Setup : Often precedes significant price moves Continuation Patterns : Can signal pause in trend before con
FREE
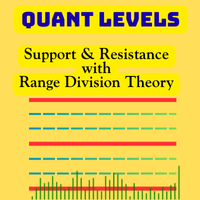
Quant Levels Indicator is a premium component of the Quantitative Trading Analysis Toolkit , designed to transform subjective trading into data-driven decision making. This advanced tool provides institutional-grade support and resistance analysis directly on your MT5 charts. " Please support our work by leaving a review ". As a thank-you gift , we’ll share a special template that helps you display signal trade history directly on your chart. Free indicator to visualize any MT5/MT4 signals i
FREE

"The Easiest 3 EMA Technique + Grid Scalping (High WinRate)" describes a specific strategy in the realm of financial trading, with a focus on simplicity and effectiveness. Let's break down the key components:
1. **3 EMA Technique**: EMA stands for Exponential Moving Average, a type of moving average that places a greater weight and significance on the most recent data points. The '3 EMA' likely refers to a technique that uses three different EMAs with varying time frames to identify potential
FREE

Thermo MAP is a multicurrency and multitimeframe indicator that display a smart heat map based on proprietary calculations. Watch how Forex market moved and is currently moving with a single dashboard and have a consistent and good idea of what is happening!
It can be suitable for both scalping or medium/long term, just select options that better fit your trading style Symbols list are automatically sorted based on the preferred column. There is the possibility to click on: First row, timeframe
FREE

1. Introduction The Market Squeeze Momentum Indicator (SQZMOM_LB) is a powerful technical analysis tool designed to help traders identify periods of low market volatility (the "squeeze" phase) and predict the direction and strength of price momentum after the squeeze ends. This indicator combines the principles of Bollinger Bands and Keltner Channels to detect changes in market volatility, along with a momentum oscillator to measure buying/selling pressure. 2. Key Components of the Indicator The
FREE

Free forever simple pip meter for MT5 with customizable font color. Display profit or loss in both points count and currency value. Supports 4 currency symbols ($,€,£ ,¥). For unsupported currencies, it shows a 3-character currency short form. Enhance your trading interface with clarity and precision. Easy to use and tailored for diverse Forex traders. Perfect for MT5!
FREE

Introducing a sophisticated BreakOut and RecoveryZone tool designed to empower traders in any market scenario, facilitating the optimization of trade opportunities.
The core strategy revolves around executing price breakouts using BuyStop and SellStop orders to achieve specific profit targets in dollars. Notably, traders can manually set the BuyStop and SellStop levels by simply clicking and dragging lines on the chart (FixedZone=true is required).
For swift market entry, you can drag the BuyS
FREE

PipTick Session — это очень простой индикатор, помогающий выделять торговые сессии. Например, его можно использовать для разделения европейской, американской и азиатской сессии.
Основные характеристики Индикатор показывает пользовательские торговые сессии Оповещения о начале и окончании сессии Пользовательское время сессии Работает на всех таймфреймах (M1, M5, M15, M30, H1, H4, D1, W1, MN) Настраиваемые параметры (цвет, оповещение...) Может использоваться для создания советников Предназначен дл
FREE

MT5 к сигналам Telegram Эта утилита проста в использовании и поддерживает широкий спектр настроек: Выберите желаемую группу Telegram и введите токен бота и идентификатор чата. Получайте уведомления, когда заказы размещаются, изменяются, выполняются, закрываются... или любые комбинации состояний. Соедините свой брокерский аккаунт с Telegram и перестаньте пропускать важные уведомления. Хотите получать уведомления в Telegram? Ищете простой способ делиться торговыми сигналами с вашими подписчиками?
FREE

QuantScalping - Precision Scalping for Consistent Profits Join channel here: https://www.mql5.com/en/channels/quantbreakprop
Overview QuantScalp is a cutting-edge scalping trading strategy designed to maximize your trading efficiency and profitability. Built with advanced algorithms and tailored for high-frequency trading, QuantScalp offers a unique approach to the markets, ensuring faster wins and higher win rates. Key Features Optimized Scalping Strategy : Harnesses advanced technical analy
FREE

Jackson Support and Resistance V it a powerful advance support and resistance indicator which provide signal base on price action, it Design to make things easy for everyone to draw support and resistance. we believe most strategies are built with support and resistance as a foundation .Having support and resistance perfect can be a game change to you way of trading. It flexible to all instrument .don't forget to watch our video on how to us this indicator prefect and progressive.
FREE

Velas Multi Time Frame
Las velas multi time frame, también conocidas como "MTF candles" en inglés, son un indicador técnico que permite visualizar velas japonesas de un marco temporal diferente al marco temporal principal en el que estás operando. Este enfoque ofrece una perspectiva más amplia del comportamiento del precio, lo que resulta especialmente útil para los traders que emplean estrategias de acción del precio. A continuación, se detallan los conceptos clave relacionados con este indic
FREE

Overview: Ravenok Gold MT5 is a highly effective trading robot specifically designed for nighttime trading in financial markets. It utilizes sophisticated algorithms to analyze market data and make decisions based on thoroughly tested strategies. The robot primarily operates during the night when market volatility may be lower, allowing it to generate profits with minimal risk. Key Features: Low Drawdown:
NightProfit Trader employs a unique risk management system that helps maintain a low dra
FREE
WYSIWYG OPEN RANGE BREAKOUT - PRO EDITION
Ultra-precise ORB indicator with smart line-breaking, dynamic ATR-based targets, and multi-session adaptability. Perfect for day, swing, and algorithmic traders seeking clear visuals and actionable levels . Trade with confidence – see what you trade, trade what you see . "What You See Is What You Get" "What You See Is What You Get" – The ultimate ORB indicator delivering ultra-precise trading range visualization with a smart line-breaking system. Built
FREE

This EA is a Trade Assistant designed to manage your manually opened trades automatically. It helps you control risk and maximize profits without staring at the screen all day. Perfect for Gold (XAUUSD) scalpers and day traders. Key Features: Auto Initial Stop Loss (ATR): Automatically places a Stop Loss immediately after you open a trade, based on market volatility (ATR). Manual SL Compatible (Hybrid Mode): You can still set your own Stop Loss manually when entering a trade. The EA will respect
FREE

US 30 BOT This is a simple quantitative model that trades US30 Index from NASDAQ top 30 American stocks It uses volatility contraction and expansion as a basic theory. Place it on US30 chart ,any timeframe. Hedged accounts are advised NB: Standard accounts are preferred and well regulated brokers eg ICMarkets are advised to avoid unnecessary losses eg slippage ones,commissions and large spreads. Minimum account balance ADVISED : USD 100 HOW TO USE: A VPS is highly recommended. AWS offers 1 yea
FREE
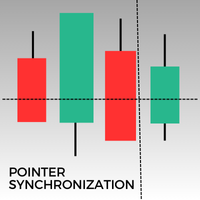
Этот индикатор для MetaTrader 5 автоматически синхронизирует указатель на всех открытых графиках одного и того же актива. Независимо от того, находитесь ли вы на минутном или дневном графике, указатель автоматически выровняется по одной и той же цене на всех открытых окнах. Это обеспечивает согласованный и быстрый анализ, что улучшает принятие решений. Синхронизация указателя между несколькими графиками является ценным инструментом для трейдеров, стремящихся поддерживать точный обзор движения ц
FREE

The Volume+ and VSA Signals indicator for MT5 is based on the Volume Spread Analysis (VSA) methodology to provide the signals. The signals are displayed at closing of bars on the main window or subwindow in the form of symbols. The symbols are not repainting. The indicator produces a signal on an individual bar and this signal is not buy or sell signal. When a minor trend goes in the opposite direction of a major trend, there are sequences of major trend-following signals that give a higher pro

Bollinger bands out/in strategy A strategy created by Joe Ross, and very useful for finding trades when the market is overloaded. Indicator You don't need to find where there are entries on the chart, this indicator shows them for you. The entrance The trade is confirmed when the price closes outside the bollinger bands on a candle and the candle after the price closes inside the bands. comment I want to improve this indicator, so you can help me sending me your reviews and comments, thanks :).
FREE

Rapid Reaper EA - полностью автоматический гибридный усредняющий советник, который торгует последовательностями увеличения и умножения лота в обоих направлениях торговли. Система торгует с использованием рыночных ордеров, с уровнями тейк-профит для групп сделок. Данный советник работает на любой паре, но лучше всего работает на GBPUSD и USDCAD с таймфреймом M5. Для работы этого советника рекомендуется VPS-сервер. В разделе "Обсуждение" представлены результаты тестирования и оптимизированные наст
FREE

ET1 for MT5 is new and completely free!! ET1 for MT5 v4.20 Updated!! Now use on XAUUSD(Gold) !! The success rate is more than 75% !!!
important update: Merge ET9 's breakout strategy
Warning!! You can use ET1 completely free, but we do not guarantee ET1 stability, It is recommended that the more powerful ET9 for MT5 version includes the ET1 strategy and guarantees complete and stable returns.
The Best Expert Advisor on XAUUSD any timeframes ET9 for MT5 Updated v4.70 !! https://www
FREE

Мультивалютный и мультитаймфреймовый индикатор Commodity Channel Index (CCI). В параметрах вы можете указать любые желаемые валюты и таймфреймы. Также индикатор может отправлять уведомления при пересечении уровней перекупленности и перепроданности. По клику на ячейке с периодом будет открыт данный символ и период.
Параметры CCI Period — период усреднения.
CCI Applied price — тип цены;
Clear the chart at startup — очистить чарт при старте;
Set of Pairs — набор символов
— Market Watch — п

Correlation Monitor — индикатор для быстрого обнаружения связей между инструментами: помогает находить пары с сильной положительной/отрицательной корреляцией, видеть расхождения и принимать более взвешенные решения при хеджировании, парной и корзинной торговле. Meta traider 4. Ключевые возможности • Корреляционная матрица и компактный список: моментально показывает силу связи между выбранными символами, цветовая индикация облегчает чтение. • Мини-график цены коррелируемого инструмента, синхрони
FREE

Эксперт использует стратегию основную на пробое наиболее важных уровней сопротивления и поддержки. Используется адаптивный алгоритм сопровождения сделки. Эксперт использует небольшой стоп-лосс, а значит, счет всегда защищен от просадок, а риск на сделку очень низок. В Эксперт интегрирована система закрытия позиций при проскальзывании. (есть возможность настроить). Бэктестирование и оптимизация проводились на реальных тиках с качеством истории 99,9%. Советник успешно прошел стресс-тестирование. В

system designed to follow strong trends.
Core Principle operates on a simple yet powerful concept: identify strong trends and stay in them until the market gives a clear signal of change. Every trade opens with an automatically calculated stop loss. What You Get Two Independent Strategies that can be activated together or separately based on your preference: Strategy One - SuperTrend Classic Uses the ATR indicator to determine trend direction, with ADX filtering to confirm movement strength
FREE
The indicator is a line right at yesterday's closing price. With the indicator, there is no need for adding or deleting previous day close lines each new day. T he line gives you an instant visual reference point for support, resistance, and market sentiment. Whether you are day trading or swing trading, this line helps you quickly gauge where the market closed last session and how current price action relates to that level. It works seamlessly across all timeframes - from 1-minute charts to d
FREE

Alert Indicator for exponential moving average cross blue arrow for buy alert , fast ema 14 crosses above 50 pink arrow for sell alert , fast ema 14 crosses below 50 Default 14 ema fast & 50 ema slow add these indicators to chart Full Alerts , push, email, phone inputs for moving average lengths and alarm on off settings Please contact for help of an indicator alert suggestion
FREE

If you love this indicator, please leave a positive rating and comment, it will be a source of motivation to help me create more products <3 Key Takeaways StochRSI is an oscillator that measures the RSI level relative to its high-low range over a period of time. It is more sensitive than the traditional RSI and can highlight overbought or oversold conditions in the market. StochRSI is typically used to generate more frequent and timely trading signals compared with the traditional RSI. StochRSI
FREE

The Trend Line Reverse Expert Advisor is a highly innovative and powerful tool that enables traders to effortlessly identify and trade trends in the financial markets. With this advanced tool, you can easily draw trend lines on your MT5 chart, and the EA will automatically buy or sell when the price reaches the trend line. This EA is user-friendly and requires minimal setup. You can simply attach it to your chart and start drawing up to three trend lines where you anticipate the price to reverse
FREE

https://www.mql5.com/en/users/gedeegi/seller
QuantumFlux Trend combines concepts from statistical physics (temperature T & energy step alpha ) with Boltzmann-style exponential weighting to produce a trend line that is more “context-adaptive” compared to traditional moving averages. The result is then smoothed with an EMA to deliver cleaner signals that are easy to read across all timeframes. The indicator automatically colors candles and trend lines: green for bullish phases, red for bearish
FREE
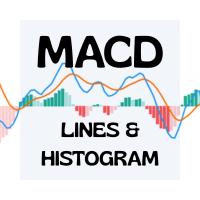
Advanced MACD Indicator with 6 Colors & Adjustable Line Thickness Elevate your trading charts with this fully customizable MACD indicator for MetaTrader 4/5. With six independent color slots and per-line thickness controls, you can tailor every element to your exact preferences. Key Features Six Separate Color Slots
Customize each component with its own color: MACD Line Signal Line Histogram Bars (Bullish) Histogram Bars (Bearish) Zero Line Adjustable Line Thickness
Choose any thickness—from e
FREE

Easy Correlations Indicator The Easy Correlations Indicator is designed to help traders analyze the relationship between two correlated instruments. By monitoring the distance between their Relative Strength Index (RSI) values, the indicator highlights situations where one instrument has moved significantly further than the other. This creates potential trading opportunities: Sell the stronger instrument (overstretched RSI) Buy the weaker instrument (lagging RSI) Because the positions are opened
FREE

Legacy of Gann Enhanced EA v4.0 AI-Powered Trading System with Groq Integration Overview Legacy of Gann Enhanced EA is a sophisticated MetaTrader 5 Expert Advisor that combines classical Gann trading principles with cutting-edge artificial intelligence. This revolutionary trading system uses the proven Pattern 123 methodology enhanced with Groq AI analysis and economic news filtering to identify high-probability trade setups. What Makes This EA Special? AI-Powered Decision Making - Integ
FREE
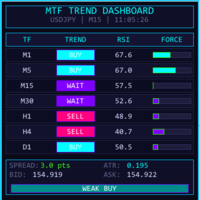
MTF TREND DASHBOARD – Многофреймовый анализатор тренда Мощная визуальная панель, отображающая направление тренда одновременно на 7 таймфреймах (M1, M5, M15, M30, H1, H4, D1). === ОСНОВНЫЕ ОСОБЕННОСТИ === Мгновенное определение тренда на нескольких таймфреймах с помощью пересечения EMA Значения RSI с цветовой индикацией перекупленности/перепроданности Динамические индикаторы силы тренда Общий рыночный сигнал (Strong Buy/Sell, Bias, Weak, Neutral) Онлайн-отображение спреда, ATR, Bid/Ask Современна

Наиболее важным ценовым уровнем в любом "Профиле объема" является "Точка контроля" . Это ценовой уровень с наибольшим торговым объемом. И в основном это уровень, на котором крупные игроки начинают свои позиции, так что это уровень накопления/распределения для умных денег.
Идея индикатора возникла после того, как сделали индикатор "MR Volume Profile Rectangles" . При создании индикатора "MR Volume Profile Rectangles" мы потратили много времени на сравнение объемов с объемами из профиля объемов в

This is a buyer and seller aggression indicator that analyzes the shape of each candle and project this data in a histogram form. There are 4 histograms in one. On the front we have two: Upper - Buyer force. Lower - Seller force. At the background we also have two histogram, both with same color. They measure the combined strenght of buyers and sellers. This histograms can be turned off in Input Parameters. It is also possible to have the real or tick volume to help on this force measurement. IN
FREE

Индикатор VR ATR Pro – это мощный профессиональный инструмент для определения целевых уровней на финансовом инструменте. Эффективность индикатора доказана тысячами тестов на реальных и демонстрационных счетах. VR ATR Pro индикатор, работающий на реальных данных с использованием живой настоящей статистики. Статистика вещь упрямая, использование реальных статистических данных в математических подсчетах позволяет рассчитать точные целевые уровни для финансового инструмента. Больше профессиональных

Several assets in several markets have the behavior of using specific numbers as Force Numbers, where support, resistance and price thrust is created. Let this indicator draw those levels of support and resistance for you. You can also stack it to show different level of Prices! This technique is being used by Tape Readers and Order Flow traders all over the world for a long time. Give it a try. Challenge yourself to study new ways of Price Action!
SETTINGS
What Price reference to use in the c
FREE

Пусть ваше путешествие внутри хранилища будет успешным.
Советник Aurum Vault — это передовая автоматизированная торговая система, основанная на концепции Smart Money Concepts (SMC), которая объединяет структуру рынка, зоны ликвидности и блоки ордеров для выявления высоковероятных входов.
Система разработана как для свинг-, так и для скальпинг-стратегий, используя многотаймфреймовое подтверждение и адаптивный контроль рисков.
____
Ключевые особенности Логика концепции Smart Money (блоки орде
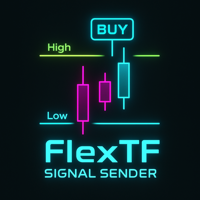
FlexTF Signal Sender — Индикатор подтверждения касания High/Low на разных таймфреймах Официальный канал Обновления, инструменты и документация: Открыть официальный канал MQL5 | Описание FlexTF Signal Sender — это многофреймовый индикатор подтверждения уровней High/Low. Он считывает High/Low со старшего ТФ (H1/H4/D1), отслеживает взаимодействие цены и подтверждает BUY/SELL по свечам младшего ТФ (M5/M15/M30). Индикатор содержит фильтры, защиту от повторных касаний, логику пробоя и стильную н
FREE

The Market Momentum indicator is based on the Volume Zone Oscillator (VZO), presented by Waleed Aly Khalil in the 2009 edition of the International Federation of Technical Analysts journal, and presents a fresh view of this market valuable data that is oftenly misunderstood and neglected: VOLUME. With this new approach of "seeing" Volume data, traders can infer more properly market behavior and increase their odds in a winning trade.
"The VZO is a leading volume oscillator; its basic usefulness
FREE

Осталось только 7/10 копий по стартовой цене $85!
Философия — «Строить только тогда, когда рынок говорит "да".»
Большинство сеток просто расставляют уровни и надеются. MAM White сначала спрашивает разрешение — у тренда, у волатильности и у вашего брокера. Она строит одностороннюю LIMIT-сетку только тогда, когда быстрая EMA совпадает с сильным медленным EMA-трендом, а цена находится на правильном расстоянии от центра. Нет тренда? Нет построения. Новый разворот? Период охлаждения. Слишком шир
FREE

TickAll - Automated Trading Robot
Introduction: TickAll is an automated trading robot designed to assist both novice traders and professional traders in the Forex market. Utilizing advanced algorithms and up-to-date market analysis, TickAll helps you make the best trading decisions. Market Analysis: TickAll continuously monitors the market, analyzing various indicators, price movements, and patterns to identify potential trading opportunities. Trend Identification: Using sophisticated a
FREE

Unleash the power of portfolio trading with the Maka Maka Multi EA. This advanced Expert Advisor is designed to trade multiple currency pairs simultaneously from a single chart, diversifying your approach and capturing more opportunities across the market. Using a proven combination of classic indicators, the Maka Maka Multi EA identifies high-probability entry points and manages all trades with a sophisticated, automated system designed for steady growth Instead of relying on a single instrume
FREE

1. Introduction The CM_Ultimate_RSI_MTF is a powerful and versatile custom indicator for MetaTrader 5, designed to enhance your Relative Strength Index (RSI) analysis. It provides multi-timeframe (MTF) capabilities, visual signals, and customizable alerts, making it an invaluable tool for traders seeking to identify overbought/oversold conditions, trend strength, and potential entry/exit points across various timeframes. 2. Key Features Multi-Timeframe (MTF) Analysis: Allows you to view RSI from
FREE

**Experience Smarter Trading with FVG Super Signal**
Unlock simpler, more decisive trading with **FVG Super Signal**, an advanced MT5 indicator from the WinWiFi Robot Series. This powerful tool uniquely combines the Fair Value Gap (FVG) technique with robust trend-following logic.
* **Clear Signals:** Delivers intuitive Buy/Sell alerts, simplifying your trading decisions. * **Universal Compatibility:** Works seamlessly across all assets and timeframes. * **Highly Versatile:** Ideal for all tr
FREE

The Monthly Weekly Open Line is an indicator that plots: The current month open line that will extend till the last week on the month. Weekly lines that span the look back days period that you have set . Each line will extend from the respective weekly Monday zero GMT till friday of the respective week. Monthly and Weekly open lines can be used to build very powerfull anc consistent trading strategies. They act as natural S/R price barriers.
FREE
А знаете ли вы, почему MetaTrader Market - лучшее место для продажи торговых стратегий и технических индикаторов? Разработчику у нас не нужно тратить время и силы на рекламу, защиту программ и расчеты с покупателями. Всё это уже сделано.
Вы упускаете торговые возможности:
- Бесплатные приложения для трейдинга
- 8 000+ сигналов для копирования
- Экономические новости для анализа финансовых рынков
Регистрация
Вход
Если у вас нет учетной записи, зарегистрируйтесь
Для авторизации и пользования сайтом MQL5.com необходимо разрешить использование файлов Сookie.
Пожалуйста, включите в вашем браузере данную настройку, иначе вы не сможете авторизоваться.