Smart Market Flow Detector
- インディケータ
- バージョン: 4.0
- アップデート済み: 10 2月 2026

Four Algorithms. One Signal. Zero Repainting.
Smart Market Flow Detector combines four analytical engines into a single indicator that identifies institutional order flow patterns across all timeframes. Every signal is generated on closed bars only — what you see in back-testing is what you get live.
What It Does
SMFD scores every bar on two axes: Smart Money Flow (institutional accumulation/distribution) and Dumb Money Flow (retail chasing behaviour). When these scores cross key thresholds with multi-algorithm confirmation, the indicator places buy or sell arrows directly on your chart.
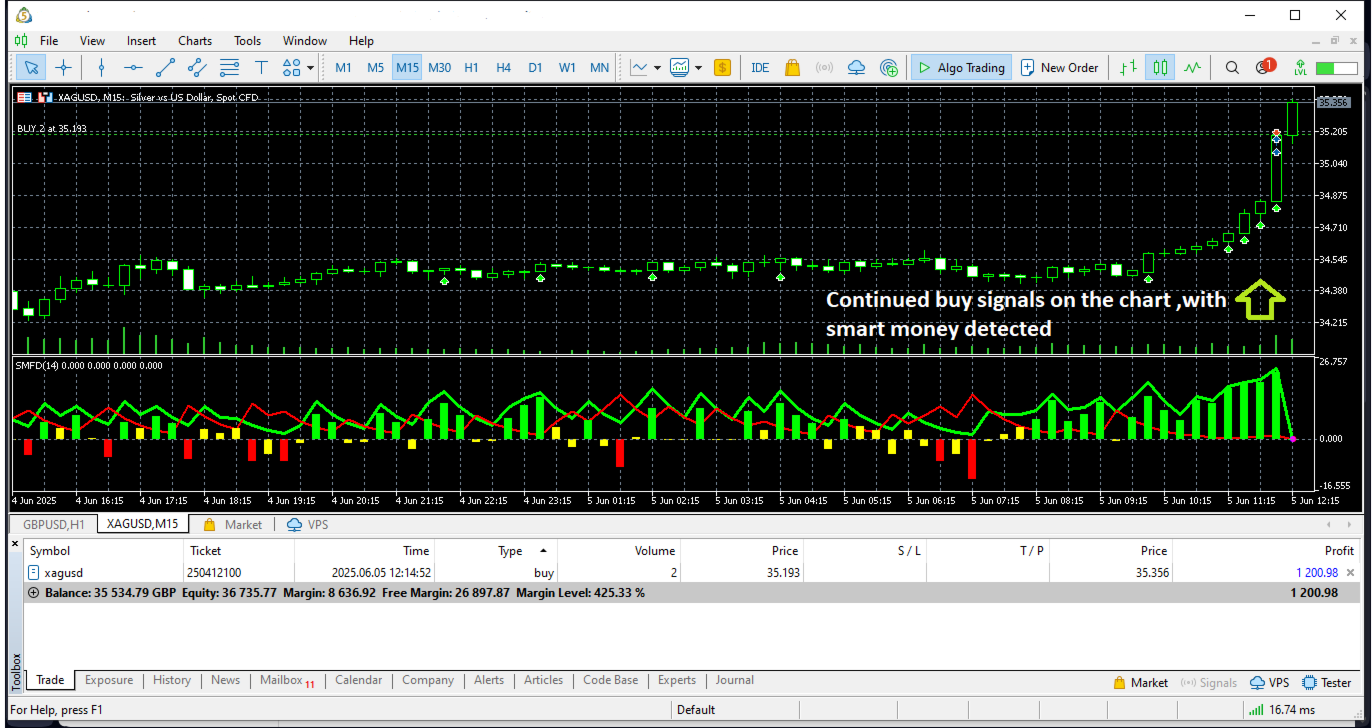
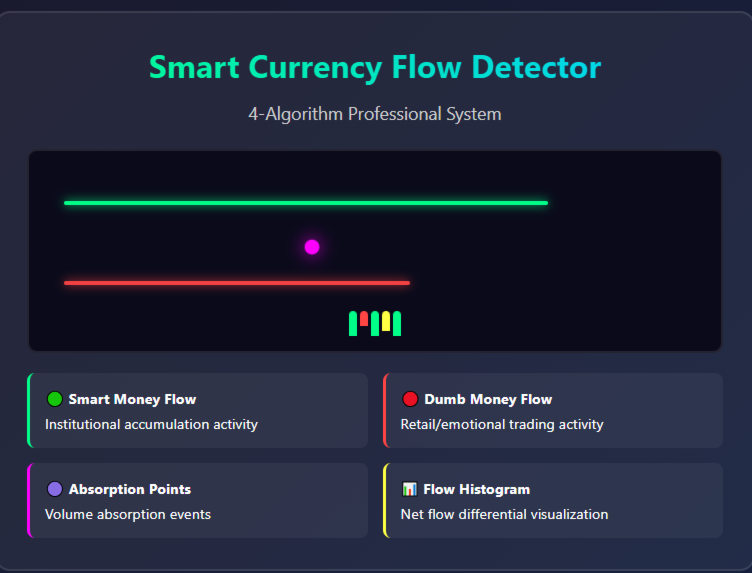
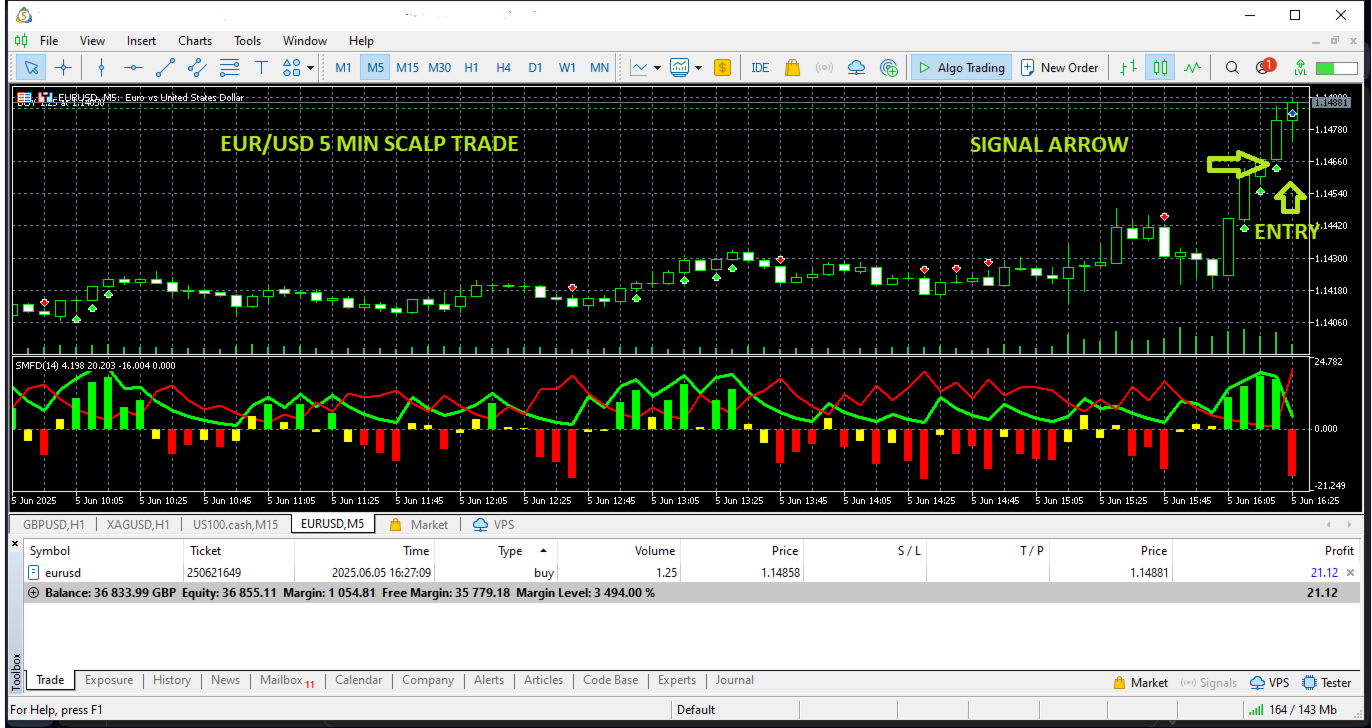
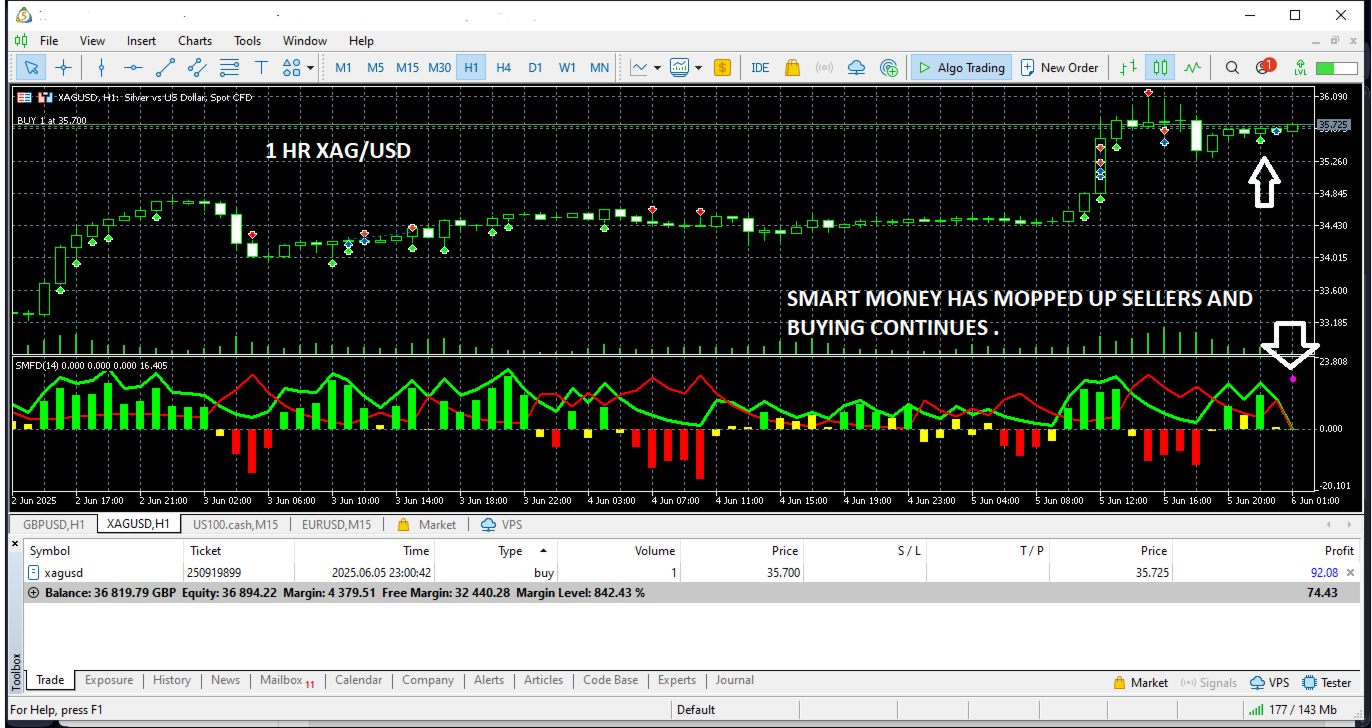
The indicator runs in a separate window showing:
- Smart Money Flow line (green)
- Dumb Money Flow line (red)
- Flow Differential histogram (colour-coded)
- Volume Absorption markers (magenta)
Buy and sell arrows appear on the main price chart at confirmed entry levels with detailed tooltips showing exact flow scores.
The Four Algorithms
1. VWAP Deviation Analysis Calculates Volume Weighted Average Price over a configurable period and measures how far current price has deviated. Significant deviations from VWAP often mark institutional entry points, as price tends to revert to its volume-weighted mean.
2. Hidden Flow Detection Identifies bars where volume spikes but price range compresses — a signature of large orders being absorbed without moving price. Analyses volume ratio against moving averages and close position within the bar range to score accumulation strength.
3. Order Flow Imbalance Estimates buying versus selling pressure by analysing where price closes within its high-low range, weighted by volume. A bar that closes near its high on heavy volume scores differently from one that closes near its low on the same volume.
4. Volume Absorption Detection Flags bars where volume exceeds 150% of the moving average while price movement stays below 50% of its historical average. This high-volume, low-movement pattern typically precedes significant directional moves.
These four engines cross-validate each other. Signals require confirmation across multiple algorithms, which research shows reduces false positives by up to 60% compared to single-method indicators.
Key Features
Non-Repainting Signals All calculations run on completed bars only. Arrows never move, disappear, or change after they appear. Your backtesting results match live performance.
Trend Filter (EMA Confirmation) Optional dual-EMA filter (default 50/200) ensures buy signals only trigger in bullish trends and sell signals only in bearish trends. Eliminates counter-trend signals that waste capital.
ATR-Based Signal Quality Optional ATR confirmation requires sufficient price range relative to recent volatility before generating a signal. Filters out low-conviction setups in choppy markets.
Automatic Timeframe Adaptation Thresholds, volume multipliers, and minimum bar spacing automatically adjust based on your chart timeframe. Works from M1 through Monthly without manual tuning.
Five Trading Styles Choose from Conservative, Balanced, Aggressive, Test, or fully Custom threshold modes. Each style adjusts all signal parameters to match your risk tolerance.
Push Notifications to Mobile (NEW) Receive signal alerts directly on your phone through MetaTrader 5 push notifications. The system verifies your notification setup on startup, sends a test push to confirm delivery, and includes built-in cooldown protection to prevent alert spam. Push messages are kept short and clean for reliable delivery across all devices. On-screen popup alerts and sound alerts are also available — all three can be enabled independently.Smart Alert Cooldown Alert frequency automatically adjusts to your timeframe. Shorter timeframes get shorter cooldowns, longer timeframes get longer cooldowns. Separate cooldowns for buy and sell signals so one never blocks the other. Fixed cooldown mode also available.
Signal Logic
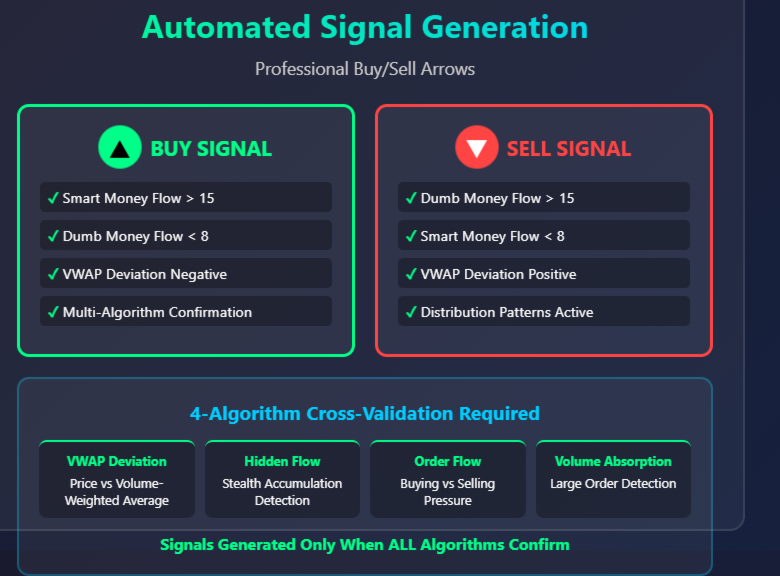
Buy Signal fires when:
- Smart Money Flow exceeds the buy threshold (institutional accumulation detected)
- Dumb Money Flow is below the buy threshold (minimal retail participation)
- Multi-algorithm confluence requirements are met
- Trend filter confirms bullish conditions (if enabled)
- ATR confirms sufficient volatility (if enabled)
- Minimum bar spacing since last buy signal is respected
Sell Signal fires when:
- Dumb Money Flow exceeds the sell threshold (retail chasing/excess detected)
- Smart Money Flow is below the sell threshold (institutional distribution detected)
- Multi-algorithm confluence requirements are met
- Trend filter confirms bearish conditions (if enabled)
- ATR confirms sufficient volatility (if enabled)
- Minimum bar spacing since last sell signal is respected
How to Use It
Scalping (M1–M5)
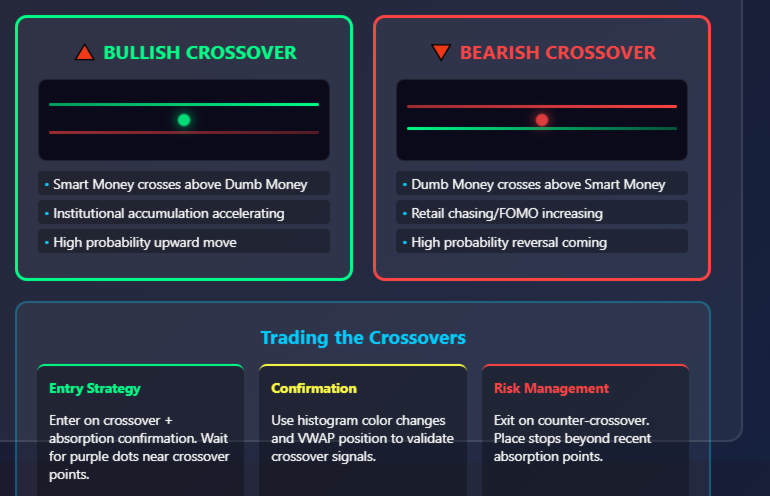
Wait for absorption markers followed by a buy or sell arrow. Enter on the arrow with tight stops. Target 1:1 or 1:2 risk-reward. Best during London/New York overlap when volume flow is highest.
Day Trading (M15–H1)
Combine signal arrows with VWAP deviation extremes at key support and resistance levels. Trail stops using flow histogram colour changes. Focus on major pairs during high-volume sessions.
Swing Trading (H4–D1)
Look for clusters of absorption events followed by arrow confirmation. Enter on pullbacks to VWAP after the initial signal. Target 50–200 pip moves over 2–7 days.
Multi-Timeframe Approach
Use a higher timeframe (D1/W1) for trend direction, your trading timeframe (H1/H4) for entries, and a lower timeframe (M15/M30) for momentum confirmation. Exit when any timeframe shows a flow reversal.
Configuration
| Parameter | Default | Purpose |
|---|---|---|
| Analysis Period | 14 | Lookback for VWAP and flow calculations |
| Volume Period | 20 | Moving average period for volume normalisation |
| Volume Threshold | 1.5 | Minimum volume spike ratio for absorption detection |
| Trading Style | Balanced | Conservative / Balanced / Aggressive / Custom / Test |
| Trend Filter | On | Dual-EMA trend confirmation (50/200) |
| ATR Confirmation | On | Volatility-based signal quality filter |
| Push Notifications | On | Send signals to your phone via MT5 mobile app |
| Popup Alerts | On | On-screen alert dialog |
| Sound Alerts | On | Audible alert with configurable sound file |
| Cooldown Mode | Auto | Auto-adjusts by timeframe, or set a fixed cooldown |
All parameters are fully configurable. The indicator validates your settings on startup and warns you if anything is misconfigured.
Setup
- Place the .mq5 file in your /MQL5/Indicators/ directory
- Restart Meta Trader 5
- Attach the indicator to any chart from the Navigator panel
- For push notifications: go to Tools → Options → Notifications, enable notifications, and enter your Meta Quotes ID. The indicator will send a test push on start up to confirm delivery
- Configure your preferred trading style and enable or disable filters as needed
Requirements: Meta Trader 5 build 2515 or higher. Compatible with all brokers and account types. Works on forex, indices, commodities, and all MT5-supported instruments. Minimum 50 bars required for accurate calculations.
What This Indicator Will Not Do
This is not a magic box. It will not turn a gambler into a trader. It reads volume and price structure, scores it across four algorithms, and gives you a signal when they agree. You still need to manage risk, pick your sessions, and exercise discipline. If you are willing to put the work in, this tool gives you an edge. If you are looking for guaranteed profits, this is not for you

This indicator is helping me a lot to understand market aggressions; excellent support, it has helped me a lot.