Robots comerciales e indicadores para MetaTrader 5 - 51
Este EA combina el análisis de la estructura del mercado con el análisis de patrones de velas para identificar puntos de entrada de alta probabilidad en los mercados que oscilan. Analiza de forma inteligente los máximos y mínimos de los rangos de consolidación basándose en la estructura del mercado y entra en el mercado cuando aparecen patrones de velas de inversión. El EA también incluye una lógica inteligente de asignación de riesgos que ajusta el tamaño de los lotes según la fuerza de la ten

Especialmente diseñado para operar con oro (XAUUSD) , este EA identifica niveles de precios críticos basados en soportes/resistencias históricos, zonas de volumen y grupos de volatilidad. Una vez validados estos niveles, establece órdenes Buy Stop y Sell Stop para capitalizar el impulso de ruptura. El sistema está optimizado para operar durante las noticias de alto impacto y las aperturas de sesión, cuando los movimientos de ruptura tienden a ser más fuertes. Gracias a su naturaleza basada en e

Este EA está diseñado en torno a los principios clásicos de swing trading , centrándose en la identificación de condiciones de sobrecompra y sobreventa utilizando osciladores personalizados y filtros de acción de precios. El objetivo es capturar retrocesos a corto plazo dentro de tendencias de mercado más amplias. No persigue el impulso ciegamente, sino que espera a que el mercado retroceda a niveles favorables antes de entrar en una operación. El EA también incluye filtros de tiempo y volatili

Carry Master EA: Libere el poder de las operaciones de carry trade en el mercado del oro Presentamos Carry Master EA, el revolucionario Asesor Experto diseñado específicamente para ejecutar estrategias de carry trade en el mercado del oro. Si usted es un trader experimentado o nuevo en el mundo de divisas y materias primas, Carry Master EA proporciona una solución fiable y rentable para sacar provecho de los diferenciales de tipos de interés con el oro.
Cómo instalar :
El EA debe adjuntarse SO

NOTA: PARA CONFIGURACIONES Y SOPORTE TECNICO AQUI ESTA NUESTRO ENLACE DE SMART MONEY TELEGRAM: https://t.me/+g51Apb2W5Ck0ZGFk
¿QUÉ ES SMART MONEY EA? Smart Money EA no es sólo otro robot de comercio. Es un EA de seguimiento de tendencias de alta precisión que aprovecha el concepto de Smart Money, la acción del precio y el impulso del mercado para entrar en operaciones con una precisión excepcional". Es su solución todo-en-uno para operar EURUSD, Petróleo Crudo, Nasdaq 100, Alemania 40, e inclus
Presentamos ZHUQUE S2 , nuestro Asesor Experto (EA) de última generación diseñado para operar con el par de divisas EURUSD. Este EA aprovecha los niveles de Liquidez del Lado Comprador (BSL) y Liquidez del Lado Vendedor (SSL) como señales primarias de trading, identificando zonas clave de liquidez donde es probable que se produzcan reversiones de precios. Mediante la integración de algoritmos dinámicos de gestión de posiciones con técnicas avanzadas de Smart Trailing, ZHUQUE S2 garantiza una re

El mercado es injusto aunque sólo sea porque el 10% de los participantes gestiona el 90% de los fondos. Un operador ordinario tiene pocos cambios para enfrentarse a estos "buitres". Este problema puede resolverse. Basta con estar entre ese 10%, aprender a predecir sus intenciones y moverse con ellos. El volumen es el único factor preventivo que funciona sin fallos en cualquier marco temporal y símbolo. Primero aparece el volumen y se acumula, y sólo entonces se mueve el precio. El precio se muev

Smart Risk Manager Dashboard es un indicador de MetaTrader 5 diseñado para ayudar a los operadores con el control estructurado del riesgo y la supervisión de la cuenta en tiempo real.
Proporciona una interfaz visual para la gestión del tamaño de la posición, el seguimiento de las pérdidas y ganancias, y el establecimiento de límites de negociación personalizados. Características principales Calculadora de riesgo SL/TP
Muestra el riesgo y la recompensa estimados directamente en el gráfico median

Transforme su gráfico de MetaTrader 5 en una cabina de operaciones profesional. Apex Dashboard es una utilidad de alto rendimiento diseñada para los operadores serios que necesitan un conocimiento completo de la situación. Va más allá de la simple monitorización, proporcionando una visión completa de la solvencia de su cuenta, el rendimiento y la exposición al riesgo en tiempo real. A diferencia de los indicadores estándar, Apex Dashboard cuenta con un motor de datos persistentes . Registra su P
FREE
Recomendaciones
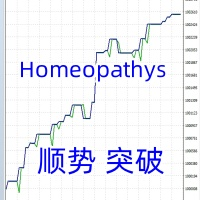
Pares de divisas recomendados: XAUUSD, oro
Ciclo temporal: H4
Capital operativo: recomendado por encima de $1000
Tipo de cuenta: Sin requisitos especiales, mejor efecto de baja diferencia
Palancas: Sin requisitos especiales
cuestiones que requieren atención
EA tiene un máximo de 6 puntos de entrada por día, con un mínimo de 0,01 operaciones por transacción (modificación manual es suficiente).
El parámetro por defecto es la variedad de oro.
Sugerir el uso de fondos po
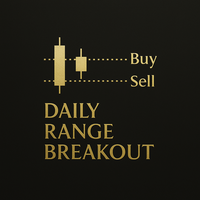
Optimizador de ruptura de rango diario Daily Range Breakout Optimizer es un asesor experto que implementa una estrategia de ruptura basada en el rango del día anterior, con filtrado por estructura de mercado y tendencia. Adecuado para probar y operar con varios símbolos, calcula el rango diario, aplica filtros y coloca órdenes pendientes Buy Stop y Sell Stop, con gestión de posiciones mediante límites de breakeven y de tiempo. Cómo funciona Al comienzo de un nuevo día, el asesor analiza el rango
FREE

Redescubra el trading. El futuro de Forex son los híbridos intuitivos. Hola, mi nombre es Szymon, soy un desarrollador profesional de algoritmos para el comercio en los mercados financieros de divisas. Experiencia laboral en finanzas y programación de más de 10 años. Me especializo en sistemas de cuadrícula y martingala. Black Horse EA es un robot automatizado de divisas (esto no es su rejilla habitual o martingala). Este EA comercia basado en la ruptura de los niveles de precios (de acuerdo con

Rover Pro EA es un asesor de trading totalmente automático que contiene varios sistemas de trading basados principalmente en Medias Móviles, Alligator, CCI, MACD, ADX, Oscilador Estocástico, Envolventes, Momentum, Desviación Estándar, Bandas de Bollinger, Bull Power, WPR, DeMarker, Awesome Oscillator y ATR. Cada sistema de comercio tiene su propia entrada con la pérdida de parada fija y tomar ganancias. Este robot se puede utilizar para todos los pares y todos los marcos de tiempo, pero está es

Apex Predator - Estrategia de Gap-Fill del lunes para la corrección de la volatilidad del fin de semana ¿Qué hace este EA? Apex Predator es un sistema de trading automatizado que explota un fenómeno bien conocido: "los gaps de precios que se producen en la apertura del mercado del lunes (la diferencia entre el cierre del viernes y la apertura del lunes) tienden a revertir." Explicación sencilla Durante el fin de semana, cuando los mercados están cerrados, se producen diversos acontecimientos
FREE

Este es un ZigZag no paramétrico que proporciona 4 métodos diferentes de cálculo. El borde ascendente continúa en las nuevas barras mientras sus "máximos" están por encima del "mínimo" más alto entre las barras anteriores, el borde descendente continúa en las siguientes barras mientras sus "mínimos" están por debajo del "máximo" más bajo entre los anteriores; Oscilación de Gann: el flanco alcista continúa mientras los máximos y mínimos son más altos que en la barra adyacente izquierda, el flanc
FREE

Este EA se basa en observaciones estadísticas de cómo se mueve un precio después de que las bolsas americanas, europeas o asiáticas estén abiertas.
Puede ajustar este EA según su par de divisas favorito, su rango de precios diario, su tolerancia al riesgo y la sensibilidad de la señal. Cómo funciona:
El EA toma los niveles de precios Hi-Lo (ATR) del rango de tiempo establecido por el operador y busca la ruptura de uno de los niveles durante las horas de negociación. Si el nivel se rompe y se cu
Robofxea Pro - Sistema de Trading Automatizado para XAUUSD y BTCUSD Robofxea Pro es un sistema de trading automatizado diseñado para XAUUSD (Oro) y BTCUSD (Bitcoin). El sistema utiliza una estrategia de ruptura con órdenes pendientes e incluye características de gestión de riesgos tales como hard stop loss en cada operación, filtrado de noticias y protección de spreads. El sistema no utiliza martingala, rejilla, o estrategias de promediación. Resultados de operaciones en vivo Ver el rendimiento

El indicador muestra las pérdidas y ganancias (PnL) del día actual directamente en el gráfico de negociación. Anclado en la esquina superior derecha, muestra "PnL: [cantidad]"-verde si está arriba, rojo si está abajo, blanco si es cero. Cada vez que cierra una operación, se actualiza al instante, sumando sus beneficios, comisiones y swaps de todas las operaciones de compra y venta realizadas desde medianoche. Sin complicaciones, sin gráficos adicionales, sólo información en tiempo real sobre có
FREE

Para comentarios, conexión gratuita a la señal, PROGRAMA DE SOCIOS e información detallada : Facebook Bienvenido al indicador "Breakeven Line", versión 1.1, desarrollado por Sergei Ivanov en 2025. Visualice los niveles de precio de equilibrio para sus operaciones con precisión y facilidad. Descripción del Asesor El "Breakeven Line" es un indicador de MetaTrader (MQL5) que muestra los niveles de precios de equilibrio para las posiciones abiertas de compra y venta en el símbolo actual, teniend
FREE

STAMINA HUD - Panel avanzado de mercado y tendencias (MT5) STAMINA HUD es un panel de información de mercado profesional diseñado para operadores que desean claridad, velocidad y control directamente en el gráfico. Proporciona un Head Up Display (HUD) limpio con los datos esenciales del mercado y la dirección de la tendencia en múltiples marcos de tiempo , sin saturar el gráfico o generar señales de trading.
Qué muestra STAMINA HUD Precio actual
Spread (en pips reales)
Rango al
FREE

Panel Cuantitativo Pro
El Tablero de Rendimiento Multi-EA Definitivo para Traders Cuantitativos ¡Deja de alternar entre múltiples gráficos o herramientas externas para monitorear tus estrategias algorítmicas! Quant Panel Pro ofrece monitoreo de portafolio de nivel institucional en una interfaz profesional y elegante. Características Clave Análisis Cuantitativo al Alcance de tu Mano Agregación de ganancias/pérdidas (P&L) en tiempo real para todos tus Expert Advisors Análisis estadístico de tasa

El indicador Simple ICT Concepts es una potente herramienta diseñada para ayudar a los operadores a aplicar los principios de la metodología Inner Circle Trader (ICT). Este indicador se centra en identificar zonas clave como los niveles de liquidez, el soporte y la resistencia, y la estructura del mercado, lo que lo convierte en un activo inestimable para los operadores de acción de precios y conceptos de dinero inteligente.
Características principales Estructura del mercado: Las etiquetas de e

Descripción completa Descripción general Drawdown Controller Calculator Indicator es una herramienta profesional avanzada de gestión de riesgos para MetaTrader 5 , especialmente diseñada para los comerciantes que utilizan múltiples operaciones en ejecución, órdenes pendientes, sistemas de cuadrícula y estrategias de martingala . Este indicador le permite ver el futuro drawdown de antemano - no sólo para las operaciones en curso, sino también para todas las órdenes pendientes combinadas , s
FREE

Presentando CandleBot - Tu Herramienta Definitiva y Gratuita para Identificar y Operar con Patrones de Velas! Con CandleBot, aprovecha la ventaja en los mercados reconociendo fácilmente señales alcistas y bajistas de engullimiento, estrellas de la mañana y de la tarde, y patrones de martillo. Los patrones de velas, derivados de los precios de apertura, máximo, mínimo y cierre en un período específico, sirven como representaciones visuales de los movimientos de precios, ayudando a los traders a a
FREE

Introducción Los patrones armónicos se utilizan para predecir posibles puntos de inflexión. Tradicionalmente, los patrones armónicos se identificaban manualmente conectando puntos máximos y mínimos en el gráfico. La detección manual de patrones armónicos es dolorosamente tediosa y no es adecuada para todo el mundo. A menudo se está expuesto a la identificación subjetiva de patrones con la detección manual de patrones. Para evitar estas limitaciones, Harmonic Pattern Plus ha sido diseñado para au

El EA utiliza una estrategia de scalping en una ruptura, utiliza tecnologías avanzadas innovadoras utilizando una red neuronal. Para crear el EA , hemos utilizado los últimos algoritmos avanzados para encontrar los mejores momentos para entrar en el mercado. El EA utiliza muchos filtros inteligentes para adaptarse a casi cualquier situación económica. El EA establece una orden stop de protección, por lo que el trader no tiene que preocuparse de que el robot permita drawdowns significativos. El a

This universal Expert Advisor is equally good for both scalping and conservative multi-currency trading of simultaneous trading of several pairs. This Expert Advisor is based on its own Algorithm, which is an incredibly effective tool due to the simultaneous operation of a trading strategy based on our Centered Bands Indicator and our proprietary signal filter system together with the Martingale method, which together work out a very interesting hedging system. Traders are also given the

EA de scalping de doble EMA - Cruce limpio con lógica de inversión Este Asesor Experto utiliza una estrategia inteligente de cruce de EMA a través de dos marcos temporales diferentes para entrar en operaciones con alta precisión. Sólo se realiza una operación cuando la EMA rápida cruza la EMA lenta , confirmando los cambios de tendencia a corto plazo. También incluye lógica de inversión automática , SL/TP basado en el precio y un sistema opcional de trailing stop . Características principale
FREE

Una herramienta profesional para el trading - el indicador de divergencia entre el AO y el precio, que le permite recibir una señal sobre un cambio de tendencia de manera oportuna o captar movimientos de retroceso del precio (dependiendo de la configuración). La configuración del indicador le permite ajustar la fuerza de la divergencia debido al ángulo de los picos de la AO y el porcentaje de cambio en el precio, lo que hace posible afinar la fuerza de la señal. El código del indicador está opt
FREE
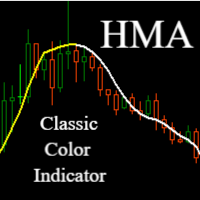
Hull Moving Average (HMA) - Seguimiento de tendencias más rápido y preciso
La media móvil de Hull representa un enfoque revolucionario del análisis de tendencias que supera las deficiencias habituales de las medias móviles tradicionales. Este avanzado indicador, desarrollado por Alan Hull, elimina prácticamente el retardo típico de las medias móviles estándar, al tiempo que mantiene una suavidad de señal excepcional.
Principales ventajas:
Respuesta significativamente más rápida a los cambios
FREE

TimeToClose El indicador "TimeToClose" es una herramienta esencial para los traders que necesitan monitorear el tiempo restante antes de que una vela se cierre. Este indicador visualiza el tiempo restante directamente sobre la línea de BID, proporcionando una referencia clara y precisa durante el trading en tiempo real. Características principales: Visualización del tiempo restante para el cierre de la vela actual. Integración directa sobre la línea de BID para una mejor visualización. Configura
FREE

Indicador BreakHarmony Multi-Timeframe Breakout para MT5
El indicador BreakHarmony Multi-Timeframe Breakout para MT5 es una herramienta muy avanzada que proporciona información sobre los puntos de ruptura a través de diferentes marcos temporales, ayudando a los operadores en la toma de decisiones y la comprensión de los movimientos del mercado. [ Features and Manual | MT4 version | All Products ] Los precios de ruptura se indican con el precio de cierre de la vela correspondiente, mien
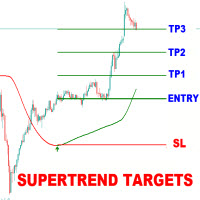
Supertrend Targets Signal es un potente indicador de seguimiento de tendencias y confirmación de rupturas diseñado para ayudar a los operadores a identificar puntos de entrada de alta probabilidad , visualizar zonas objetivo dinámicas y recibir señales limpias y fiables en diversas condiciones de mercado. La lógica principal de la tendencia se basa en una Supertendencia personalizada que utiliza una estructura de banda basada en el ATR con largas cadenas de suavizado -primero a través de una WMA

El indicador analiza el volumen desde cualquier punto y calcula los niveles de agotamiento del mercado para ese volumen. Líneas principales de Meravith: Línea de agotamiento de volumen alcista – sirve como objetivo. Línea de agotamiento de volumen bajista – sirve como objetivo. Línea de tendencia – indica la tendencia del mercado. Cambia de color según si el mercado es alcista o bajista, y actúa como soporte de la tendencia. Cómo usarlo: haga doble clic en la línea vertical púrpura y muévala a l

RiskRewardPanel — Herramienta de cálculo de riesgo y beneficio para MetaTrader 5 RiskRewardPanel es una utilidad diseñada para ayudar a los traders a planificar sus operaciones calculando el tamaño del lote, el stop loss y el take profit en función de los parámetros de riesgo definidos por el usuario. Proporciona una forma visual de gestionar el riesgo directamente desde el gráfico. Características principales: Cálculo de riesgo y beneficio
Muestra el riesgo estimado en dólares y la ganancia p
FREE
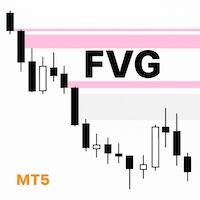
Lo que hace único al indicador UTurn FVG Soy un comerciante, y he construido un indicador FVG simple y limpio que se centra en lo que los comerciantes realmente necesitan. Ajustes flexibles de color y transparencia. La opción de extender FVGs no mitigados y parcialmente mitigados al precio actual. Eliminación automática de los FVG totalmente mitigados. Confirmación visual clara cuando ya se ha comprobado un FVG. Un aspecto limpio y profesional que ayuda a los operadores a tomar decisiones más r
FREE

Panel Phoenix Spread (MT5)
Panel de monitoreo de spreads en tiempo real para MetaTrader 5. Muestra el spread actual entre la oferta y la demanda en puntos en su gráfico.
Propósito
La expansión del spread es una de las fuentes de pérdidas comerciales más ignoradas. Durante la baja liquidez, los rollovers, los eventos noticiosos o las condiciones volátiles, los spreads pueden ampliarse drásticamente, convirtiendo operaciones que de otro modo serían válidas en pérdidas instantáneas.
El panel de
FREE

If you love this indicator, please leave a positive rating and comment, it will be a source of motivation to help me create more products <3 ¿Cómo utilizar SuperTrend? Cuando el precio cruza por encima de la línea de supertendencia señala una señal de compra y cuando el precio cruza por debajo de la línea de supertendencia señala una señal de venta. El indicador de supertendencia que actúa como un nivel dinámico de soporte o resistencia y ayuda a los operadores a tomar decisiones informadas sob
FREE

GBPUSD Trading Robot for H1 Chart Pound Swing es un Asesor Experto de alta precisión diseñado exclusivamente para operar el par GBPUSD en el marco temporal H1, con un enfoque principal en la sesión de Londres —la más volátil y activa del mercado forex.
Diseñado para prosperar en condiciones de alta velocidad, Pound Swing aprovecha un sistema especializado de reconocimiento de patrones armónicos de velas únicos de la sesión londinense. Estos patrones están calibrados específicamente para detectar
Candle Countdown Pro - Timeframe en Tiempo Real & Spread Tracker ¿Te gusta? ¿Odiarlo? ¡Házmelo saber en un comentario! Las solicitudes de características e ideas para nuevas herramientas son muy apreciadas :) Pruebe "The AUDCAD Trader ":
https://www.mql5.com/en/market/product/151841 Candle Countdown Pro es una herramienta de trading esencial que muestra cuentas atrás en tiempo real para múltiples marcos temporales,
monitorización de spreads en vivo , e información clave de trading-todo en un pa
FREE

¡Market Heartbeat está en su mano! *** Contacta conmigo para enviarte "Trend Finder indicator " gratis y añadirte en "Market Heartbeats group" para compartir o ver experiencias con otros usuarios. Introducción El indicador Market Heartbeat con un algoritmo especial mejorado ( volumen, flujo de dinero, ciclo de mercado y un valor secreto) es un buscador de tendencias muy repetitivo con una alta tasa de éxito . Curiosamente , este indicador Winner indica que la tendencia ha cambiado su dirección o

Vwap simple con el diario, semanal y mensual
VWAP es la abreviatura de precio medio ponderado por volumen , que es una herramienta de análisis técnico que muestra la relación entre el precio de un activo y su volumen total de operaciones. Proporciona a los operadores e inversores una medida del precio medio al que se negocia una acción durante un periodo de tiempo determinado.
Cómo se utiliza Identificar los puntos de entrada y salida : los operadores pueden utilizar el VWAP para determinar c
FREE

El indicador muestra grupos de volúmenes o perfiles de volúmenes entre los que elegir. Para los símbolos comerciales que contienen la cinta de operaciones, el indicador puede realizar cálculos basados en la cinta de operaciones.
Variables de entrada
StepPoint - paso de cluster en puntos, si el valor es cero, el paso se asigna automáticamente. HistoryTicks - tamaño del historial de ticks (para VolumeType en el modo TimeAndSales). AssociatedTimeframe - vinculación del indicador al marco temporal

El comportamiento de los diferentes pares de divisas está interconectado. El indicador Visual Correlation le permite mostrar diferentes instrumentos en 1 gráfico mientras mantiene la escala. Puede definir correlación positiva, negativa o sin correlación.
Algunos instrumentos comienzan a moverse antes que otros. Dichos momentos se pueden determinar superponiendo gráficos.
Para mostrar un instrumento en un gráfico, ingrese su nombre en el campo Symbol .
Version for MT4 https://www.mql5.
FREE
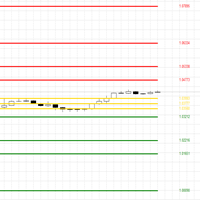
El indicador CPR (Central Pivot Range) es una potente herramienta de análisis técnico diseñada para identificar niveles clave de soporte y resistencia en sus gráficos de MetaTrader 5. Calcula el Pivote Central (CP) como la media de los precios máximo, mínimo y de cierre del día anterior, proporcionando un punto de referencia central. Calcula y traza 11 niveles de pivote (CP, BC, TC, S1-S4, R1-R4) Periodo de retrospectiva ajustable (por defecto: 5 días) Opción de mostrar u ocultar etiquetas de pr
FREE
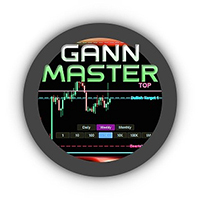
Legendarios niveles de William Gann en un indicador MT5 totalmente automatizado. GANN Master identifica las zonas clave donde el precio tiene más probabilidades de revertir o continuar su tendencia, basándose en datos diarios, semanales y mensuales. Características clave: Botones de un solo clic para periodos: pulsa Daily, Weekly o Monthly para trazar al instante las zonas correspondientes al día, la semana o el mes actuales Modos Automático y Manual
• Automático: GANN Master calcula todos los

Sencilla utilidad para ayudar a identificar la hora local de los movimientos de precios. Así podrá analizar mejor y prepararse para futuros movimientos. Sólo tiene que apuntar a la vela y se mostrará el tiempo de la vela en su zona horaria local.
Vea mis otros productos en el mercado MQL: https://www.mql5.com/en/users/jdelgadocr/seller Gracias por comprobarlos. Si usted tiene una necesidad de algo no demasiado complejo, hágamelo saber.
FREE

Esta estrategia de supertendencia le permitirá entrar en largo o en corto a partir de un cambio de tendencia de supertendencia. Tanto el periodo ATR como el multiplicador ATR son ajustables. Si marca la opción "Cambiar el método de cálculo de ATR", el cálculo se basará en el SMA y le dará resultados ligeramente diferentes, que pueden funcionar mejor dependiendo del activo. Asegúrese de introducir el deslizamiento y la comisión en las propiedades para obtener resultados realistas. Si quiere opera
FREE

Una implementación personal de un famoso principio de tendencia conocido como higher high, higher close, lower low, lower close (HHHC - HHHL). Utiliza únicamente la acción del precio para determinar la dirección de la tendencia, los cambios de tendencia y las zonas de retroceso. [ Guía de instalación | Guía de actualización | Solución de problemas | FAQ | Todos los productos ] Periodo de ruptura personalizable Colores y tamaños personalizables No repinta ni retropinta Implementa alertas de todo
FREE
Importante: El precio aumentará a 150$ después de 8 compras más Cada comprador de este indicador también recibe de forma gratuita: El exclusivo EA Signal Reacter, que ejecuta automáticamente cada Señal una guía paso a paso para ayudarle a instalar el Signal Capturer Nota: Para reclamar su EA gratuito, simplemente envíeme un mensaje rápido en MQL5.
Les presento a la original, herramienta de desarrollo propio que agarra señales premium de los mejores servicios como el bombardero Divergencia, Alg
++++++++++++++++++++++++++++++++++ +++ Herramienta de tendencias ++++++++++++++++++++++++++++++++++ Hola Trader, Esta es una herramienta de tendencia que utilizo ... basado en cuatro medias móviles. Precio por debajo o por encima de la EMA200 es indicación de la tendencia a largo plazo. También cuenta la dirección de la pendiente. Usted puede personalizar en la configuración si lo desea. La herramienta está alineada con mi Sistema de Pronóstico y las Zonas de Rebote. - Sistema de Previsión --> h
FREE

Base teórica El VWAP es una media móvil ajustada al volumen, es decir, el peso de cada precio corresponde al volumen de acciones negociadas en el periodo, dando más importancia al periodo en el que hay más operaciones. [1] VWAP = suma(precio[i]*volumen[i]) / suma(volumen[i]) Metodología Puede configurar el periodo que se utilizará para calcular el VWAP, el color, el grosor y el estilo de la línea. La línea se traza desde el principio de la serie disponible una sola vez para ahorrar recursos inf
FREE
Simple Spread Indicator (SSI) es un indicador sencillo y ligero que muestra el valor actual del diferencial directamente en la ventana principal del gráfico.
Ayuda a los operadores a reconocer al instante las condiciones de liquidez del mercado y los costes de negociación sin necesidad de abrir paneles o herramientas adicionales. Características Visualización del diferencial en tiempo real en el gráfico principal Posición y tamaño de fuente personalizables Carga mínima del sistema y sin almacena
FREE
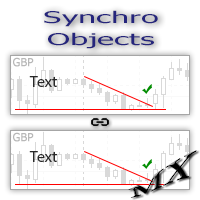
La utilidad SynchroObjects está diseñada para facilitar y acelerar el trabajo con construcciones gráficas en distintos gráficos de un mismo símbolo. La utilidad SynchroObjects clona los objetos creados en todos los gráficos en los que se esté ejecutando la utilidad y que tengan el mismo símbolo. Además, modifica sus propiedades de forma sincrónica. La utilidad es fácil de usar y no requiere configuración. Sugerencia: Si consulta el historial con frecuencia, le recomendamos que instale también la
FREE

El indicador SMC Venom Model BPR es una herramienta profesional para operadores que trabajan con el concepto de Dinero Inteligente (SMC). Identifica automáticamente dos patrones clave en el gráfico de precios: FVG (Fair Value Gap) es una combinación de tres velas, con un gap entre la primera y la tercera. Forma una zona entre niveles donde no hay soporte de volumen, lo que suele provocar una corrección del precio. BPR (Balanced Price Range) es una combinación de dos patrones FVG que forman

Descripción corta Consensus MTF es un indicador gratuito de alineación multi-timeframe diseñado para mostrar el contexto real del mercado .
No genera señales de entrada ni salida. Su objetivo es ayudar a evitar operar cuando el mercado no está alineado . Descripción completa Consensus MTF analiza la dirección del mercado en varios timeframes simultáneamente, evaluando la posición del precio respecto a su nivel de equilibrio en cada marco temporal. Cada timeframe se clasifica de forma indep
FREE
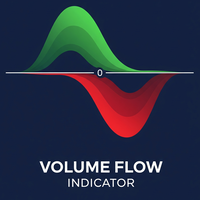
Indicador de flujo volumétrico (VFI) - Manual del usuario 1. 1. Introducción general El Indicador de Flujo de Volumen (VFI) es un oscilador técnico avanzado diseñado para medir la fuerza y la sostenibilidad de una tendencia de precios mediante la incorporación de datos tanto de precios como de volumen. Desarrollado sobre la base de los conceptos de Volumen en Balance (OBV), pero con mejoras significativas, el VFI proporciona una visión más profunda del flujo de dinero y la convicción detrás de l
FREE
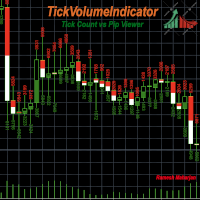
Existen varios indicadores y métodos para identificar tendencias en un gráfico. TickVolumeIndicator es uno de ellos. Ayuda a identificar y predecir tendencias futuras mostrando tendencias pasadas con datos de ticks.
TickVolumeIndicator es un indicador que colorea las velas visibles en el gráfico utilizando el volumen de ticks. El volumen de ticks se calcula con los valores de oferta y demanda. Los usuarios pueden elegir entre el recuento de oferta y demanda de ticks o los cambios de pips para
FREE

Thermo MAP es un indicador multidivisa y multihorario que muestra un mapa de calor inteligente basado en cálculos propios. Observe cómo se ha movido y se está moviendo actualmente el mercado Forex con un único panel de control y tenga una idea coherente y precisa de lo que está sucediendo.
Puede ser adecuado tanto para scalping o medio / largo plazo, sólo tienes que seleccionar las opciones que mejor se adapten a su estilo de negociación La lista de símbolos se ordena automáticamente en función
FREE

Oro Reversal X1: El EA inteligente de cambio de tendencia para XAUUSD Gold Reversal X1 es un asesor experto diseñado para operar con XAUUSD (oro) en el marco temporal H1 , centrándose específicamente en los principales puntos de cambio de tendencia. Este EA está diseñado para los operadores que aprecian un enfoque estratégico con una menor frecuencia de operaciones, con un promedio de alrededor de 5 órdenes por mes.
Find more EAs to fit your strategy: Click Here
Estrategia principal y carac
FREE

Mahdad Candle Timer es un indicador ligero y preciso para MetaTrader 5 que muestra el tiempo restante hasta el cierre de la vela actual, directamente al lado de la última barra. Está diseñado para traders que dependen de una sincronización exacta, ya sea en scalping, day trading o esperando la confirmación de una vela en configuraciones de swing. Características principales Cuenta regresiva precisa – Tiempo restante en formato HH:MM:SS (opcional milisegundos) Colocación dinámica – Siempre al
FREE
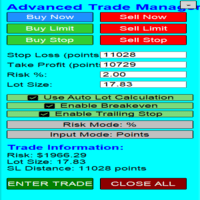
Visión general ¿Está cansado de complejos cálculos manuales, errores emocionales de ejecución y el miedo constante a arriesgar demasiado? El Advanced Trade Manager (ATM) es su solución todo-en-uno, un Asesor Experto de nivel profesional para MetaTrader 5 diseñado para darle el control de nivel institucional sobre todos los aspectos de su comercio. Desde el impecable cálculo del riesgo hasta la ejecución inteligente con un solo clic, el EA ATM agiliza todo su proceso de negociación, lo que le per
FREE
Special offer : ALL TOOLS , just $35 each! New tools will be $30 for the first week or the first 3 purchases ! Trading Tools Channel on MQL5 : Join my MQL5 channel to update the latest news from me Kalman Trend Levels es un indicador avanzado de seguimiento de tendencias que utiliza la tecnología de filtro de Kalman de vanguardia para proporcionar a los traders potentes señales analíticas. Diseñado para ser preciso y adaptable, esta herramienta no solo identifica zonas críticas de

Las principales funciones del indicador es determinar y marcar en el histograma del indicador Accelerator Oscillator las señales comerciales que han sido descritas por Bill Williamas en su libro “Nuevas Dimensiones de Trading”. A saber: La señal de compra cuando el histograma del indicador se encuentra por debajo de la línea cero. La señal de venta cuando el histograma del indicador se encuentra por debajo de la línea cero. La señal de venta cuando el histograma del indicador se encuentra por en
FREE

Ultimate Candle Countdown – ¡Nunca más te pierdas el cierre de una vela! Lleva tu precisión de trading al siguiente nivel con Ultimate Candle Countdown – el temporizador de cuenta regresiva para velas, limpio, ligero y potente, diseñado para todos los marcos de tiempo y todos los símbolos.
Ya sea que hagas scalping en M1, swing trading en H1 o sigas los cierres diarios/semanales, esta herramienta te asegura que siempre sepas exactamente cuánto tiempo queda antes de que abra la próxima vela.
FREE

Presentando una Solución Evolutiva de Trading: El Asesor Experto con 16+ Estrategias Desbloqueando el potencial del trading automatizado, nos enorgullece presentar un Asesor Experto (EA) que encapsula más de 16 estrategias rentables en una única y sólida herramienta. Este EA presume de un enfoque integral para el trading sin emplear tácticas riesgosas como las estrategias de cuadrícula o martingala, asegurando una experiencia de trading segura y confiable. Seguridad como Prioridad: El pilar de
FREE

x4o B1 Dollar Trader Estrategia Heiken Ashi Trend Retest
Sistema de trading automatizado que combina el análisis Heiken Ashi con la metodología Moving Average Retest para entradas de seguimiento de tendencia en el marco temporal H1. Metodología de negociación El EA monitoriza dos Medias Móviles de 25 periodos calculadas sobre precios máximos y mínimos para identificar la dirección de la tendencia. Cuando el precio cierra por encima de la MA Alta con la vela alta excediendo la media móvil, se de
FREE

El temporizador de cuenta atrás de velas para MetaTrader 4 (también disponible para MT5) es un indicador vital diseñado para ayudarle a gestionar su tiempo de negociación con eficacia. Le mantiene informado sobre las horas de apertura y cierre del mercado mostrando el tiempo restante antes de que se cierre la vela actual y se forme una nueva. Esta potente herramienta le permite tomar decisiones de negociación bien informadas. Características principales: Rango de Asia: Viene con una opción para
FREE

Indicador de soporte-resistencia El indicador "Soporte Resistencia" es una herramienta versátil diseñada para ayudar a los operadores a identificar los niveles clave de soporte y resistencia basándose en un algoritmo subyacente. Estos niveles indican los puntos de precio en los que un activo ha experimentado históricamente presiones de compra (soporte) o de venta (resistencia). El indicador permite a los operadores visualizar estos niveles en sus gráficos, lo que facilita la toma de decisiones i
FREE
VERSIÓN COMPLETA https://www.mql5.com/en/market/product/145203?source=Site https://www.mql5.com/en/users/gedeegi/seller
GEN TurboTrend Signals es un indicador de tendencia adaptativo basado en la volatilidad, diseñado para ayudar a los operadores a identificar las direcciones de las tendencias dominantes, los puntos clave de transición del impulso y las zonas de toma de beneficios proyectadas de una manera visual e intuitiva. El indicador utiliza una media móvil ponderada temporalmente combina
FREE
Compruebe lo fácil y sencillo que es comprar un robot en la MetaTrader AppStore, la tienda de aplicaciones para la plataforma MetaTrader.
El Sistema de pago MQL5.community permite efectuar pagos con ayuda de PayPal, tarjeta bancaria y los sistemas de pago más populares. Además, le recomendamos encarecidamente testar el robot comercial antes de la compra, para así hacerse una idea más completa sobre él.
Está perdiendo oportunidades comerciales:
- Aplicaciones de trading gratuitas
- 8 000+ señales para copiar
- Noticias económicas para analizar los mercados financieros
Registro
Entrada
Si no tiene cuenta de usuario, regístrese
Para iniciar sesión y usar el sitio web MQL5.com es necesario permitir el uso de Сookies.
Por favor, active este ajuste en su navegador, de lo contrario, no podrá iniciar sesión.