Chart Time MT5
- インディケータ
- バージョン: 1.0

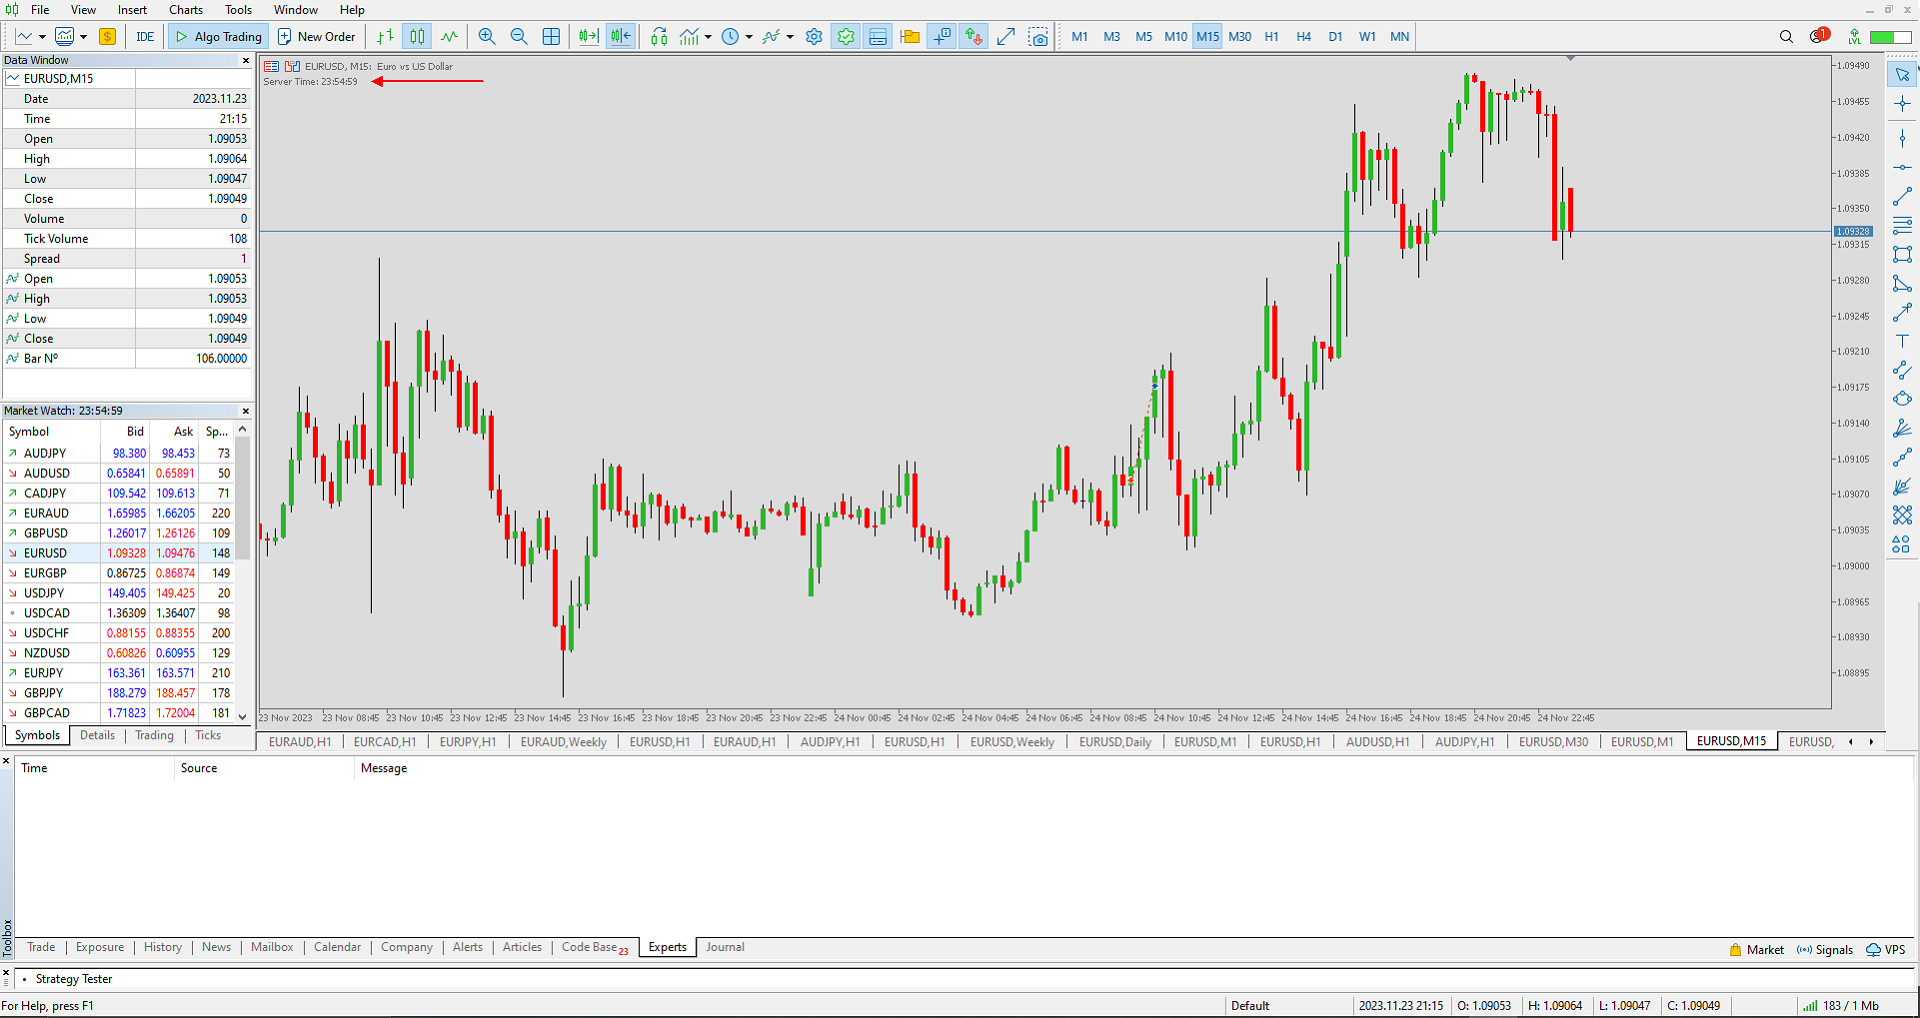
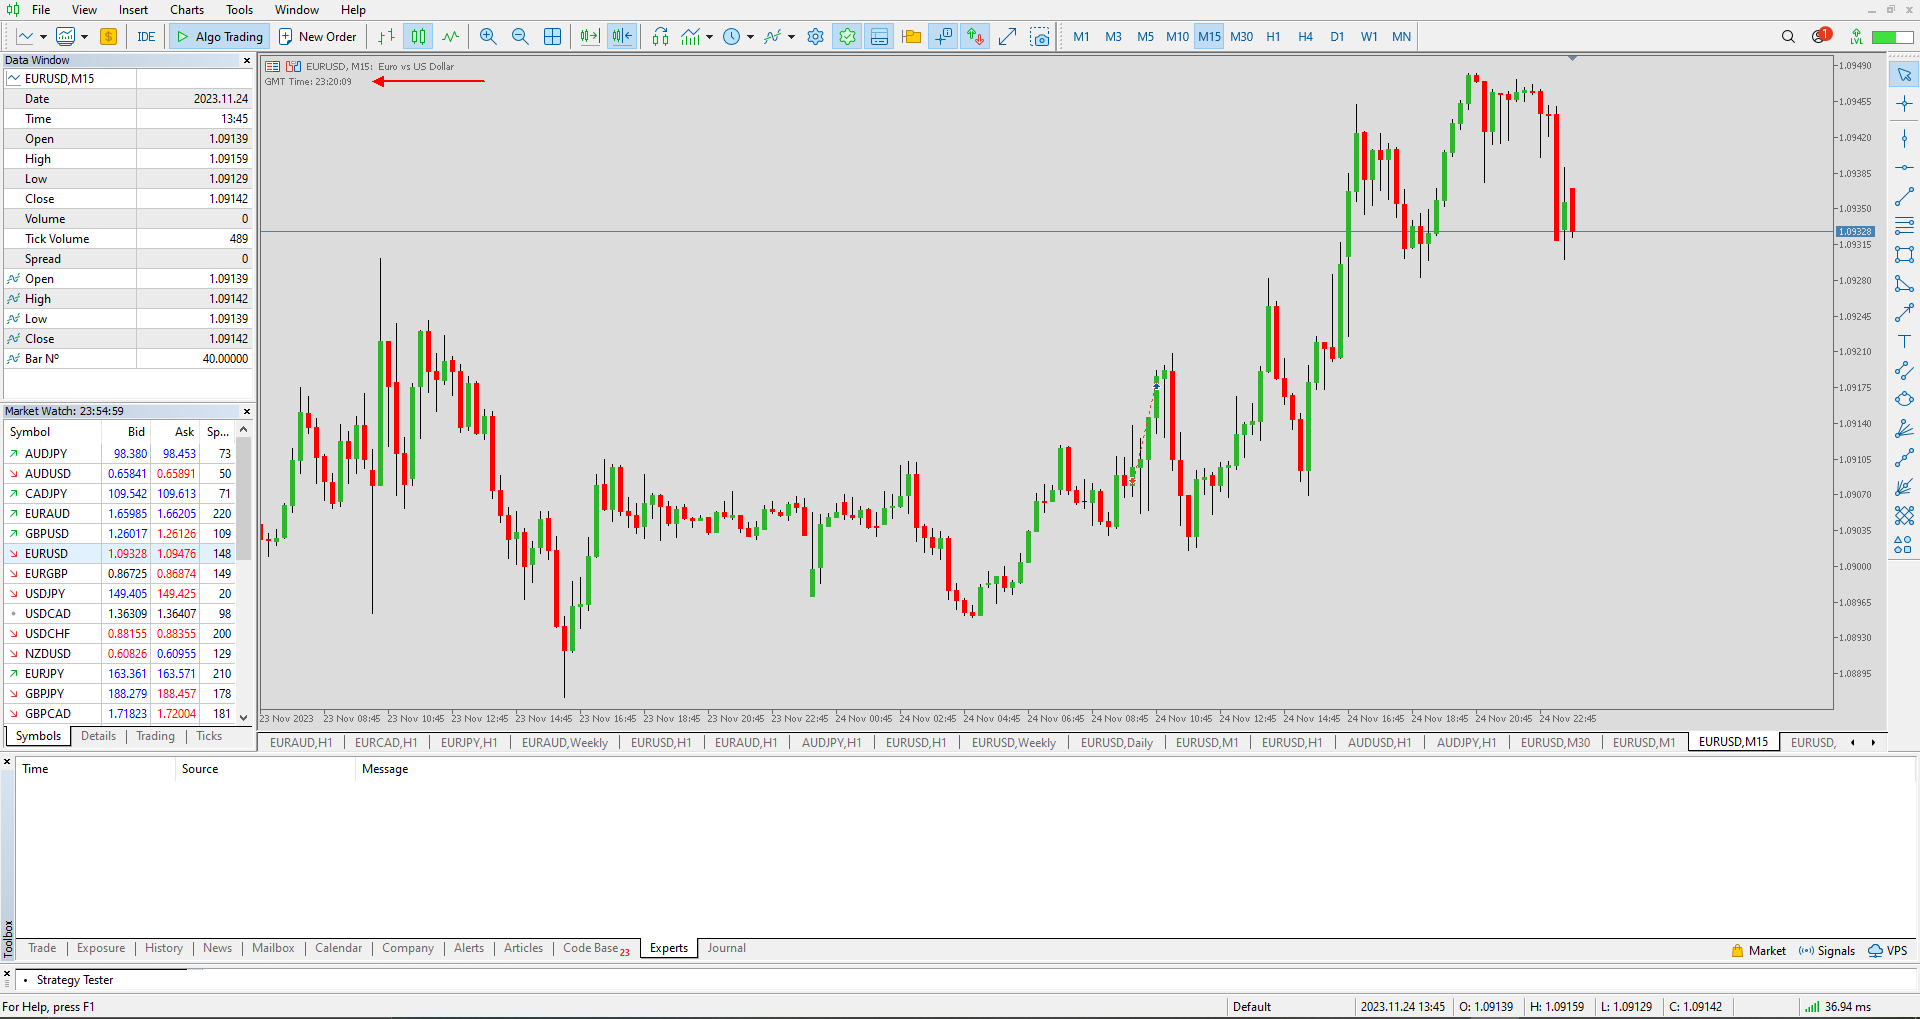
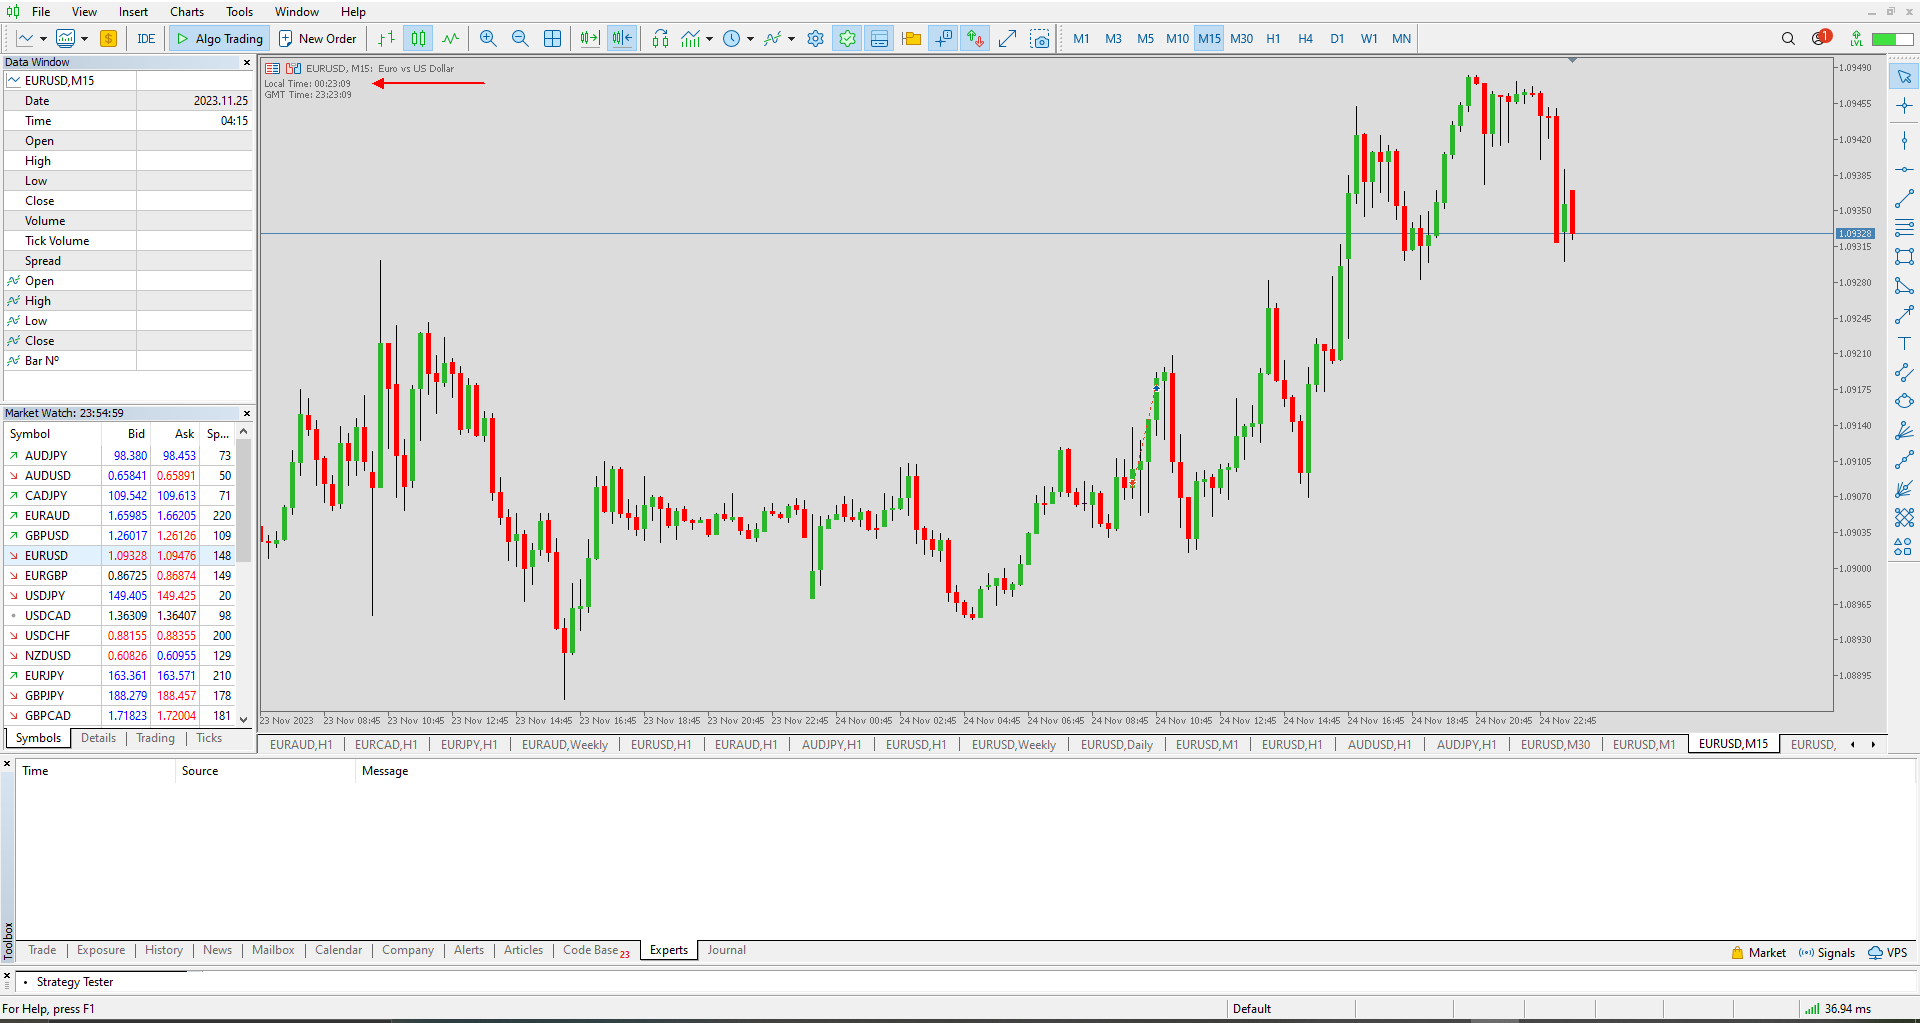
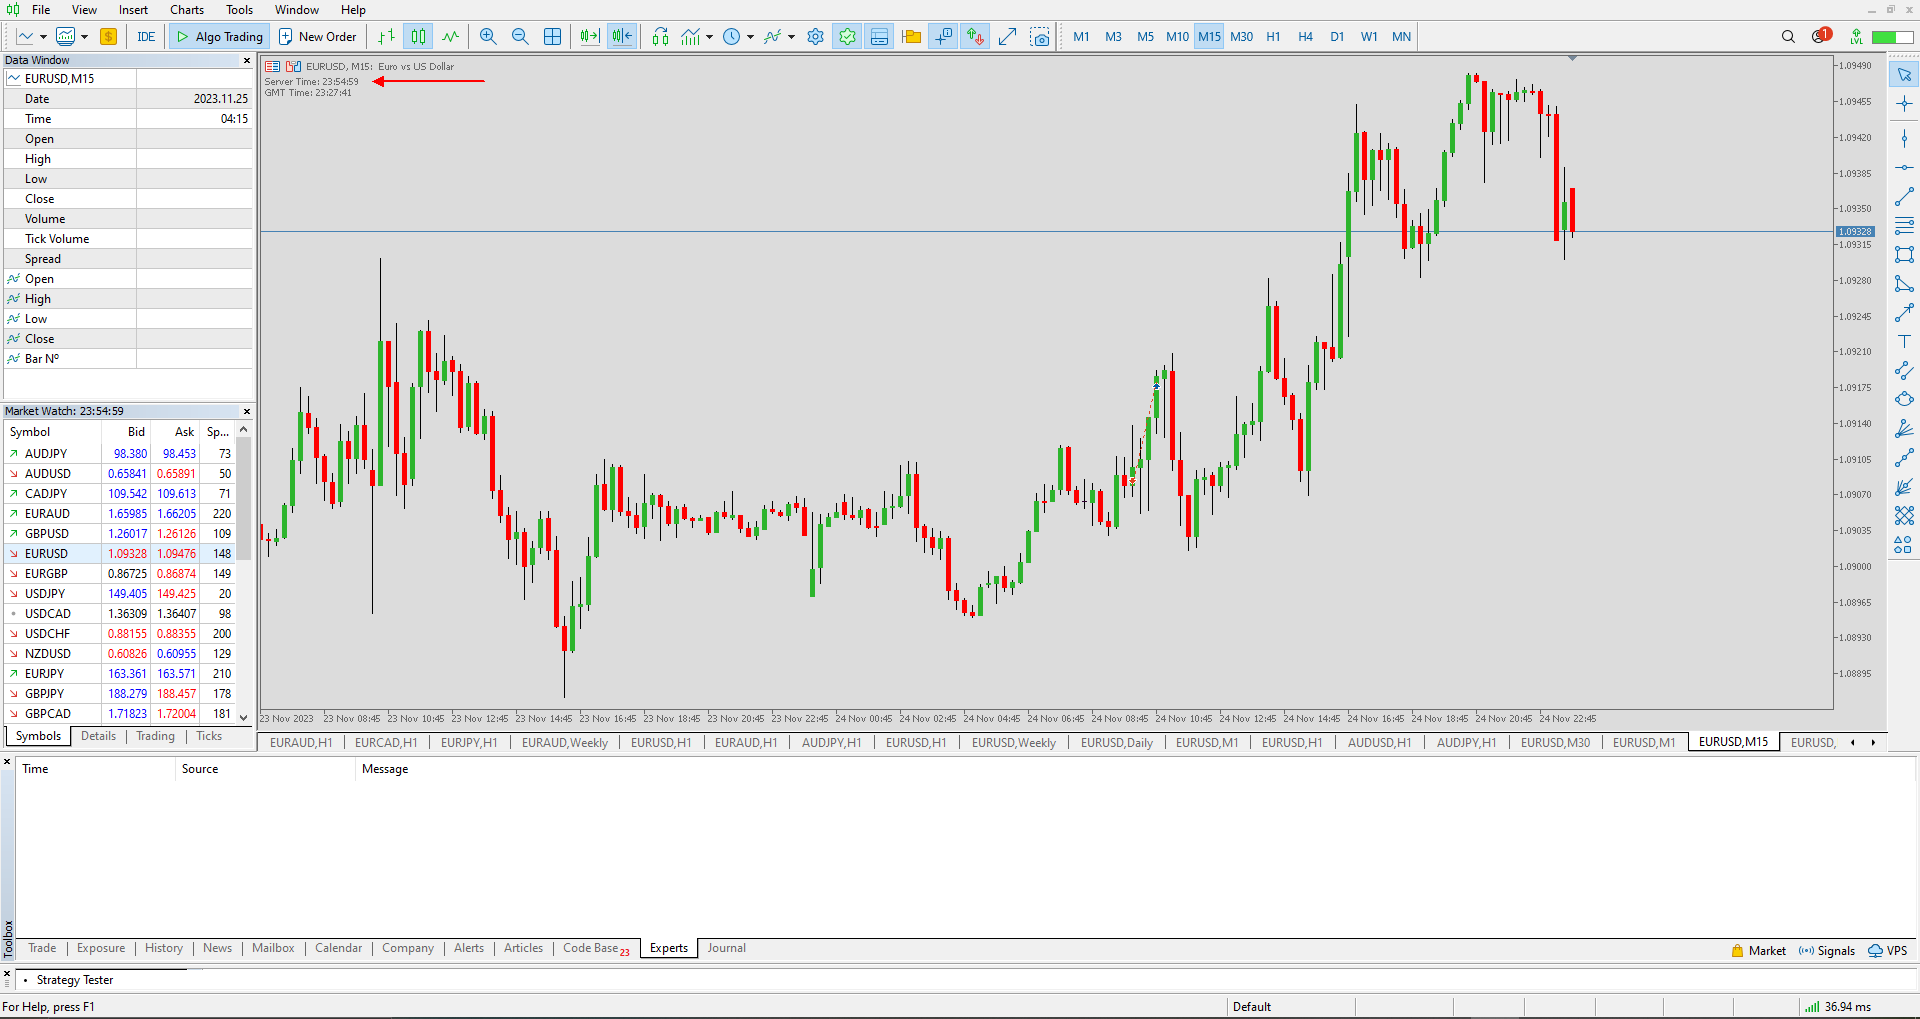
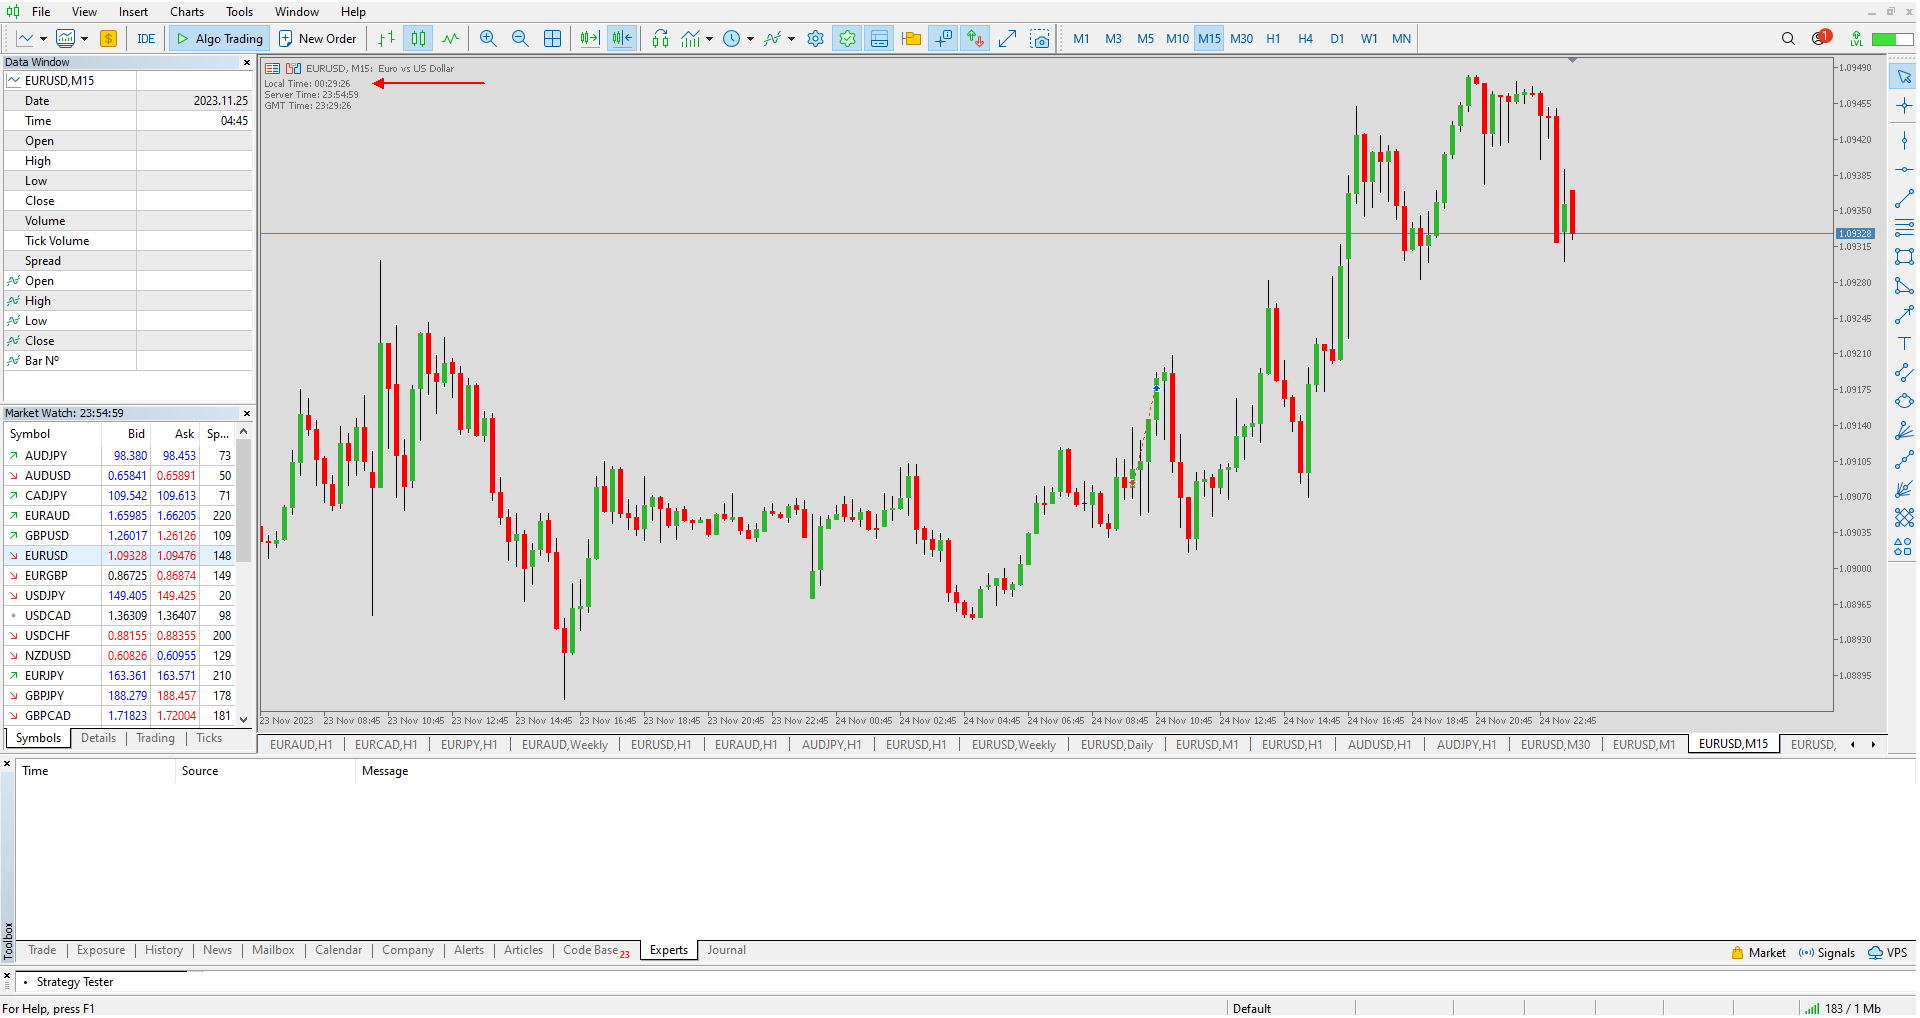
- Chart Time Indicator is very simple and easy, but it can be very important to control the time before opening any manual trade. This indicator shows the time on the chart between 3 different options.
Input Parameters:
- Show Time: Select all the time options that you want to see. Local Time (Personal Computer Time), Server time (Broker Time) or GMT Time.
Recommendations:
- Use only one Chart Time Indicator for each Chart.