無料でロボットをダウンロードする方法を見る
Twitter上で私たちを見つけてください。
私たちのファンページに参加してください
私たちのファンページに参加してください
スクリプトを気に入りましたか?MetaTrader 5ターミナルの中でそれを試してみてください。

ytg_2MA_4Level. - MetaTrader 4のためのエキスパート

- ビュー:
- 17850
- 評価:
- パブリッシュ済み:
- アップデート済み:
-
 取引の機会を逃しています。
- 無料取引アプリ
- 8千を超えるシグナルをコピー
- 金融ニュースで金融マーケットを探索
-
 このコードに基づいたロボットまたはインジケーターが必要なら、フリーランスでご注文ください
フリーランスに移動
このコードに基づいたロボットまたはインジケーターが必要なら、フリーランスでご注文ください
フリーランスに移動
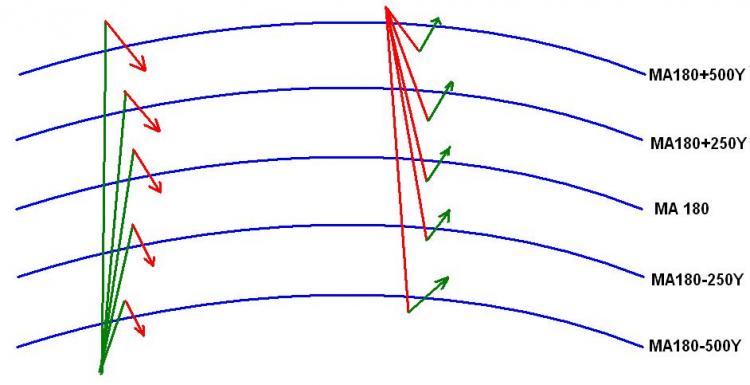
Principle of job:
2 SMA - first with parameters 14, second with 180.
Also there are parallel lines:
SMA 180 + 250 items on Y
SMA 180 + 500 items on Y
SMA 180 - 250 items on Y
SMA 180 - 500 items on Y
At crossing MA14 any line, occurs either Buy, or Sell.
| Symbol | EURUSD (Euro vs US Dollar) | ||||
| Period | 1 Hour (H1) 2009.02.19 00:00 - 2009.03.18 23:00 (2009.02.19 - 2009.03.19) | ||||
| Model | Every tick (the most accurate mode based on the shortest available time frames) | ||||
| Parameters | _____1_____="Trading settings "; take_profit=1000; stop_loss=1000; lots=3; _____2_____="Indicator settings "; calculated_bar=4; fast_МА_period=20; fast_МА_method=2; price_const_of fast_МА=4; slow_МА_period=180; slow_МА_method=2; price_const_of slow_МА=4; _____3_____="Level settings "; upper_1=950; upper_2=300; lower_1=750; lower_2=450; | ||||
| Bars in test | 1476 | Ticks modeled | 867857 | Modeling quality | 90.00% |
| Mismatched chart errors | 5 | ||||
| Initial deposit | 10000.00 | ||||
| Total net profit | 17882.10 | Gross profit | 23990.10 | Gross loss | -6108.00 |
| Profit factor | 3.93 | Expected payoff | 1788.21 | ||
| Absolute drawdown | 4755.30 | Maximum drawdown | 5607.30 (51.67%) | Relative drawdown | 51.67% (5607.30) |
| Total trades | 10 | Short positions (won %) | 2 (100.00%) | Long positions (won %) | 8 (75.00%) |
| Profit trades (% of total) | 8 (80.00%) | Loss trades (% of total) | 2 (20.00%) | ||
| Largest | profit trade | 3000.00 | loss trade | -3054.00 | |
| Average | profit trade | 2998.76 | loss trade | -3054.00 | |
| Maximum | consecutive wins (profit in money) | 7 (20990.40) | consecutive losses (loss in money) | 1 (-3054.00) | |
| Maximal | consecutive profit (count of wins) | 20990.40 (7) | consecutive loss (count of losses) | -3054.00 (1) | |
| Average | consecutive wins | 4 | consecutive losses | 1 | |

MetaQuotes Ltdによってロシア語から翻訳されました。
元のコード: https://www.mql5.com/ru/code/8783
 Indicator %BB
%BB is indicator comes from Bollinger Bands.
Trend Indicator
This indicator is used to show the trend of the 30 min charts. You can then apply your Long Strategy when the market is UP and Short Strategy when the market is DOWN.
Fractals_Price
The indicator of price levels fractals.
Squeeze Break Indicator
This indicator uses a combination of Bollinger Bands and Keltner Channels to capture moves from low to high volatility.