Join our fan page

ytg_2MA_4Level. - expert for MetaTrader 4

- Views:
- 17933
- Rating:
- Published:
- Updated:
-
 You are missing trading opportunities:
- Free trading apps
- Over 8,000 signals for copying
- Economic news for exploring financial markets
Registration Log inYou agree to website policy and terms of use
If you do not have an account, please register -
 Need a robot or indicator based on this code? Order it on Freelance
Go to Freelance
Need a robot or indicator based on this code? Order it on Freelance
Go to Freelance
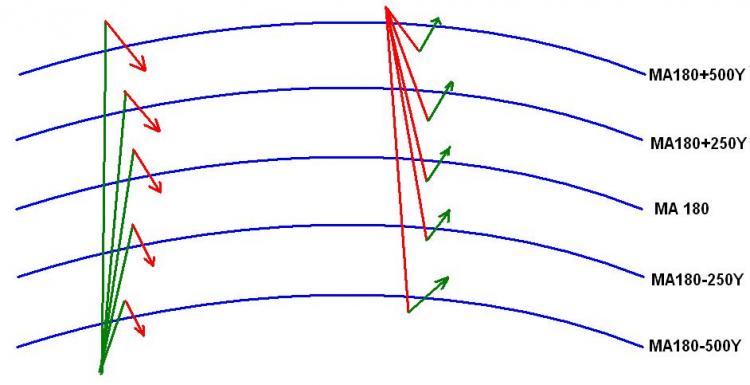
Principle of job:
2 SMA - first with parameters 14, second with 180.
Also there are parallel lines:
SMA 180 + 250 items on Y
SMA 180 + 500 items on Y
SMA 180 - 250 items on Y
SMA 180 - 500 items on Y
At crossing MA14 any line, occurs either Buy, or Sell.
| Symbol | EURUSD (Euro vs US Dollar) | ||||
| Period | 1 Hour (H1) 2009.02.19 00:00 - 2009.03.18 23:00 (2009.02.19 - 2009.03.19) | ||||
| Model | Every tick (the most accurate mode based on the shortest available time frames) | ||||
| Parameters | _____1_____="Trading settings "; take_profit=1000; stop_loss=1000; lots=3; _____2_____="Indicator settings "; calculated_bar=4; fast_МА_period=20; fast_МА_method=2; price_const_of fast_МА=4; slow_МА_period=180; slow_МА_method=2; price_const_of slow_МА=4; _____3_____="Level settings "; upper_1=950; upper_2=300; lower_1=750; lower_2=450; | ||||
| Bars in test | 1476 | Ticks modeled | 867857 | Modeling quality | 90.00% |
| Mismatched chart errors | 5 | ||||
| Initial deposit | 10000.00 | ||||
| Total net profit | 17882.10 | Gross profit | 23990.10 | Gross loss | -6108.00 |
| Profit factor | 3.93 | Expected payoff | 1788.21 | ||
| Absolute drawdown | 4755.30 | Maximum drawdown | 5607.30 (51.67%) | Relative drawdown | 51.67% (5607.30) |
| Total trades | 10 | Short positions (won %) | 2 (100.00%) | Long positions (won %) | 8 (75.00%) |
| Profit trades (% of total) | 8 (80.00%) | Loss trades (% of total) | 2 (20.00%) | ||
| Largest | profit trade | 3000.00 | loss trade | -3054.00 | |
| Average | profit trade | 2998.76 | loss trade | -3054.00 | |
| Maximum | consecutive wins (profit in money) | 7 (20990.40) | consecutive losses (loss in money) | 1 (-3054.00) | |
| Maximal | consecutive profit (count of wins) | 20990.40 (7) | consecutive loss (count of losses) | -3054.00 (1) | |
| Average | consecutive wins | 4 | consecutive losses | 1 | |

Translated from Russian by MetaQuotes Ltd.
Original code: https://www.mql5.com/ru/code/8783
 Indicator %BB
%BB is indicator comes from Bollinger Bands.
Trend Indicator
This indicator is used to show the trend of the 30 min charts. You can then apply your Long Strategy when the market is UP and Short Strategy when the market is DOWN.
Fractals_Price
The indicator of price levels fractals.
Squeeze Break Indicator
This indicator uses a combination of Bollinger Bands and Keltner Channels to capture moves from low to high volatility.