Chart Drawing Cloner

5

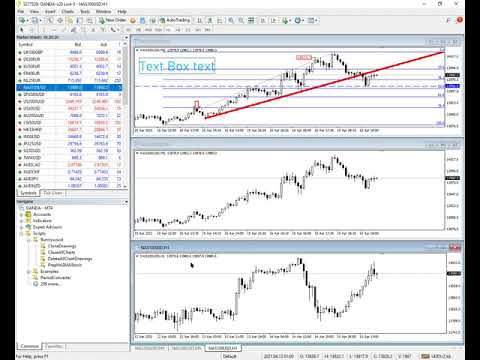
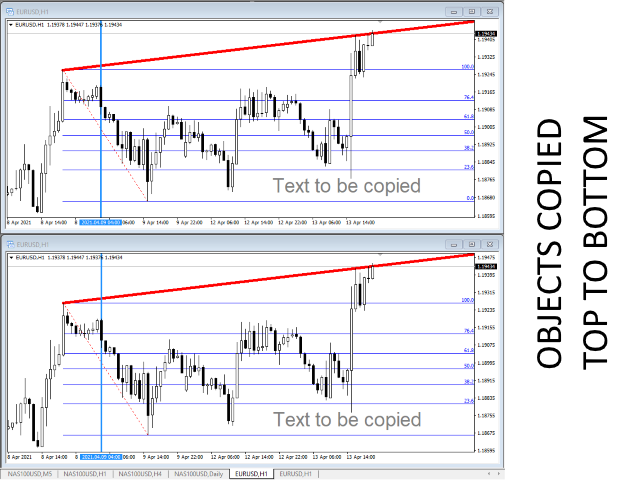
Questo script ti consente di copiare oggetti di disegno di qualsiasi tipo, come linee di tendenza, ritracciamenti di Fibonachi ecc., su uno o più altri grafici.


Per impostazione predefinita, lo script copierà tutti gli oggetti del grafico corrente, ovvero il grafico a cui è stato applicato lo script, in qualsiasi altro grafico dello stesso simbolo attualmente caricato.


Impostazioni

DestinazioneTimeframe

Se impostato su un valore diverso da PERIOD_CURRENT, copierà gli oggetti in qualsiasi grafico aperto dello stesso simbolo del grafico a cui è stato applicato lo script.

Se imposti il valore su un intervallo di tempo specifico, ad esempio PERIOD_D1, verranno aggiornati solo i grafici dello stesso simbolo AND periodo.

CopiaOggettiDiTipo

Puoi impostarlo su un tipo specifico di oggetto che desideri copiare, quindi solo gli oggetti di quel tipo verranno copiati su altri grafici.

CopyIndicatorWindowObjects

Se impostato su True, verranno copiati anche gli oggetti nelle finestre degli indicatori. Questo si basa sul secondo grafico con gli stessi indicatori del grafico di origine e nello stesso ordine.


Duplica gli oggetti tra i grafici a tuo piacimento!


Recensioni 7
crivelazquez
15
crivelazquez 2024.08.20 04:41 
 

excelente tank very muchexcelente tank very much

Kedrov
1159
Kedrov 2024.08.03 10:52 
 

Hi! It works great! Thank you! Good luck!

Prodotti consigliati
Koala Supply Demand
Ashkan Hazegh Nikrou
5 (3)
Presentazione dell'indicatore Koala Supply Demand per MetaTrader 4 (ti invitiamo a condividere la tua recensione o il tuo feedback, positivo o negativo, in modo che altri trader possano trarre vantaggio dalla tua esperienza.) : Benvenuti nell'indicatore Koala Supply Demand. Questo indicatore è progettato per identificare le zone di offerta e domanda ininterrotte. Questo indicatore può aiutare il trader a visualizzare il mercato come zone; è possibile vedere come il prezzo rispetti alcune potent
FREE
Auto Fibo Pro m
DMITRII GRIDASOV
Indicatore "Auto FIBO Pro" Crypto_Forex: è un ottimo strumento ausiliario nel trading! - L'indicatore calcola e posiziona automaticamente sul grafico i livelli di Fibo e le linee di tendenza locali (colore rosso). - I livelli di Fibonacci indicano le aree chiave in cui il prezzo può invertirsi. - I livelli più importanti sono 23,6%, 38,2%, 50% e 61,8%. - Puoi usarlo per lo scalping di inversione o per il trading di zone grid. - Ci sono molte opportunità per migliorare il tuo sistema attuale us
VR Cub
Vladimir Pastushak
VR Cub è un indicatore per ottenere punti di ingresso di alta qualità. L'indicatore è stato sviluppato per facilitare i calcoli matematici e semplificare la ricerca dei punti di ingresso in una posizione. La strategia di trading per la quale è stato scritto l'indicatore ha dimostrato la sua efficacia per molti anni. La semplicità della strategia di trading è il suo grande vantaggio, che consente anche ai trader alle prime armi di commerciare con successo con essa. VR Cub calcola i punti di apert
Una delle sequenze numeriche è chiamata "Sequenza di incendi boschivi". È stata riconosciuta come una delle nuove sequenze più belle. La sua caratteristica principale è che questa sequenza evita andamenti lineari, anche quelli più brevi. È questa proprietà che ha costituito la base di questo indicatore. Quando si analizza una serie temporale finanziaria, questo indicatore cerca di rifiutare tutte le possibili opzioni di tendenza. E solo se fallisce, riconosce la presenza di una tendenza e dà il
Trendiness Index
Libertas LLC
5 (3)
"The trend is your friend" is one of the best known sayings in investing, because capturing large trendy price movements can be extremely profitable. However, trading with the trend is often easier said than done, because many indicators are based on price reversals not trends. These aren't very effective at identifying trendy periods, or predicting whether trends will continue. We developed the Trendiness Index to help address this problem by indicating the strength and direction of price trend
Hello friends. I wrote this utility specifically for use in my profile with a large number of Expert Advisors and sets ("Joint_profiles_from_grid_sets" https://www.mql5.com/en/blogs/post/747929 ). Now, in order to limit losses on the account, there is no need to change the "Close_positions_at_percentage_of_loss" parameter on each chart. Just open one additional chart, attach this utility and set the desired percentage for closing all trades on the account. The utility has the following function
Trend Ray
Andriy Sydoruk
The indicator shows the potential trend direction by cyclical-wave dependence. Thus, all the rays of the intersection will be optimal rays, in the direction of which the price is expected to move, taking into account the indicator period. Rays can be used as a direction for potential market movement. But we must not forget that the approach must be comprehensive, the indicator signals require additional information to enter the market.
Bigger chart labels would allow the user to be entirely aware of which chart he/she is on. Each chart window is unique, containing different patterns and economic motives so acknowledging the chart window would be absolutely essential! There are well known Economic Time Zones included in clear view, by choice!    Simple does it! Use your computing mouse scroller, clicking with the right finger on the label, in order to customize the label properties. From there, choose your preferred color, fon
FREE
Indi RBO
Syarief Azman Bin Rosli
Input: Range Start Time : The starting time of the range creation Range End Time : The ending time of range creation Trade End Time : The time where the line of range zone high/low will be extended to Minimum Size : The minimum size of the range in point Maximum Size : The maximum size of the range in point If the range size is between the minimum and maximum, indicator will print the 1st color (blue).
Awesome Oscillator by Bill Williams with the ability to fine-tune and replace the averaging algorithms of the indicator, which significantly expands the possibilities of using this oscillator in algorithmic trading and brings it closer in its properties to such an indicator as the MACD. To reduce price noise, the final indicator is processed with an additional Smooth averaging. The indicator has the ability to give alerts, send mail messages and push signals when the direction of movement of th
Big Trend Signal   indicator is designed for trend and signal trading. This indicator generates trend signals.  It uses many algorithms and indicators to generate this signal. It tries to generate a signal from the points with the highest trend potential. This indicator is a complete trading product. This indicator does not need any additional indicators.  You can only trade with this indicator. The generated signals are displayed on the graphical screen.  Thanks to the alert features you can ge
Gvs Undefeated Trend   indicator is designed for trend and signal trading. This indicator generates trend signals.  It uses many algorithms and indicators to generate this signal. It tries to generate a signal from the points with the highest trend potential. This indicator is a complete trading product. This indicator does not need any additional indicators.  You can only trade with this indicator. The generated signals are displayed on the graphical screen.  Thanks to the alert features you ca
Daily Candle Predictor è un indicatore che prevede il prezzo di chiusura di una candela. L'indicatore è destinato principalmente all'uso sui grafici D1. Questo indicatore è adatto sia per il trading forex tradizionale che per il trading di opzioni binarie. L'indicatore può essere utilizzato come sistema di trading autonomo o può fungere da aggiunta al sistema di trading esistente. Questo indicatore analizza la candela corrente, calcolando alcuni fattori di forza all'interno del corpo della cande
Sentinel Arrow
Dmytro Kasianov
1 (1)
Sentinel Arrow Caratteristiche principali: ⊗Un algoritmo esclusivo per identificare rapidamente e accuratamente trend, inversioni e variazioni di momentum. ⊗Progettato per uso professionale, è dotato di una solida logica di segnale che elimina ritardi o falsi aggiornamenti. ⊗Adatto a diversi intervalli temporali. ⊗Non ridisegna, elimina o modifica i segnali passati. ⊗Tutti i segnali di ACQUISTO e VENDITA vengono generati sulla candela stessa e rimangono fissi. ⊗Nel trading reale, non c'è alcun
FREE
This    Perfective Signal System   indicator is designed for signal trading. This indicator generates trend signals. It uses many algorithms and indicators to generate this signal. It tries to generate a signal from the points with the highest trend potential. This indicator is a complete trading product. This indicator does not need any additional indicators. The indicator certainly does not repaint. The point at which the signal is given does not change.     Features and Suggestions Time
The Arrow Scalper
Fawwaz Abdulmantaser Salim Albaker
1 (2)
Dear Friend..  I share with you this simple Expert Adviser .. it is full automatic  this Expert Adviser following the trend of the pair you install on or any stocks or indices , it is works like that: - when the trend on H4 chart show a start of up trend the expert will wait till the 15M & 1H charts show an up trend the EA will open a buy order directly , and do the same for down trend and open a sell order the buy or sell  order lot size and take profit and stop loss will measured manually  by
FREE
Order Blocks Breaker
Suvashish Halder
5 (2)
Introducing Order Blocks Breaker , a brand-new way to identify and leverage order blocks in your trading strategy. After developing multiple order block tools with unique concepts, I’m proud to present this tool that takes things to the next level. Unlike previous tools, Order Blocks Breaker not only identifies order blocks but also highlights Breaker Order Blocks —key areas where the price is likely to retest after a breakout. MT5 -  https://www.mql5.com/en/market/product/124102/ This tool inco
Alpha Trend sign has been a very popular trading tool in our company for a long time. It can verify our trading system and clearly indicate trading signals, and the signals will not drift. Main functions: Based on the market display of active areas, indicators can be used to intuitively determine whether the current market trend belongs to a trend market or a volatile market. And enter the market according to the indicator arrows, with green arrows indicating buy and red arrows indicating se
L'indicatore SMC Venom Model BPR è uno strumento professionale per i trader che operano nell'ambito del concetto di Smart Money (SMC). Identifica automaticamente due modelli chiave sul grafico dei prezzi: FVG   (Fair Value Gap) è una combinazione di tre candele, in cui c'è un gap tra la prima e la terza candela. Forma una zona tra livelli in cui non c'è supporto di volume, il che spesso porta a una correzione dei prezzi. BPR   (Balanced Price Range) è una combinazione di due modelli FVG che for
Linear Trend Predictor : indicatore di tendenza che combina punti di ingresso e linee di supporto direzionale. Funziona secondo il principio di rottura del canale dei prezzi alto/basso. L'algoritmo dell'indicatore filtra il rumore di mercato, tiene conto della volatilità e delle dinamiche di mercato. Capacità dell'indicatore Utilizzando metodi di smoothing, mostra l'andamento del mercato e i punti di ingresso per l'apertura di ordini di ACQUISTO o VENDITA. Adatto per determinare i movimenti d
TR Basket AI Pro
Meshari F M Alkhawaled
TR BASKET AI – Capital Protection Grid System (Professional Edition) A professional basket trading system designed for capital-based accounts. Focused on risk control, profit protection, and institutional-style trade management . TR BASKET AI is a professional-grade basket trading system built for traders and investors who prioritize capital protection, controlled drawdown, and structured risk management over aggressive speculation. This system is not designed for small or high-risk account
This is the complete REX package. It consists of the lite, pro and ULTRA version.  Perfect for beginners and intermediates. REX complete is 100% non repaint. The strategy is based on a mix of different strategies, statistics, including pivot points, oscillators and patterns.  As the trading idea consists of a variety of some classic indicators like Momentum, Williams Percent Range, CCI, Force Index, WPR, DeMarker, CCI, RSI and Stochastic, it is clear that the fundamental indicators have being u
Introduction It is common practice for professional trades to hide their stop loss / take profit from their brokers. Either from keeping their strategy to the themselves or from the fear that their broker works against them. Using this indicator, the stop loss / take profit points will be drawn on the product chart using the bid price. So, you can see exactly when the price is hit and close it manually.  Usage Once attached to the chart, the indicator scans the open orders to attach lines for t
Grid MT4 Recovery
Volodymyr Hrybachov
A grid advisor with an adaptive system for "Resolving" a basket of orders   can also be used   to restore unprofitable positions on the account. Works inside a linear regression channel, input on several conditions. The signal uses the direction of the   linear regression   channel, exponential moving averages, average daily volatility, then   builds an order grid if the price deviates. The grid step is configurable, and if the price goes against us, then after a certain number of orders, the ac
The Range Directional Force Indicator is designed to help traders analyze market trends, reversals, and directional strength. It focuses on price movements within defined ranges, identifying key moments when the market is gaining momentum or preparing for a shift. By dividing the chart into dynamic price ranges, the indicator detects critical support and resistance levels. It calculates the directional force of price movements, highlighting potential entry and exit points based on market sentim
Harvest GOLD
Sayan Vandenhout
Harvest GOLD USES THE TREND WAVE INDICATOR AND IT CAN IDENTIFY THE BEGINNING AND THE END OF A NEW WAVE TREND MOVEMENT. AS AN OSCILLATOR, THE INDICATOR IDENTIFIES THE OVERBOUGHT AND OVERSOLD ZONES. IT WORKS GREAT TO CATCH THE SHORT TERM PRICE REVERSALS AND USES A MARTINGALE STRATEGY TO CLOSE ALL TRADES IN PROFIT. USE DEFAULT SETTINGS ON H1 OR HIGHER TIME FRAME ON ANY PAIR FOR MORE ACCURATE TRADES WHY THIS EA : Smart entries calculated by 3 great strategies The EA can be run on even a $30000
LineBreakMT4
Nattadecha Tangpakinwat
Key Features: Type of Indicator: Line Break Chart Indicator Usage: Identifying trend reversals and potential market turning points. Input Parameters: The primary input parameter is 'Lines_Break,' which represents the number of lines the price needs to move to create a new line in the opposite direction. How it works: The indicator draws green and red histogram bars to represent the line break chart. Green bars indicate an upward trend, and red bars indicate a downward trend. The indicator calcul
FREE
The main idea of this indicator is rates analysis and prediction by Fourier transform. Indicator decomposes exchange rates into main harmonics and calculates their product in future. You may use the indicator as a standalone product, but for better prediction accuracy there is another related indicator - FreqoMaster - which uses FreqoMeterForecast as a backend engine and combines several instances of FreqoMeterForecast for different frequency bands. Parameters: iPeriod - number of bars in the ma
Strong Oscillator is an indicator designed to find indicator trends. It finds trends using a set of algorithms and a set of indicators. This indicator is a trend indicator. Helps to find trends easily. You can use this indicator alone, or you can use it as an auxiliary indicator for other strategically appropriate indicators. You can use it as a trend validation indicator. Suggestions and Features There are 4 level lines on the indicator. These level lines 5, 20 and 80 are 95 lines. 5, 20 leve
EARLY REMINDER: The Starting price is 65 price will rise soon up to 365$ and then 750$ after first 10 copies of sales. Grab this offer now! Introduction Hello, traders! Welcome to the demonstration of the Forex Beast Indicator , a comprehensive tool designed to assist aspiring traders in navigating the complexities of the forex market. This indicator incorporates seven essential components to provide a well-rounded trading experience: Moving Averages Colored Zones Support and Resistance Levels
Gli utenti di questo prodotto hanno anche acquistato
Local Trade Copier EA MT4
Juvenille Emperor Limited
4.96 (108)
Sperimenta una copia di trading eccezionalmente veloce con il Local Trade Copier EA MT4 . Con la sua facile configurazione in 1 minuto, questo copiatore di trading ti consente di copiare i trades tra diversi terminali di MetaTrader sullo stesso computer Windows o su Windows VPS con velocità di copia ultra veloci inferiori a 0.5 secondi. Che tu sia un trader principiante o professionista, Local Trade Copier EA MT4 offre una vasta gamma di opzioni per personalizzarlo alle tue esigenze specifiche.
Trade Assistant MT4
Evgeniy Kravchenko
4.42 (193)
It helps to calculate the risk per trade, the easy installation of a new order, order management with partial closing functions, trailing stop of 7 types and other useful functions. Additional materials and instructions Installation instructions   -   Application instructions   -   Trial version of the application for a demo account Line function -   shows on the chart the Opening line, Stop Loss, Take Profit. With this function it is easy to set a new order and see its additional characteris
Exp COPYLOT CLIENT for MT4
Vladislav Andruschenko
4.69 (65)
Copiatore commerciale per MetaTrader 4.       Copia le operazioni, le posizioni e gli ordini forex da qualsiasi conto. È uno dei migliori copiatori commerciali       MT4 - MT4, MT5 - MT4       per il       COPYLOT MT4       versione (o       MT4 - MT5 MT5 - MT5       per il       COPYLOT MT5       versione). Versione MT5 Descrizione completa   +DEMO +PDF Come comprare Come installare     Come ottenere i file di registro     Come testare e ottimizzare     Tutti i prodotti di Expforex Versione
Forex Trade Manager MT4
InvestSoft
4.98 (430)
Benvenuto a Trade Manager EA, lo strumento definitivo per la gestione del rischio , progettato per rendere il trading più intuitivo, preciso ed efficiente. Non è solo uno strumento per l'esecuzione degli ordini, ma una soluzione completa per la pianificazione delle operazioni, la gestione delle posizioni e il controllo del rischio. Che tu sia un principiante, un trader avanzato o uno scalper che necessita di esecuzioni rapide, Trade Manager EA si adatta alle tue esigenze, offrendo flessibilità s
Copy Cat More Trade Copier MT4 (Copia Gatto MT4) non è solo un semplice copiatore locale di operazioni; è un quadro completo di gestione del rischio ed esecuzione, progettato per le sfide del trading moderno. Dai challenge delle prop firm alla gestione dei conti personali, si adatta a ogni situazione grazie a una combinazione di esecuzione robusta, protezione del capitale, configurazione flessibile e gestione avanzata delle operazioni. Il copiatore funziona sia in modalità Master (mittente) che
Il MT4 to Telegram Signal Provider è uno strumento facile da usare e completamente personalizzabile che consente l'invio di segnali a Telegram, trasformando il tuo account in un fornitore di segnali. Il formato dei messaggi è completamente personalizzabile! Tuttavia, per un uso semplice, puoi anche optare per un modello predefinito e abilitare o disabilitare parti specifiche del messaggio. [ Dimostrativo ]  [ Manuale ] [ Versione MT5 ] [ Versione Discord ] [ Canale Telegram ]  New: [ Telegram To
Equity Protect Pro: Il tuo esperto di protezione del conto completo per un trading senza preoccupazioni Se stai cercando funzionalità come protezione del conto, protezione del capitale proprio, protezione del portafoglio, protezione multi-strategia, protezione dei profitti, raccolta dei profitti, sicurezza del trading, programmi di controllo del rischio, controllo automatico del rischio, liquidazione automatica, liquidazione condizionale, liquidazione programmata, liquidazione dinamica, trailin
Trade Dashboard MT4
Fatemeh Ameri
4.96 (53)
Tired of complex order placement and manual calculations? Trade Dashboard is your solution. With its user-friendly interface, placing orders becomes effortless, by a single click, you can open trades, set stop loss and take profit levels, manage trade lot size, and calculate risk to reward ratios, allowing you to only focus on your strategy. Say goodbye to manual calculations and streamline your trading experience with Trade Dashboard. Download  Demo Version  right now. You can find  Details of
The product will copy all telegram signal to MT4   ( which you are member  ) , also it can work as remote copier.  Easy to set up, copy order instant, can work with almost signal formats, image signal, s upport to translate other language to English Work with all type of channel or group, even channel have "Restrict Saving Content", work with  multi channel, multi MT5 Work as remote copier: with signal have ticket number, it will copy exactly via ticket number. Support to backtest signal. How to
Smart Channel M4
Vahidreza Heidar Gholami
The trend in the market can be predicted using trend lines but the problem is you don’t know where exactly the price is going to touch the trend line where you can put your pending orders on. Smart Channel Expert Advisor makes it possible to put an advanced channel around the price data, which can be configured to handle placing orders, opening and closing positions, managing risk per trade, spread, slippage, and trailing stop-loss and take-profit automatically. Features Money Management (Calcul
VirtualTradePad mt4 Extra
Vladislav Andruschenko
4.86 (59)
Pannello di trading per il trading in 1 clic.   Lavorare con posizioni e ordini!   Trading dal grafico o dalla tastiera. Utilizzando il nostro pannello di trading, puoi fare trading con un clic dal grafico ed eseguire operazioni di trading 30 volte più velocemente rispetto al controllo MetaTrader standard. Calcoli automatici di parametri e funzioni che semplificano la vita di un trader e lo aiutano a condurre le proprie attività di trading in modo molto più rapido e conveniente. Suggerimenti gra
Take a Break
Eric Emmrich
5 (31)
One tool to protect all your EAs — news filter, equity protection, time filter and more — free demo available Take a Break has evolved from a basic news filter into a comprehensive account protection solution. It pauses your other Expert Advisors during news events or based on custom filters. When trading resumes, it automatically restores your entire chart setup , including all EA settings. Typical use cases: One news filter for all your EAs. Pause trading during news or high volatility — and c
Exp Averager
Vladislav Andruschenko
4.82 (22)
Exp-Averager   è progettato per calcolare la media delle operazioni che hanno ricevuto un certo prelievo aprendo operazioni di media. Il consulente ha la capacità di aprire nuove posizioni in tendenza o contro la tendenza attuale. Include anche una funzione intelligente di trailing stop che si applica a una serie di posizioni. Il consulente può aumentare o diminuire la dimensione del lotto delle posizioni. Questa è una strategia ampiamente utilizzata per riportare le posizioni in perdita al pre
Comprehensive on chart trade panel with the unique ability to be controllable from mobile as well. Plus has a library of downloadable configuration, e.g. exit rules, extra panel buttons, pending order setup and more. Please see our product video. Works with all symbols not just currency pairs. Features On chart panel plus controllable from free app for Windows, iPhone and Android Built-in script engine with library of downloadable configuration, e.g. add 'Close All Trades in Profit' button, exit
KT Equity Protector MT4
KEENBASE SOFTWARE SOLUTIONS
3.4 (5)
Proteggi facilmente il tuo capitale di trading Proteggere il tuo capitale è importante tanto quanto farlo crescere. KT Equity Protector è il tuo gestore del rischio personale: monitora costantemente l’equity del conto e interviene automaticamente per prevenire perdite o bloccare i profitti chiudendo tutti gli ordini attivi e pendenti quando vengono raggiunti i livelli di profitto o perdita predefiniti. Niente più decisioni emotive o congetture: solo protezione affidabile dell’equity che lavora p
Trading History MT4
Siarhei Vashchylka
5 (9)
Trading History - A program for trading and money management on the history of quotes in stratagy tester. It can work with pending and immediate orders, and is equipped with trailing stop, breakeven and take profit functions. Very good for training and testing different strategies. Manual (Be sure to read before purchasing) Advantages 1. Allows you to test any trading strategy in the shortest possible time 2. An excellent simulator for trading training. You can gain months of trading experience
Exp4 Duplicator
Vladislav Andruschenko
4.5 (22)
L'Expert Advisor   ripete   operazioni e posizioni un numero prestabilito di volte sul tuo conto   MetaTrader 4   . Copia tutte le operazioni aperte manualmente o da un altro Expert Advisor. Copia i segnali e aumenta il lotto dai segnali   ! Aumenta il numero di altri EA. Sono supportate le seguenti funzioni: lotto personalizzato per operazioni copiate, copia di Stop Loss, Take Profit, utilizzo di trailing stop. Versione MT5 Descrizione completa +DEMO +PDF Come comprare Come installare     C
Eezeorder 2
Tawanda Tinarwo
5 (2)
NEW VERSION!  NB: IF YOU ARE USING A VERY HIGH RESOLUTION MACHINE AND THE EA DISPLAY LOOKS TOO SMALL, CONTACT ME SO I CAN HELP YOU. Open Multiple Trades on MT4 in 1 click at one price. Enter the Lot size Specify the number of trades you want to open Choose whether you want TP SL or Trailing Stop Once you are done, click Buy or Sell Open Multiple Pending Orders on MT4 in 1 click at one price. Enter the Lot size Specify the gap from the current price, where you want to place the pending order Spe
Descrizione TradeSync Pro è un'utility tecnica progettata per la sincronizzazione locale delle operazioni di trading tra terminali MetaTrader in esecuzione sullo stesso computer. È ottimizzata per la gestione dei conti, il confronto dell'esecuzione tra diversi broker e la replica strategica delle operazioni. Licenze e compatibilità multipiattaforma Il software supporta vari scenari di sincronizzazione in base alle piattaforme utilizzate. Si prega di notare i seguenti requisiti:   Piattaforma sin
--------------Welcome to use [MQL5 Signal Analyze Master]------------------  Function: Draw order tracks of MQL5 MT4 and MT5 signal on MT4 chart. [Using guide] 1.Use it as Experts. 2.Download history record from MQL5 signal(MT4 signal or MT5 signal).  3.Paste history record file below "MQL4/Files/" 4.Load [Signal Analyze Master] on the symbol chart what you want to analyze. 5.Paste the history record file name to parameter 'FileName' 6.Select  SignalType  match the history you download on MT4
News Filter EA that send you a Push notification to your MT4 phone APP and TURN OFF MT4 Automatically Before News.  This EA doesn't work in backtest From 1.7 version  the EA have  Close all trades before news functions added. You only need to allow that url in MT4 options: To see the url and how to add it to MT4, visit this post: https://www.mql5.com/en/blogs/post/754402 When Metatrader is turned off, it saves the status of all the charts, indicators and Expert Advisors that you have in them
RSI Divergence Scanner is a multi-timeframe and multi-symbol dashboard and alert that checks all timeframes and symbols to find divergences between price chart and RSI indicator. This divergence scanner is integrated with support and resistance zones so you can check the RSI divergences in the most important areas of the chart to find trend reversals in the price chart. Download demo version   (works on M 1,M5,M30,W1 timeframes) Full description of scanner parameters ->   click here . How to get
Simple and Easy MT4 Trade Panel by Winidecorw I created this EA to make your life easier by making it easier and faster to open your trades. The price will increase progressively, take advantage now! Simplify Your Trading with the Simple and Easy MT4 Trade Panel Are you tired of wasting time setting up each trade in MetaTrader 4? With the simple and easy MT4 trading dashboard, taking your trading to the next level has never been so quick and easy! This Trade Assistant dashboard is the Simple an
Il MT4 to Discord Signal Provider è uno strumento facile da usare e completamente personalizzabile, progettato per inviare segnali di trading direttamente a Discord. Questo strumento trasforma il tuo account di trading in un efficiente fornitore di segnali. Personalizza i formati dei messaggi secondo il tuo stile! Per facilitarne l'uso, seleziona tra i modelli pre-progettati e scegli quali elementi del messaggio includere o escludere. [ Demo ] [ Manuale ] [ Versione MT5 ] [ Versione Telegram ] 
EasyInsight AIO MT4
Alain Verleyen
4 (2)
EASY Insight AIO – La soluzione all-in-one per un trading intelligente e senza sforzo Panoramica Immagina di poter analizzare l’intero mercato — Forex, Oro, Cripto, Indici e persino Azioni — in pochi secondi, senza dover controllare manualmente i grafici, installare indicatori o affrontare configurazioni complicate. EASY Insight AIO è il tuo strumento definitivo di esportazione per il trading alimentato dall’IA, pronto all’uso. Offre una panoramica completa del mercato in un unico file CSV pul
Telegram to MT4 Coppy
Sergey Batudayev
3.75 (8)
Da Telegram a MT4: la soluzione definitiva per la copia del segnale Semplifica il tuo trading con   Telegram su MT4   , l'utility all'avanguardia progettata per copiare i segnali di trading direttamente dai canali e dalle chat di Telegram sulla tua piattaforma MetaTrader 4, senza bisogno di DLL. Questa soluzione affidabile garantisce un'esecuzione impeccabile dei segnali con una precisione e opzioni di personalizzazione senza pari, risparmiando tempo e aumentando la tua efficienza. [ Instruction
ManHedger MT4
Peter Mueller
5 (1)
THIS EA IS A SEMI-AUTO EA, IT NEEDS USER INPUT. Manual & Test Version Please TEST this product before   BUYING  and watch my video about it. Contact me for user support or bug reports, or if you want the MT5 version! MT5 Version I do not guarantee any profits or financial success using this EA. With this Expert Advisor, you can: Implement your own   Zone Recovery   strategy to capitalize on trending markets. Create   Grid   trading strategies, to profit from ranging markets. Place orders easil
KopirMT4 Copy trades for MT4
Alexandr Gavrilin
4.54 (82)
The adviser has been withdrawn from sale  KopirMT4 (CopierMT4) - transaction copier for the MetaTrader 4 terminal, copies (synchronizes, duplicates) transactions from any accounts (copier, copy dealers).  Supports copying: MT4 <-> MT4, MT4 -> MT5 Hedge, MT5 Hedge -> MT4 Support:  https://www.mql5.com/ru/messages/01c3f341a058d901 Why exactly our product? The copier has a high speed and is not dependent on ticks. Copy speed - less than 0.5 sec. Transactions are copied with high accuracy, the sc
Riskless Pyramid
Snapdragon Systems Ltd
5 (1)
Introduction This powerful MT4 trade mangement EA offers a way potentially to aggressively multiply trade profits in a riskfree manner. Once a trade has been entered with a defined stoploss and take profit target then the EA will add three pyramid add-on trades in order to increase the overall level of profit. The user sets the total combined profit target to be gained if everything works out. This can be specified either as a multiple of the original trade profit or as a total dollar amount. Fo
Seconds Chart — uno strumento unico per creare grafici in secondi su MetaTrader 4 . Con Seconds Chart , puoi generare grafici con timeframe definiti in secondi, ottenendo una flessibilità e una precisione d'analisi ideali, non disponibili nei grafici standard in minuti o ore. Ad esempio, il timeframe S15 indica un grafico con candele di 15 secondi. Puoi utilizzare qualsiasi indicatore, expert advisor e script. È facile utilizzarli proprio come nei grafici standard. A differenza degli strumenti s
Altri dall’autore
Multi Chart Crosshairs MT5
Robert Gerald Wood
5 (4)
Questo indicatore è progettato per rendere le revisioni di molti grafici su scale temporali diverse più rapide e più facili da eseguire. Tieni traccia di tempo e prezzo su più grafici Cambia simbolo su un grafico e anche tutti gli altri grafici dello stesso simbolo verranno modificati. Facile da usare, veloce da padroneggiare L'indicatore consente di identificare il prezzo e l'ora in cui si trova il puntatore del mouse sul grafico corrente, su tutti gli altri grafici aperti sullo stesso simbolo.
Ho creato questo semplice indicatore mentre stavo imparando a conoscere TheStrat di Rob Smith e l'ho trovato così utile, ho pensato di condividerlo con te. Se lo trovi utile, guarda gli altri indicatori che ho pubblicato su MQL5. L'indicatore disegna semplicemente una singola linea sul grafico che mostra il livello di prezzo selezionato da un periodo di tempo più elevato. Usando le impostazioni hai il pieno controllo sull'intervallo di tempo visualizzato ma, per   impostazione predefinita, calco
FREE
A simple script that can delete all the drawing objects on a chart, or just the objects of a specific type. Settings: DeleteObjectsOfType By default the value will be blank which means ALL drawing objects on the chart will be deleted. If you only wish to delete specific types of drawing object, change this setting to the type of object to delete. For example, Fibonacci Retracement, Text, Label or Trend Line. Please see the demonstration video for more information.
FREE
This script allows you to toggle the "Show Trade Levels" option, but for the current chart only. Normally, you can only change the setting using the Options -> Chart menu for ALL charts, but this script allows you to do it for a SINGLE chart. I'm using it when I take screenshots, because most of the time I'm not trying to show the trades, just some functionality of one of my other tools. Iif you need that functionality, then this script is very helpful! If the script helps you, please let me k
FREE
TheStrat Patterns
Robert Gerald Wood
This indicator will draw patterns based on Rob Smith's The Strat as they emerge in real time on your chart. As price evolves, TheStrat offers 18 distinct price action patterns that can help you get good entries in the market. Each pattern involves two or three candles, and this indicator will draw a bounding box around the candles and name the pattern. The indicator also shows when a potential setup is forming, known by stratters as an Actionable signal. Candles Each candle is defined by its
Multi Chart Crosshairs
Robert Gerald Wood
5 (1)
This indicator is designed to make reviews of many charts on different timescales quicker, and easier to do. Track Time and Price across multiple charts Change Symbol on one chart and all other charts of the same symbol will be changed too. Easy to use, quick to master The indicator allows you to identify the price and time where the mouse pointer is on the current chart, across all other charts open on the same Symbol. This allows you to quickly see information on multiple charts whereas normal
TheStrat Levels
Robert Gerald Wood
This indicator draws the prior Highs and Lows for multiple timeframes, and can display potential Take Profit and Stop Loss levels. In Rob Smith's # The Strat   terms,   these are potential entry points, or alternatively potential targets for open positions. I like to use them in both ways. On a lower timeframe, say 5 minutes to get a good entry on a daily or weekly level, and then as a potential target. Very small stops required giving an excellent risk/reward ratio. Please watch the DEMO video
TheStrat Candles
Robert Gerald Wood
5 (1)
Questo indicatore disegnerà un'etichetta sopra o sotto ogni candela in base a       di Rob Smith       La Stratocaster       man mano che si sviluppano nel tempo sul tuo grafico. Con l'evolversi del prezzo, una candela può passare da uno stato all'altro. Quando la candela si apre per la prima volta, se si trova completamente all'interno del massimo e del minimo delle candele precedenti, inizierà come Tipo 1. Con il passare del tempo, se rompe il massimo o il minimo della candela precedente, ve
TheStrat FTFC
Robert Gerald Wood
FTFC si riferisce alla Full Timeframe Continuity come definita da   The Strat   di Rob Smith. Questo indicatore disegna due linee sul grafico, una delle più alte tra i livelli di apertura trimestrale, mensile, settimanale, giornaliera o oraria e la seconda tra i più bassi di questi valori. Questo ti dà un canale sopra o sotto il quale è più probabile che il trading sia molto fortemente in una direzione. Tra le righe, l'azione dei prezzi sarà più instabile e potresti utilizzare stop più ampi. Vie
Round Price Levels
Robert Gerald Wood
I mercati amano davvero i numeri tondi e spesso fungono da supporto in un mercato in calo o da resistenza quando il prezzo sale. Questo indicatore è progettato per disegnare livelli di prezzo a valori Round. Lo fa automaticamente, ma hai anche la possibilità di ignorarlo e determinare i livelli che desideri vedere. Un livello rotondo può essere semplice come passaggi di 10, quindi 10, 20, 30 ecc. o se stai lavorando con il Forex, forse vuoi vedere i cambiamenti a 0.1 o 0.01. L'indicatore disegna
TheStrat Monitor
Robert Gerald Wood
3.67 (3)
If you've not already learnt about The Strat trading strategy , go google it now. I promise it won't be a waste of your time, and you will likely learn some new tricks whether you use it or not. OK, so now you know what TheStrat is, you will be able to understand what this indicator can do for you. Key Features In short, the Indicator will: Show Timeframe Continuity for all supported timeframes Supports two timeset views, Day trader and Swing trader Show when Full Timeframe Continuity is in pla
Quando fai trading usando   The Strat   , è importante tenere d'occhio più tempi. Questo indicatore mostrerà lo stato giornaliero, settimanale, mensile e trimestrale della candela corrente per ogni periodo di tempo. Un'icona a forma di cerchio mostra che la candela in quel lasso di tempo è attualmente una Inside o Type 1 nella terminologia di TheStrat. Una candela Inside Day sta consolidando l'azione dei prezzi e stiamo cercando un breakout dall'intervallo. Un'icona a triangolo, rivolta verso l'
Active Pivot Levels
Robert Gerald Wood
5 (1)
I livelli pivot sono un livello tecnico consolidato riconosciuto in ogni mercato. Questo indicatore disegnerà gli attuali pivot trimestrali, mensili, settimanali, giornalieri e quadriorari sul grafico, per qualsiasi simbolo. Puoi anche mostrare i livelli di Supporto e Resistenza per ogni periodo e scegliere quale visualizzare dal livello 1 al 4.     Scegli il tipo di Pivot tra: Standard Camarilla DeMark Woodie Fibonacci Si prega di notare che i pivot DeMark hanno un unico livello di supporto e r
ATR Extremes
Robert Gerald Wood
L'Average True Range (ATR) è un indicatore comunemente usato che misura la quantità di movimento del prezzo per una durata prestabilita. Tuttavia, il valore che dà non è definito all'interno di alcun tipo di confine, il che rende quasi impossibile utilizzarlo per qualcosa di diverso dai calcoli di stop loss o take profit. Questo indicatore è il tuo indicatore ATR standard, ma abbiamo introdotto le demarcazioni percentili in modo che tu possa vedere gli estremi. Puoi scegliere tra percentili e
Range Exhaustion
Robert Gerald Wood
L'esaurimento dell'intervallo si verifica quando il prezzo raggiunge o supera l'intervallo previsto per il periodo corrente. A questi livelli, il prezzo inizia a perdere slancio rispetto all'inizio del periodo, quindi è un buon punto per assicurarsi di non assumere nuove posizioni. Questo indicatore ti mostrerà dove è probabile che ciò accada sul tuo grafico, mostrando i livelli per periodi giornalieri, settimanali e mensili. Quando vedi che il prezzo supera questi livelli di esaurimento, ti sta
This indicator will draw a label above or below each candle based on   Rob Smith's   The Strat   as they develop over time on your chart. As price evolves, a candle can switch between three states. When the candle first opens, if it sits completely within the previous candles high and low, then it will start as a Type 1. As time moves on, if it breaks either the high or low of the previous candle, it will be come a type 2, and should the price action be volatile and directionless, it may then
TheStrat Levels MT5
Robert Gerald Wood
5 (1)
This indicator draws the prior Highs and Lows for multiple timeframes, and can display potential Take Profit and Stop Loss levels. In Rob Smith's # The Strat  terms, these are potential entry points, or alternatively potential targets for open positions. I like to use them in both ways. On a lower timeframe, say 5 minutes to get a good entry on a daily or weekly level, and then as a potential target. Very small stops required giving an excellent risk/reward ratio. Key Features  - Levels from Hou
TheStrat FTFC MT5
Robert Gerald Wood
FTFC si riferisce alla Full Timeframe Continuity come definita da   The Strat   di Rob Smith. Questo indicatore disegna due linee sul grafico, una delle più alte tra i livelli di apertura trimestrale, mensile, settimanale, giornaliera o oraria e la seconda tra i più bassi di questi valori. Questo ti dà un canale sopra o sotto il quale è più probabile che il trading sia molto fortemente in una direzione. Tra le righe, l'azione dei prezzi sarà più instabile e potresti utilizzare stop più ampi. Vie
This indicator will draw patterns based on   Rob Smith's   The Strat   as they emerge in real time on your chart. As price evolves,   TheStrat   offers 18 distinct price action patterns that can help you get good entries in the market. Each pattern involves two or three candles, and this indicator will draw a bounding box around the candles and name the pattern. The indicator also shows when a potential setup is forming, known by stratters as an Actionable signal. Candles Each candle is defin
TheStrat Monitor MT5
Robert Gerald Wood
5 (1)
Se non hai già imparato a conoscere   la strategia di trading di The Strat   , vai su Google ora. Ti prometto che non sarà una perdita di tempo e probabilmente imparerai alcuni nuovi trucchi, che tu lo usi o meno. OK, quindi ora sai cos'è TheStrat, sarai in grado di capire cosa può fare questo indicatore per te. Caratteristiche principali In breve, l'indicatore: Mostra la continuità del periodo di tempo per tutti i periodi di tempo supportati Supporta due viste timeset, Day trader e Swing trade
TheStrat TFC Monitor MT5
Robert Gerald Wood
5 (1)
Quando fai trading usando   The Strat   , è importante tenere d'occhio più tempi. Questo indicatore mostrerà lo stato giornaliero, settimanale, mensile e trimestrale della candela corrente per ogni periodo di tempo. Un'icona a forma di cerchio mostra che la candela in quel lasso di tempo è attualmente una Inside o Type 1 nella terminologia di TheStrat. Una candela Inside Day sta consolidando l'azione dei prezzi e stiamo cercando un breakout dall'intervallo. Un'icona a triangolo, rivolta verso l'
I livelli pivot sono un livello tecnico consolidato riconosciuto in ogni mercato. Questo indicatore disegnerà gli attuali pivot trimestrali, mensili, settimanali, giornalieri e quadriorari sul grafico, per qualsiasi simbolo. Puoi anche mostrare i livelli di Supporto e Resistenza per ogni periodo e scegliere quale visualizzare dal livello 1 al 4.     Scegli il tipo di Pivot tra: Standard Camarilla DeMark Woodie Fibonacci Si prega di notare che i pivot DeMark hanno un unico livello di supporto e r
I mercati amano davvero i numeri tondi e spesso fungono da supporto in un mercato in calo o da resistenza quando il prezzo sale. Questo indicatore è progettato per disegnare livelli di prezzo a valori Round. Lo fa automaticamente, ma hai anche la possibilità di ignorarlo e determinare i livelli che desideri vedere. Un livello rotondo può essere semplice come passaggi di 10, quindi 10, 20, 30 ecc. o se stai lavorando con il Forex, forse vuoi vedere i cambiamenti a 0.1 o 0.01. L'indicatore disegna
ATR Extremes MT5
Robert Gerald Wood
L'Average True Range (ATR) è un indicatore comunemente usato che misura la quantità di movimento del prezzo in una determinata durata. Tuttavia, il valore che fornisce non è definito all'interno di alcun tipo di confine, il che rende quasi impossibile utilizzarlo per qualcosa di diverso dai calcoli di stop loss o take profit. Questo indicatore è il tuo indicatore ATR standard, ma abbiamo introdotto demarcazioni percentili in modo da poter vedere gli estremi. Puoi scegliere tra percentili e qualc
L'esaurimento dell'intervallo si verifica quando il prezzo raggiunge o supera l'intervallo previsto per il periodo corrente. A questi livelli, il prezzo inizia a perdere slancio rispetto all'inizio del periodo, quindi è un buon punto per assicurarsi di non assumere nuove posizioni. Questo indicatore ti mostrerà dove è probabile che ciò accada sul tuo grafico, mostrando i livelli per periodi giornalieri, settimanali e mensili. Quando vedi che il prezzo supera questi livelli di esaurimento, ti sta
Filtro:
4xtrader2009
514
4xtrader2009 2025.07.27 14:31 
 

L'utente non ha lasciato alcun commento sulla valutazione.

crivelazquez
15
crivelazquez 2024.08.20 04:41 
 

excelente tank very muchexcelente tank very much

Kedrov
1159
Kedrov 2024.08.03 10:52 
 

Hi! It works great! Thank you! Good luck!

Christian Astillero
1208
Christian Astillero 2022.03.08 14:52 
 

L'utente non ha lasciato alcun commento sulla valutazione.

Robert Gerald Wood
4954
Risposta dello sviluppatore Robert Gerald Wood 2022.04.01 12:01
Thank You!
CasiousD
868
CasiousD 2021.10.30 19:39 
 

L'utente non ha lasciato alcun commento sulla valutazione.

Payman
723
Payman 2021.04.16 15:05 
 

L'utente non ha lasciato alcun commento sulla valutazione.

Robert Gerald Wood
4954
Risposta dello sviluppatore Robert Gerald Wood 2021.04.16 15:08
Hello again Payman, you're now my biggest fan :)
Being able to exclude object of a type is a good idea, definitely adding that to the to-do list for the next version. Thank you!
tr4ppist
97
tr4ppist 2021.04.15 17:41 
 

L'utente non ha lasciato alcun commento sulla valutazione.

Robert Gerald Wood
4954
Risposta dello sviluppatore Robert Gerald Wood 2021.04.15 17:43
Thats really kind of you. Thanks for taking the time to leave a review, I appreciate it :).
Rispondi alla recensione