ATR Extremes

L'Average True Range (ATR) è un indicatore comunemente usato che misura la quantità di movimento del prezzo per una durata prestabilita. Tuttavia, il valore che dà non è definito all'interno di alcun tipo di confine, il che rende quasi impossibile utilizzarlo per qualcosa di diverso dai calcoli di stop loss o take profit.

Questo indicatore è il tuo indicatore ATR standard, ma abbiamo introdotto le demarcazioni percentili in modo che tu possa vedere gli estremi.

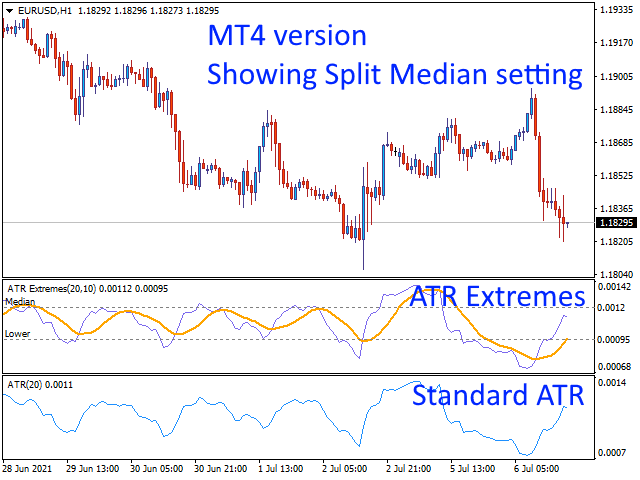
Puoi scegliere tra percentili e qualcosa che chiamiamo mediane divise

Livelli percentili

I livelli percentili sono disegnati a 1%, 5%, 20%, 50%, 80%, 95%, 99% e mostrano dove il prezzo è in relazione a tutti gli altri valori. Ad esempio, il livello del 5% dice che al di sotto della linea, solo il 5% della lettura ATR diventa così basso, e il 99% dice che dei valori ATR al di sopra di quel livello, solo l'1% del valore diventa così alto.

Sopra l'80%, potresti scegliere di iniziare a ridurre la dimensione della tua posizione per eventuali nuove operazioni, e sopra il 95% potrebbe essere un buon momento per trarre profitto prima che lo slancio cambi.

Dividi mediane

L'impostazione Split Medians è una versione più semplice con solo 4 livelli disegnati, Extreme, Higher, Median e Lower. Questi livelli funzionano esattamente allo stesso modo dei percentili, ma con un po' più di chiarezza. Ecco come funzionava la versione originale dell'indicatore fino a quando non sono diventato più esperto e l'ho cambiato in percentili.

Media mobile ATR

L'indicatore mostra anche una media mobile del valore ATR, che può essere utilizzata per confermare un cambiamento nella direzione del momentum.
Prodotti consigliati
Alpha Trend sign has been a very popular trading tool in our company for a long time. It can verify our trading system and clearly indicate trading signals, and the signals will not drift. Main functions: Based on the market display of active areas, indicators can be used to intuitively determine whether the current market trend belongs to a trend market or a volatile market. And enter the market according to the indicator arrows, with green arrows indicating buy and red arrows indicating se
Owl smart levels
Sergey Ermolov
4.24 (37)
Versione MT5  |  FAQ L' indicatore Owl Smart Levels   è un sistema di trading completo all'interno dell'unico indicatore che include strumenti di analisi di mercato popolari come i   frattali avanzati di Bill Williams , Valable ZigZag che costruisce   la corretta struttura a onde   del mercato, e i   livelli di Fibonacci che segnano i livelli esatti di entrata nel mercato e luoghi per prendere profitti. Descrizione dettagliata della strategia Istruzioni per lavorare con l'indicatore Consulente-
VR Cub
Vladimir Pastushak
VR Cub è un indicatore per ottenere punti di ingresso di alta qualità. L'indicatore è stato sviluppato per facilitare i calcoli matematici e semplificare la ricerca dei punti di ingresso in una posizione. La strategia di trading per la quale è stato scritto l'indicatore ha dimostrato la sua efficacia per molti anni. La semplicità della strategia di trading è il suo grande vantaggio, che consente anche ai trader alle prime armi di commerciare con successo con essa. VR Cub calcola i punti di apert
Daily Candle Predictor è un indicatore che prevede il prezzo di chiusura di una candela. L'indicatore è destinato principalmente all'uso sui grafici D1. Questo indicatore è adatto sia per il trading forex tradizionale che per il trading di opzioni binarie. L'indicatore può essere utilizzato come sistema di trading autonomo o può fungere da aggiunta al sistema di trading esistente. Questo indicatore analizza la candela corrente, calcolando alcuni fattori di forza all'interno del corpo della cande
Auto Fibo Pro m
DMITRII GRIDASOV
Indicatore "Auto FIBO Pro" Crypto_Forex: è un ottimo strumento ausiliario nel trading! - L'indicatore calcola e posiziona automaticamente sul grafico i livelli di Fibo e le linee di tendenza locali (colore rosso). - I livelli di Fibonacci indicano le aree chiave in cui il prezzo può invertirsi. - I livelli più importanti sono 23,6%, 38,2%, 50% e 61,8%. - Puoi usarlo per lo scalping di inversione o per il trading di zone grid. - Ci sono molte opportunità per migliorare il tuo sistema attuale us
Trend PA
Mikhail Nazarenko
5 (3)
The Trend PA indicator uses   Price Action   and its own filtering algorithm to determine the trend. This approach helps to accurately determine entry points and the current trend on any timeframe. The indicator uses its own algorithm for analyzing price changes and Price Action. Which gives you the advantage of recognizing, without delay, a new nascent trend with fewer false positives. Trend filtering conditions can be selected in the settings individually for your trading style. The indicator
Blahtech Market Profile
Blahtech Limited
4.53 (15)
Was: $249  Now: $99   Market Profile defines a number of day types that can help the trader to determine market behaviour. A key feature is the Value Area, representing the range of price action where 70% of trading took place. Understanding the Value Area can give traders valuable insight into market direction and establish the higher odds trade. It is an excellent addition to any system you may be using. Blahtech Limited presents their Market Profile indicator for the MetaTrader community. Ins
Trend Oscillator - è un indicatore Crypto_Forex personalizzato avanzato, uno strumento di trading efficiente! - Viene utilizzato un nuovo metodo di calcolo avanzato - 20 opzioni per il parametro "Prezzo per calcolo". - L'oscillatore più fluido mai sviluppato. - Colore verde per i trend al rialzo, colore rosso per i trend al ribasso. - Valori di ipervenduto: inferiori a 5, valori di ipercomprato: superiori a 95. - Ci sono molte opportunità per aggiornare anche le strategie standard con questo i
[ZhiBiCCI] indicators are suitable for all cycle use, and are also suitable for all market varieties. [ZhiBiCCI] Green solid line is a reversal of bullish divergence. The green dotted line is a classic bullish divergence. [ZhiBiCCI] The solid line to the red is a reverse bearish divergence. The red dotted line is a classical bearish divergence. [ZhiBiCCI] can be set in the parameters (Alert, Send mail, Send notification), set to (true) to send instant signals to the alarm window, email, insta
Fourteen plus nine TD Sequential
MOHAMMED IMAD HUSSEIN BASSEE
Fourteen plus nine What is it for? Applying Tom DeMark’s TD Sequential serves the purpose of identifying a price point where an uptrend or a downtrend exhausts itself and reverses. . What are the main components of TD Sequential? TD Sequential has two parts – TD Setup and TD Countdown. The first phase of TD Sequential starts with a TD Setup and is completed with a 9 count. When the 9 count is completed, it is at that point, a price pause, price pullback, or reversal is likely. It is also at tha
EZZ Zig Zag MT4
Paulo Rocha
5 (1)
EZZ Elite Zig Zag is an indicator for the MetaTrader 4 terminal. This indicator traces the peak of the trend based on the market reversal, thus showing various opportunities in the financial market. EZZ Elite Zig Zag is a visual tool, intuitive, and easy to understand and use.  Test it Yourself by Downloading it for Free. Author Paulo Rocha all rights reserved
Trendiness Index
Libertas LLC
5 (3)
"The trend is your friend" is one of the best known sayings in investing, because capturing large trendy price movements can be extremely profitable. However, trading with the trend is often easier said than done, because many indicators are based on price reversals not trends. These aren't very effective at identifying trendy periods, or predicting whether trends will continue. We developed the Trendiness Index to help address this problem by indicating the strength and direction of price trend
Infinity Trend Pro
Yaroslav Varankin
1 (1)
This is a trend indicator without redrawing Developed instead of the binary options strategy (by the color of the Martingale candlestick) Also works well in forex trading When to open trades (binary options) A signal will appear in the place with a candle signaling the current candle It is recommended to open a deal for one candle of the current timeframe M1 and M5 When a blue dot appears, open a deal up When a red dot appears, open a trade down. How to open trades on Forex. When a signal is rec
Fibonacci retracement and extension line drawing tool Fibonacci retracement and extended line drawing tool for MT4 platform is suitable for traders who use  golden section trading Advantages: There is no extra line, no too long line, and it is easy to observe and find trading opportunities Trial version: https://www.mql5.com/zh/market/product/35884 Main functions: 1. Multiple groups of Fibonacci turns can be drawn directly, and the relationship between important turning points can be seen
Happy Scalping Indicator
Leandro Bernardez Camero
Questo indicatore è stato progettato per uno scalping aggressivo e per entrate rapide nelle opzioni binarie , generando segnali su ogni candela in modo da sapere esattamente cosa sta succedendo in ogni momento. Unisciti al canale Happy Scalping: MQL5 Non ripinta : il segnale della candela attuale viene generato in tempo reale , il che significa che può cambiare mentre la candela è ancora in formazione, a seconda che il prezzo salga o scenda rispetto alla chiusura della candela precedente. Tutt
ZhiBiMACD MT4
Qiuyang Zheng
4.5 (2)
This is a unique MACD indicator that is more accurate and easy to use than traditional MACD. It is suitable for any chart cycle and is suitable for any market variety. The red column is the (Buy) band signal, and the blue column is the (Sell) band signal. The yellow and green lines are trend lines, and the two lines never cross. Buy: In the blue column, look at the green line up through the middle 0 axis. Sell: In the red column, look at the yellow line down the middle 0 axis. The MACD's de
PZ Harmonacci Patterns
PZ TRADING SLU
3.17 (6)
Trade smarter, not harder: Empower your trading with Harmonacci Patterns This is arguably the most complete harmonic price formation auto-recognition indicator you can find for the MetaTrader Platform. It detects 19 different patterns, takes fibonacci projections as seriously as you do, displays the Potential Reversal Zone (PRZ) and finds suitable stop-loss and take-profit levels. [ Installation Guide | Update Guide | Troubleshooting | FAQ | All Products ] It detects 19 different harmonic pric
L'indicatore costruisce le quotazioni attuali, che possono essere confrontate con quelle storiche e su questa base fanno una previsione del movimento dei prezzi. L'indicatore ha un campo di testo per una rapida navigazione fino alla data desiderata. Opzioni: Simbolo - selezione del simbolo che visualizzerà l'indicatore; SymbolPeriod - selezione del periodo da cui l'indicatore prenderà i dati; IndicatorColor - colore dell'indicatore; HorisontalShift - spostamento delle virgolette disegnate d
Super Reversal Pattern
Parfait Mujinga Ndalika
Super Reversal Pattern Indicator Unlock the power of advanced pattern recognition with our Super Reversal Pattern Indicator. Designed for traders seeking precision and reliability, this indicator identifies one of the most effective reversal patterns in technical analysis, offering a significant edge in your trading strategy. Key Features: Non-Repainting Accuracy: Enjoy the confidence of non-repainting technology. Once a Super Reversal Pattern is detected, it remains static, providing consiste
Cosmic Diviner X Planet
Olena Kondratenko
4 (2)
This unique multi-currency strategy simultaneously determines the strength of trends and market entry points, visualizing this using histograms on the chart. The indicator is optimally adapted for trading on the timeframes М5, М15, М30, Н1. For the convenience of users, the indicator renders the entry point (in the form of an arrow), recommended take profit levels (TP1, TP2 with text labels) and the recommended Stop Loss level. The take profit levels (TP1, TP2) are automatically calculated for
The Super Arrow Indicator provides non-repainting buy and sell signals with exceptional accuracy. Key Features No repainting – confirmed signals remain fixed Clear visual arrows: green for buy, red for sell Real-time alerts via pop-up, sound, and optional email Clean chart view with no unnecessary clutter Works on all markets: Forex, gold, oil, indices, crypto Adjustable Parameters TimeFrame Default: "current time frame" Function: Sets the time frame for indicator calculation Options: Can be set
Insider Scalper Binary This tool is designed to trade binary options. for short temporary spends. to make a deal is worth the moment of receiving the signal and only 1 candle if it is m1 then only for a minute and so in accordance with the timeframe. for better results, you need to select well-volatile charts.... recommended currency pairs eur | usd, usd | jpy .... the indicator is already configured, you just have to add it to the chart and trade .... The indicator signals the next candle.
Power Renko MT4
Pierce Vallieres
Power Renko is an indicator which plots Renko bricks underneath the chart using a histogram. You can select the brick size and the timeframe of the Renko bricks as well as whether or not to use the close price or the high/low price of the candles. Renko bricks are based on price alone, not time, therefor the Renko bricks will not be aligned with the chart's time. They are extremely useful for trend trading and many different strategies can be formed from them. Buffers are provided allowing you t
RSI Speed mp
DMITRII GRIDASOV
Indicatore Crypto_Forex "RSI SPEED" per MT4 - ottimo strumento predittivo, senza bisogno di ridisegnare. - Il calcolo di questo indicatore si basa su equazioni fisiche. L'RSI SPEED è la derivata prima dell'RSI stesso. - L'RSI SPEED è ottimo per scalping di ingresso nella direzione del trend principale. - Usalo in combinazione con un indicatore di trend appropriato, ad esempio HTF MA (come nelle immagini). - L'indicatore RSI SPEED mostra la velocità con cui l'RSI cambia direzione: è molto sensi
Stepping Trend
Mpendulo Chiliza
The Stepping Trend Indicator     The Steppi ng Trend indicator uses the  average true range  (ATR indicator) in its calculation. This gives you control to set your own average true range period, I set the Default as 10.   Indicator Details. Green Arrow Up: This means you are at the starting point of a new bullish trend, it’s time to buy.   Red  Arrow  Down : This means you are at the starting point of a new  bearish  trend, it’ s time to sell .   What if you miss the Arrow Signal?   No prob
Renko, Heiken Ashi, Ticks Bar, Range Bar.    Easy switching, easy setup, all in one window.        Place the Custom Chart indicator and view Renko, Heiken Ashi, Tick bar, Range bar charts in real time at real chart.    Position the offline chart window so that the indicator control panel is visible.    Switch the chart mode by click of a button.    Connect to the output chart any indicator, expert advisor without any restrictions.    No, it doesn't work in the tester.    Yes, you can use an
The indicator helps to identify possible rollbacks and reversals. Shows the direction of the price movement and is painted in the appropriate color. Allows you to conduct trend and counter trend trading It works on all timeframes, on any currency pairs, metals and cryptocurrency Can be used when working with binary options Distinctive features Does not redraw; Simple and clear settings; It works on all timeframes and on all symbols; Suitable for trading currencies, metals, options and cryptocurr
Indicatore Crypto_Forex "Morning Star pattern" per MT4. - L'indicatore "Morning Star pattern" è un indicatore molto potente per il trading Price Action: nessuna rielaborazione, nessun ritardo. - L'indicatore rileva i pattern rialzisti Morning Star sul grafico: segnale freccia blu sul grafico (vedi immagini). - Con avvisi su PC, dispositivi mobili ed e-mail. - È disponibile anche il suo fratello, l'indicatore ribassista "Evening Star pattern" (segui il link qui sotto). - L'indicatore "Morning S
Distinctive
Tatiana Savkevych
Distinctive is a forex trending arrow indicator for identifying potential entry points. I like it, first of all, because it has a simple mechanism of work, adaptation to all time periods and trading tactics. Created on the basis of a regression channel with filters. Plotting the Lawrence indicator signals on a price function chart using a mathematical approach. How it works - when the price breaks out in the overbought / oversold zone (channel levels), a buy or sell signal is generated. Everyt
Overview Harmonic Patterns MT4 is a technical analysis indicator designed for the MetaTrader 5 platform. It identifies and displays harmonic price patterns, such as Butterfly, Cypher, Crab, Bat, Shark, and Gartley, in both bullish and bearish directions. The indicator calculates key price levels, including entry, stop loss, and three take-profit levels, to assist traders in analyzing market movements. Visual elements and customizable alerts enhance usability on the chart. Features Detects six ha
Gli utenti di questo prodotto hanno anche acquistato
Indicatore Miraculous – Strumento Forex e Binario 100% Non-Repaint Basato sul Quadrato di Nove di Gann Questo video presenta l' Indicatore Miraculous , uno strumento di trading altamente accurato e potente, sviluppato specificamente per i trader di Forex e Opzioni Binarie . Ciò che rende unico questo indicatore è la sua base sul leggendario Quadrato di Nove di Gann e sulla Legge della Vibrazione di Gann , rendendolo uno degli strumenti di previsione più precisi disponibili nel trading moderno. L
Gann Made Easy
Oleg Rodin
4.83 (155)
Gann Made Easy è un sistema di trading Forex professionale e facile da usare che si basa sui migliori principi del trading utilizzando la teoria di mr. WD Gann. L'indicatore fornisce segnali ACQUISTA e VENDI accurati, inclusi i livelli di Stop Loss e Take Profit. Puoi fare trading anche in movimento utilizzando le notifiche PUSH. CONTATTATEMI DOPO L'ACQUISTO PER RICEVERE CONSIGLI DI TRADING, BONUS E L'ASSISTENTE EA GANN MADE EASY GRATUITAMENTE! Probabilmente hai già sentito parlare molte volte d
M1 Sniper
Oleg Rodin
5 (18)
M1 SNIPER è un sistema di indicatori di trading facile da usare. Si tratta di un indicatore a freccia progettato per l'intervallo temporale M1. L'indicatore può essere utilizzato come sistema autonomo per lo scalping sull'intervallo temporale M1 e come parte del tuo sistema di trading esistente. Sebbene questo sistema di trading sia stato progettato specificamente per il trading sull'intervallo temporale M1, può comunque essere utilizzato anche con altri intervalli temporali. Inizialmente ho pro
Meravith
Ivan Stefanov
5 (2)
Strumento per market maker. Meravith: Analizzerà tutti i timeframe e mostrerà il trend attualmente in corso. Evidenzierà le zone di liquidità (equilibrio dei volumi) dove i volumi rialzisti e ribassisti sono uguali. Mostrerà tutti i livelli di liquidità dei diversi timeframe direttamente sul grafico. Genererà e presenterà un’analisi di mercato testuale a scopo di riferimento. Calcolerà obiettivi, livelli di supporto e punti di stop-loss in base al trend attuale. Calcolerà il rapporto rischio/ren
RFI levels PRO
Roman Podpora
5 (1)
Indicatore in anticipo   determina i livelli e le zone di inversione del mercato , consente di attendere che il prezzo ritorni al livello ed entrare all'inizio di un nuovo trend, e non alla sua fine. Lui mostra   livelli di inversione   dove il mercato conferma un cambio di direzione e forma un ulteriore movimento. L'indicatore funziona senza ridisegnare, è ottimizzato per qualsiasi strumento e rivela il suo massimo potenziale quando abbinato al   LINEE DI TENDENZA PRO   indicatore. Scanner st
Game Changer Indicator
Vasiliy Strukov
4.37 (19)
Game Changer è un indicatore di tendenza rivoluzionario, progettato per essere utilizzato su qualsiasi strumento finanziario, per trasformare il tuo MetaTrader in un potente analizzatore di trend. Funziona su qualsiasi intervallo temporale e aiuta a identificare i trend, segnala potenziali inversioni, funge da meccanismo di trailing stop e fornisce avvisi in tempo reale per risposte tempestive del mercato. Che tu sia un professionista esperto o un principiante in cerca di un vantaggio, questo st
TPSpro RFI Levels
Roman Podpora
4.85 (27)
ISTRUZIONI RUS  /  ISTRUZIONI   ENG  /  Versione MT5 Funzioni principali: Visualizza le zone attive di venditori e acquirenti! L'indicatore mostra tutti i livelli/zone di primo impulso corretti per acquisti e vendite. Quando questi livelli/zone vengono attivati, ovvero dove inizia la ricerca dei punti di ingresso, i livelli cambiano colore e vengono riempiti con colori specifici. Vengono visualizzate anche delle frecce per una percezione più intuitiva della situazione. LOGIC AI - Visualizzazion
First 25 copies at $80, after that price becomes $149 (3 copies left) Gold Signal Pro is a powerful MT4 indicator designed to help traders spot strong price reactions in the market. It focuses on clear wick rejections , showing when price strongly rejects a level and often continues in the same direction. Gold Signal Pro is mainly built for scalping gold (XAUUSD) and works best on lower timeframes like M5 and M15 , where timing matters most. That said, it can also be used on any forex pair, a
PRO Renko System
Oleg Rodin
5 (30)
PRO Renko System è un sistema di trading altamente accurato appositamente progettato per il trading di grafici RENKO. Questo è un sistema universale che può essere applicato a vari strumenti di trading. Il sistema neutralizza efficacemente il cosiddetto rumore di mercato che consente di accedere a segnali di inversione accurati. L'indicatore è molto facile da usare e ha un solo parametro responsabile della generazione del segnale. Puoi facilmente adattare lo strumento a qualsiasi strumento di
Segnale GoldRush Trend Arrow L'indicatore GoldRush Trend Arrow Signal fornisce un'analisi precisa e in tempo reale dei trend, pensata appositamente per gli scalper ad alta velocità e a breve termine nel mercato XAU/USD. Progettato specificamente per il timeframe di 1 minuto, questo strumento mostra frecce direzionali che indicano chiari punti di ingresso, consentendo agli scalper di navigare con sicurezza nelle condizioni di mercato volatili. L'indicatore è composto da frecce di avviso PRIMA
Trend Screener
STE S.S.COMPANY
4.79 (95)
Indicatore di tendenza, soluzione unica rivoluzionaria per il trading di tendenze e il filtraggio con tutte le importanti funzionalità di tendenza integrate in un unico strumento! È un indicatore multi-timeframe e multi-valuta al 100% non ridipingibile che può essere utilizzato su tutti i simboli/strumenti: forex, materie prime, criptovalute, indici e azioni. OFFERTA A TEMPO LIMITATO: l'indicatore di screening di supporto e resistenza è disponibile a soli 50$ e a vita. (Prezzo originale 250$) (o
Trend indicator AI
Ramil Minniakhmetov
4.65 (80)
Trend Ai indicator è un ottimo strumento che migliorerà l'analisi di mercato di un trader combinando l'identificazione della tendenza con punti di ingresso utilizzabili e avvisi di inversione. Questo indicatore consente agli utenti di navigare nelle complessità del mercato forex con fiducia e precisione Oltre ai segnali primari, l'indicatore Ai di tendenza identifica i punti di ingresso secondari che si presentano durante i pullback o i ritracciamenti, consentendo ai trader di capitalizzare le
Trend Lines PRO
Roman Podpora
5 (1)
LINEE DI TENDENZA PRO       Aiuta a capire dove il mercato sta realmente cambiando direzione. L'indicatore mostra reali inversioni di tendenza e punti in cui i principali attori rientrano. Vedi  Linee BOS   Cambiamenti di tendenza e livelli chiave su timeframe più ampi, senza impostazioni complesse o rumore inutile. I segnali non vengono ridisegnati e rimangono sul grafico dopo la chiusura della barra. VERSIONE MT 5     -      Svela il suo massimo potenziale se abbinato all'indicatore   RFI LEVE
System Trend Pro
Aleksandr Makarov
5 (2)
System Trend Pro - This is the best trend trading indicator!!! The indicator no repaint!!!  The indicator has   MTF   mode, which adds confidence to trading on the trend (   no repaint   ). How to trade? Everything is very simple, we wait for the first signal (big arrow), then wait for the second signal (small arrow) and enter the market in the direction of the arrow. (See screens 1 and 2.) Exit on the opposite signal or take 20-30 pips, close half of it, and keep the rest until the opposite
Currency Strength Wizard è un indicatore molto potente che ti fornisce una soluzione all-in-one per un trading di successo. L'indicatore calcola la potenza di questa o quella coppia forex utilizzando i dati di tutte le valute su più intervalli di tempo. Questi dati sono rappresentati in una forma di indice di valuta facile da usare e linee elettriche di valuta che puoi utilizzare per vedere il potere di questa o quella valuta. Tutto ciò di cui hai bisogno è collegare l'indicatore al grafico che
Beast Super Signal
Dustin Vlok
4.73 (89)
Alla ricerca di un potente indicatore di trading forex che possa aiutarti a identificare facilmente opportunità di trading redditizie? Non guardare oltre il Super Segnale Bestia. Questo indicatore basato sulle tendenze di facile utilizzo monitora continuamente le condizioni del mercato, cercando nuove tendenze in via di sviluppo o saltando su quelle esistenti. Il Beast Super Signal fornisce un segnale di acquisto o di vendita quando tutte le strategie interne sono allineate e sono al 100% in con
Gold Scalper Super
Aleksandr Makarov
5 (2)
Gold Scalper Super is an easy-to-use trading system. The indicator can be used as a standalone scalping system on the M1 time frame, as well as part of your existing trading system. Bonus: when purchasing an indicator, Trend Arrow Super is provided free of charge, write to us after purchase. The indicator 100% does not repaint!!! If a signal appears, it does not disappear! Unlike indicators with redrawing, which lead to the loss of a deposit, because they can show a signal and then remove it.
Volatility Trend System - un sistema di trading che fornisce segnali per le voci. Il sistema di volatilità fornisce segnali lineari e puntuali nella direzione del trend, nonché segnali per uscirne, senza ridisegnare e ritardi. L'indicatore di tendenza monitora la direzione della tendenza a medio termine, mostra la direzione e il suo cambiamento. L'indicatore di segnale si basa sui cambiamenti della volatilità e mostra gli ingressi nel mercato. L'indicatore è dotato di diversi tipi di avvisi. Pu
Smc Blast Signal
Mohit Dhariwal
5 (3)
Full Fledged EA and Alert plus for alerts will also be provided in this offer along with the purchase of Indicator. Limited copies only at this price and Ea too. Grab your copy soon Alert plus for indicator with set file is kept in comment section with the image  SMC Blast Signal with FVG, BOS and trend Breakout The SMC Blast Signal is a Precise trading system for Meta Trader 4 that uses Smart Money Concepts (SMC), including Fair Value Gaps (FVG) and Break of Structure (BOS), to identify high-pr
Presenting one-of-a-kind Gann Indicator for XAUUSD IQ Gold Gann Levels is a non-repainting, precision tool designed exclusively for XAUUSD/Gold intraday trading. It uses W.D. Gann’s square root method to plot real-time support and resistance levels, helping traders spot high-probability entries with confidence and clarity. William Delbert Gann (W.D. Gann) was an exceptional market analyst whose trading technique was based on a complex blend of mathematics, geometry, astrology, and ancient calcul
ATTUALMENTE SCONTATO DEL 40% La soluzione migliore per ogni principiante o trader esperto! Questo indicatore è uno strumento di trading unico, di alta qualità e conveniente perché abbiamo incorporato una serie di caratteristiche proprietarie e una nuova formula. Con un solo grafico è possibile leggere la forza delle valute per 28 coppie Forex! Immaginate come migliorerà il vostro trading perché sarete in grado di individuare l'esatto punto di innesco di una nuova tendenza o di un'opportunità
Pulse Scalping Line - an indicator for identifying potential pivot points. Based on this indicator, you can build an effective Martingale system. According to our statistics, the indicator gives a maximum of 4 erroneous pivot points in a series. On average, these are 2 pivot points. That is, the indicator shows a reversal, it is erroneous. This means that the second signal of the indicator will be highly accurate. Based on this information, you can build a trading system based on the Martingale
Pip Storm Signal
Camila Bernardez Camero
Segnale PIP STORM PIP STORM è un sistema avanzato basato su frecce, progettato per un'esecuzione ultra-frequente durante le fasi di alta volatilità del mercato. Il suo obiettivo principale è mantenere un flusso costante di segnali di scalping utilizzabili, senza fare affidamento su indicatori ritardati o abusati. Non predice — reagisce con precisione alle zone di transizione del prezzo, catturando micro-rotture e squilibri di liquidità con un motore di conferma minimalista in tempo reale. Rim
Apollo SR Master è un indicatore di Supporto/Resistenza con caratteristiche speciali che rendono il trading con le zone di Supporto/Resistenza più semplice e affidabile. L'indicatore calcola le zone di Supporto/Resistenza in tempo reale senza alcun ritardo, rilevando i massimi e i minimi dei prezzi locali. Quindi, per confermare la nuova area SR formata, l'indicatore mostra un segnale speciale che segnala che la zona SR può essere presa in considerazione e utilizzata come un vero e proprio segna
Questo cruscotto mostra gli ultimi pattern armonici disponibili per i simboli selezionati, in modo da risparmiare tempo ed essere più efficienti / versione MT5 . Indicatore gratuito: Basic Harmonic Pattern Colonne dell'indicatore Symbol : vengono visualizzati i simboli selezionati Trend: rialzista o ribassista Pattern: tipo di pattern (gartley, butterfly, bat, crab, shark, cypher o ABCD) Entry: prezzo di ingresso SL: prezzo di stop loss TP1: 1 prezzo di take profit TP2: 2 prezzo di take pr
- Real price is 200$ - 50% Discount (It is 99$ now) -   It is enabled for 3 purchases. Contact me for extra bonus (Gann Trend   indicator), instruction or any questions! - Non-repaint, No lag - I just sell my products in Elif Kaya Profile, any other websites are stolen old versions, So no any new updates or support. - Lifetime update free Gann Gold EA MT5 Introduction W.D. Gann’s theories in technical analysis have fascinated traders for decades. It offers a unique approach beyond traditional c
Attualmente 40% di sconto! La soluzione migliore per ogni principiante o trader esperto! Questo software per cruscotti funziona su 28 coppie di valute. Si basa su 2 dei nostri indicatori principali (Advanced Currency Strength 28 e Advanced Currency Impulse). Offre un'ottima panoramica dell'intero mercato Forex. Mostra i valori di forza delle valute avanzate, la velocità di movimento delle valute e i segnali per 28 coppie Forex in tutti i (9) timeframe. Immaginate come migliorerà il vostro tra
Scalper Inside PRO
Alexey Minkov
4.74 (69)
* VALENTINE’S DAY 20% SALE * LIMITED TIME OFFER * An exclusive indicator that utilizes an innovative algorithm to swiftly and accurately determine the market trend. The indicator automatically calculates opening, closing, and profit levels, providing detailed trading statistics. With these features, you can choose the most appropriate trading instrument for the current market conditions. Additionally, you can easily integrate your own arrow indicators into Scalper Inside Pro to quickly evaluate
Advanced Arrow
Alfred Kamal
3.9 (39)
This indicator depends on some secrets equations to draw Signals with Stop loss and maximum 4 Take profits. There is a free EA depends on this indicator as a gift when you purchase/rent it. Features Simply it gives you entry point as Ready sign (Buy / Sell) and arrow (Buy / Sell) after candle closed, also SL line and 4 TP lines or less. Once SL-TP lines are shown with the arrow, they remains as they are until signal change. It is historical indicator. No Repaint. user manual for V5 please click
MetaForecast M4
Vahidreza Heidar Gholami
5 (2)
MetaForecast predice e visualizza il futuro di qualsiasi mercato basandosi sull'armonia dei dati dei prezzi. Sebbene il mercato non sia sempre prevedibile, se esiste un modello nei prezzi, MetaForecast può prevedere il futuro con la massima precisione possibile. Rispetto ad altri prodotti simili, MetaForecast può generare risultati più accurati analizzando le tendenze di mercato. Parametri di input Past size (Dimensione passata) Specifica il numero di barre che MetaForecast utilizza per creare
Altri dall’autore
Multi Chart Crosshairs MT5
Robert Gerald Wood
5 (4)
Questo indicatore è progettato per rendere le revisioni di molti grafici su scale temporali diverse più rapide e più facili da eseguire. Tieni traccia di tempo e prezzo su più grafici Cambia simbolo su un grafico e anche tutti gli altri grafici dello stesso simbolo verranno modificati. Facile da usare, veloce da padroneggiare L'indicatore consente di identificare il prezzo e l'ora in cui si trova il puntatore del mouse sul grafico corrente, su tutti gli altri grafici aperti sullo stesso simbolo.
Multi Chart Crosshairs
Robert Gerald Wood
5 (1)
This indicator is designed to make reviews of many charts on different timescales quicker, and easier to do. Track Time and Price across multiple charts Change Symbol on one chart and all other charts of the same symbol will be changed too. Easy to use, quick to master The indicator allows you to identify the price and time where the mouse pointer is on the current chart, across all other charts open on the same Symbol. This allows you to quickly see information on multiple charts whereas normal
Chart Drawing Cloner
Robert Gerald Wood
5 (2)
Questo script ti consente di copiare oggetti di disegno di qualsiasi tipo, come linee di tendenza, ritracciamenti di Fibonachi ecc., su uno o più altri grafici. Per impostazione predefinita, lo script copierà tutti gli oggetti del grafico corrente, ovvero il grafico a cui è stato applicato lo script, in qualsiasi altro grafico dello stesso simbolo attualmente caricato. Impostazioni DestinazioneTimeframe Se impostato su un valore diverso da PERIOD_CURRENT, copierà gli oggetti in qualsiasi graf
FREE
Ho creato questo semplice indicatore mentre stavo imparando a conoscere TheStrat di Rob Smith e l'ho trovato così utile, ho pensato di condividerlo con te. Se lo trovi utile, guarda gli altri indicatori che ho pubblicato su MQL5. L'indicatore disegna semplicemente una singola linea sul grafico che mostra il livello di prezzo selezionato da un periodo di tempo più elevato. Usando le impostazioni hai il pieno controllo sull'intervallo di tempo visualizzato ma, per   impostazione predefinita, calco
FREE
This script allows you to toggle the "Show Trade Levels" option, but for the current chart only. Normally, you can only change the setting using the Options -> Chart menu for ALL charts, but this script allows you to do it for a SINGLE chart. I'm using it when I take screenshots, because most of the time I'm not trying to show the trades, just some functionality of one of my other tools. Iif you need that functionality, then this script is very helpful! If the script helps you, please let me k
FREE
A simple script that can delete all the drawing objects on a chart, or just the objects of a specific type. Settings: DeleteObjectsOfType By default the value will be blank which means ALL drawing objects on the chart will be deleted. If you only wish to delete specific types of drawing object, change this setting to the type of object to delete. For example, Fibonacci Retracement, Text, Label or Trend Line. Please see the demonstration video for more information.
FREE
TheStrat Patterns
Robert Gerald Wood
This indicator will draw patterns based on Rob Smith's The Strat as they emerge in real time on your chart. As price evolves, TheStrat offers 18 distinct price action patterns that can help you get good entries in the market. Each pattern involves two or three candles, and this indicator will draw a bounding box around the candles and name the pattern. The indicator also shows when a potential setup is forming, known by stratters as an Actionable signal. Candles Each candle is defined by its
TheStrat Levels
Robert Gerald Wood
This indicator draws the prior Highs and Lows for multiple timeframes, and can display potential Take Profit and Stop Loss levels. In Rob Smith's # The Strat   terms,   these are potential entry points, or alternatively potential targets for open positions. I like to use them in both ways. On a lower timeframe, say 5 minutes to get a good entry on a daily or weekly level, and then as a potential target. Very small stops required giving an excellent risk/reward ratio. Please watch the DEMO video
TheStrat Candles
Robert Gerald Wood
5 (1)
Questo indicatore disegnerà un'etichetta sopra o sotto ogni candela in base a       di Rob Smith       La Stratocaster       man mano che si sviluppano nel tempo sul tuo grafico. Con l'evolversi del prezzo, una candela può passare da uno stato all'altro. Quando la candela si apre per la prima volta, se si trova completamente all'interno del massimo e del minimo delle candele precedenti, inizierà come Tipo 1. Con il passare del tempo, se rompe il massimo o il minimo della candela precedente, ve
TheStrat FTFC
Robert Gerald Wood
FTFC si riferisce alla Full Timeframe Continuity come definita da   The Strat   di Rob Smith. Questo indicatore disegna due linee sul grafico, una delle più alte tra i livelli di apertura trimestrale, mensile, settimanale, giornaliera o oraria e la seconda tra i più bassi di questi valori. Questo ti dà un canale sopra o sotto il quale è più probabile che il trading sia molto fortemente in una direzione. Tra le righe, l'azione dei prezzi sarà più instabile e potresti utilizzare stop più ampi. Vie
Round Price Levels
Robert Gerald Wood
I mercati amano davvero i numeri tondi e spesso fungono da supporto in un mercato in calo o da resistenza quando il prezzo sale. Questo indicatore è progettato per disegnare livelli di prezzo a valori Round. Lo fa automaticamente, ma hai anche la possibilità di ignorarlo e determinare i livelli che desideri vedere. Un livello rotondo può essere semplice come passaggi di 10, quindi 10, 20, 30 ecc. o se stai lavorando con il Forex, forse vuoi vedere i cambiamenti a 0.1 o 0.01. L'indicatore disegna
TheStrat Monitor
Robert Gerald Wood
3.67 (3)
If you've not already learnt about The Strat trading strategy , go google it now. I promise it won't be a waste of your time, and you will likely learn some new tricks whether you use it or not. OK, so now you know what TheStrat is, you will be able to understand what this indicator can do for you. Key Features In short, the Indicator will: Show Timeframe Continuity for all supported timeframes Supports two timeset views, Day trader and Swing trader Show when Full Timeframe Continuity is in pla
Quando fai trading usando   The Strat   , è importante tenere d'occhio più tempi. Questo indicatore mostrerà lo stato giornaliero, settimanale, mensile e trimestrale della candela corrente per ogni periodo di tempo. Un'icona a forma di cerchio mostra che la candela in quel lasso di tempo è attualmente una Inside o Type 1 nella terminologia di TheStrat. Una candela Inside Day sta consolidando l'azione dei prezzi e stiamo cercando un breakout dall'intervallo. Un'icona a triangolo, rivolta verso l'
Active Pivot Levels
Robert Gerald Wood
5 (1)
I livelli pivot sono un livello tecnico consolidato riconosciuto in ogni mercato. Questo indicatore disegnerà gli attuali pivot trimestrali, mensili, settimanali, giornalieri e quadriorari sul grafico, per qualsiasi simbolo. Puoi anche mostrare i livelli di Supporto e Resistenza per ogni periodo e scegliere quale visualizzare dal livello 1 al 4.     Scegli il tipo di Pivot tra: Standard Camarilla DeMark Woodie Fibonacci Si prega di notare che i pivot DeMark hanno un unico livello di supporto e r
Range Exhaustion
Robert Gerald Wood
L'esaurimento dell'intervallo si verifica quando il prezzo raggiunge o supera l'intervallo previsto per il periodo corrente. A questi livelli, il prezzo inizia a perdere slancio rispetto all'inizio del periodo, quindi è un buon punto per assicurarsi di non assumere nuove posizioni. Questo indicatore ti mostrerà dove è probabile che ciò accada sul tuo grafico, mostrando i livelli per periodi giornalieri, settimanali e mensili. Quando vedi che il prezzo supera questi livelli di esaurimento, ti sta
This indicator will draw a label above or below each candle based on   Rob Smith's   The Strat   as they develop over time on your chart. As price evolves, a candle can switch between three states. When the candle first opens, if it sits completely within the previous candles high and low, then it will start as a Type 1. As time moves on, if it breaks either the high or low of the previous candle, it will be come a type 2, and should the price action be volatile and directionless, it may then
TheStrat Levels MT5
Robert Gerald Wood
5 (1)
This indicator draws the prior Highs and Lows for multiple timeframes, and can display potential Take Profit and Stop Loss levels. In Rob Smith's # The Strat  terms, these are potential entry points, or alternatively potential targets for open positions. I like to use them in both ways. On a lower timeframe, say 5 minutes to get a good entry on a daily or weekly level, and then as a potential target. Very small stops required giving an excellent risk/reward ratio. Key Features  - Levels from Hou
TheStrat FTFC MT5
Robert Gerald Wood
FTFC si riferisce alla Full Timeframe Continuity come definita da   The Strat   di Rob Smith. Questo indicatore disegna due linee sul grafico, una delle più alte tra i livelli di apertura trimestrale, mensile, settimanale, giornaliera o oraria e la seconda tra i più bassi di questi valori. Questo ti dà un canale sopra o sotto il quale è più probabile che il trading sia molto fortemente in una direzione. Tra le righe, l'azione dei prezzi sarà più instabile e potresti utilizzare stop più ampi. Vie
This indicator will draw patterns based on   Rob Smith's   The Strat   as they emerge in real time on your chart. As price evolves,   TheStrat   offers 18 distinct price action patterns that can help you get good entries in the market. Each pattern involves two or three candles, and this indicator will draw a bounding box around the candles and name the pattern. The indicator also shows when a potential setup is forming, known by stratters as an Actionable signal. Candles Each candle is defin
TheStrat Monitor MT5
Robert Gerald Wood
5 (1)
Se non hai già imparato a conoscere   la strategia di trading di The Strat   , vai su Google ora. Ti prometto che non sarà una perdita di tempo e probabilmente imparerai alcuni nuovi trucchi, che tu lo usi o meno. OK, quindi ora sai cos'è TheStrat, sarai in grado di capire cosa può fare questo indicatore per te. Caratteristiche principali In breve, l'indicatore: Mostra la continuità del periodo di tempo per tutti i periodi di tempo supportati Supporta due viste timeset, Day trader e Swing trade
TheStrat TFC Monitor MT5
Robert Gerald Wood
5 (1)
Quando fai trading usando   The Strat   , è importante tenere d'occhio più tempi. Questo indicatore mostrerà lo stato giornaliero, settimanale, mensile e trimestrale della candela corrente per ogni periodo di tempo. Un'icona a forma di cerchio mostra che la candela in quel lasso di tempo è attualmente una Inside o Type 1 nella terminologia di TheStrat. Una candela Inside Day sta consolidando l'azione dei prezzi e stiamo cercando un breakout dall'intervallo. Un'icona a triangolo, rivolta verso l'
I livelli pivot sono un livello tecnico consolidato riconosciuto in ogni mercato. Questo indicatore disegnerà gli attuali pivot trimestrali, mensili, settimanali, giornalieri e quadriorari sul grafico, per qualsiasi simbolo. Puoi anche mostrare i livelli di Supporto e Resistenza per ogni periodo e scegliere quale visualizzare dal livello 1 al 4.     Scegli il tipo di Pivot tra: Standard Camarilla DeMark Woodie Fibonacci Si prega di notare che i pivot DeMark hanno un unico livello di supporto e r
I mercati amano davvero i numeri tondi e spesso fungono da supporto in un mercato in calo o da resistenza quando il prezzo sale. Questo indicatore è progettato per disegnare livelli di prezzo a valori Round. Lo fa automaticamente, ma hai anche la possibilità di ignorarlo e determinare i livelli che desideri vedere. Un livello rotondo può essere semplice come passaggi di 10, quindi 10, 20, 30 ecc. o se stai lavorando con il Forex, forse vuoi vedere i cambiamenti a 0.1 o 0.01. L'indicatore disegna
ATR Extremes MT5
Robert Gerald Wood
L'Average True Range (ATR) è un indicatore comunemente usato che misura la quantità di movimento del prezzo in una determinata durata. Tuttavia, il valore che fornisce non è definito all'interno di alcun tipo di confine, il che rende quasi impossibile utilizzarlo per qualcosa di diverso dai calcoli di stop loss o take profit. Questo indicatore è il tuo indicatore ATR standard, ma abbiamo introdotto demarcazioni percentili in modo da poter vedere gli estremi. Puoi scegliere tra percentili e qualc
L'esaurimento dell'intervallo si verifica quando il prezzo raggiunge o supera l'intervallo previsto per il periodo corrente. A questi livelli, il prezzo inizia a perdere slancio rispetto all'inizio del periodo, quindi è un buon punto per assicurarsi di non assumere nuove posizioni. Questo indicatore ti mostrerà dove è probabile che ciò accada sul tuo grafico, mostrando i livelli per periodi giornalieri, settimanali e mensili. Quando vedi che il prezzo supera questi livelli di esaurimento, ti sta
Filtro:
Nessuna recensione
Rispondi alla recensione