DYJ Alligator SignalSource
- Indicatori
-
Daying Cao
 Hello!
I am a software engineer has been developing for many years.have their own unique trading system, has a wealth of EA trading experience. The main currency is EUR/USD, GBP/USD. USD/JPY,AUD/USD , USD/CAD, gold, EUR/NZD cross currency. - Versione: 1.2
- Aggiornato: 12 giugno 2026
- Attivazioni: 5
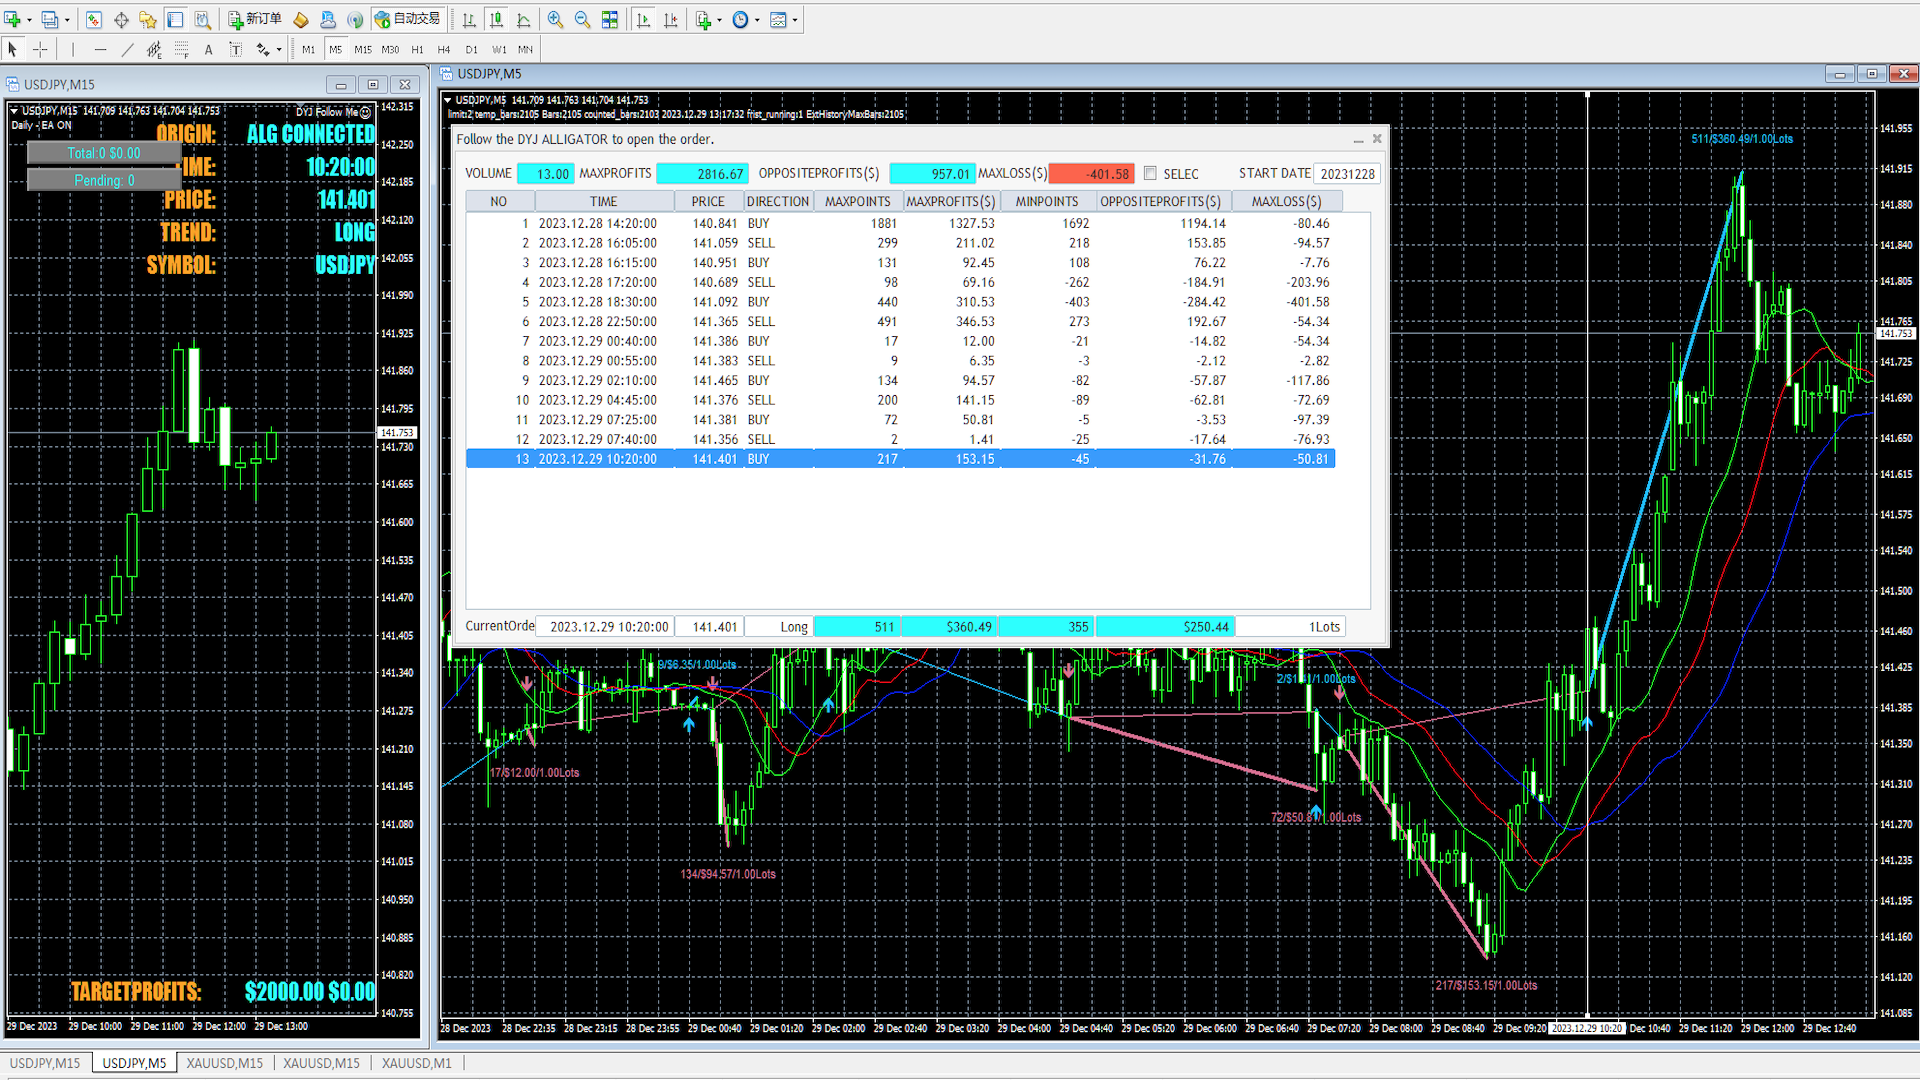
DYJ Alligator SignalSource is based on Alligator indicator. It can be used for any currency pair and timeframe.
The blue line (Alligator's Jaw) is the Balance Line for the timeframe that was used to build the chart (13-period Smoothed Moving Average, moved into the future by 8 bars);
Red Line (Alligator's Teeth) is the Balance Line for the value timeframe of one level lower (8-period Smoothed Moving Average, moved by 5 bars into the future);
Green Line (Alligator's Lips) is the Balance Line for the value timeframe, one more level lower (5-period Smoothed Moving Average, moved by 3 bars into the future).
Market entry condition
BUY: Lips#1 > Teeth#1 and Teeth#1 > Jaws#1
SELL: Lips#1 < Teeth#1 and Teeth#1 < Jaws#1
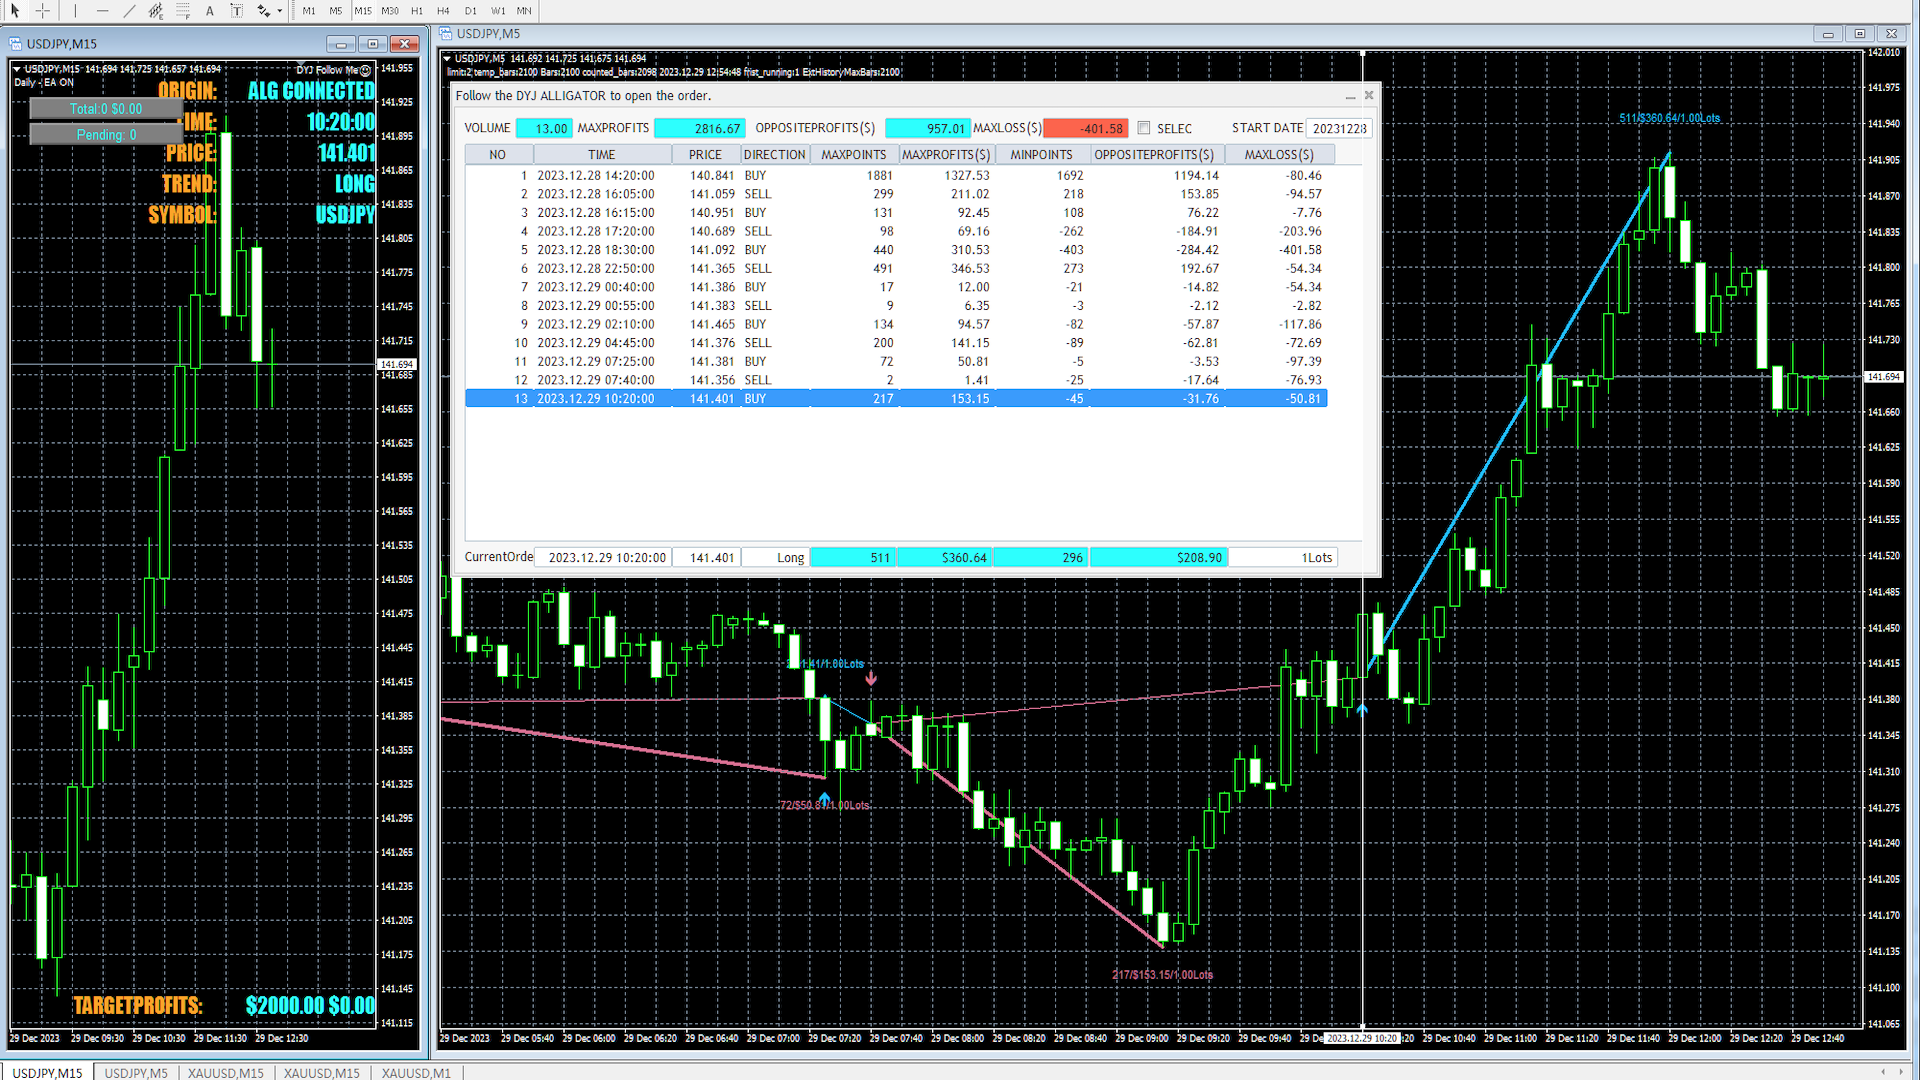
The entry signal of this indicator is a turning point in the trend.The indicator uses analog trading technology,
Provide you with indicators to evaluate the overall profit of the opening signal and closing signal.
It is very convenient for you to use which evaluation mode to trade.
When you choose the maximum profit model evaluation model,
It is recommended that you use the tracking stop loss function.
This can track the trend profit to the maximum extent.
When you select the opposite signal to turn off the evaluation mode,
It is recommended that you wait patiently for the opposite signal to appear and then close it.
This can always wait for the trend to really end and make a profit.
If you need to automatically follow the index to open and close the warehouse, please download the utility software DYJ Follow Me.
Input parameters
[Indicator]
InpShowArrows = true
InpAlertsOn = true
ArrowUpClr = DeepSkyBlue -- Arrow Up Color
ArrowDnClr = PaleVioletRed -- Arrow Down Color
InpIsDisplayIndicatorLine = true -- Display Line Of Indicator
[EstimateProfits]
InpSimulatedVolume = 1 -- SimulatedVolume . 0.01Lots or more
InpOnlyOppositeClosedLine = false -- Only the OppositeClosed line is displayed.
InpIsDisplayChartText = true -- Hide All Text Of Chart
InpIsDisplayProfitsLine = true -- Hide All Line Of Chart
MaxProfitsTextHigh = 40 -- Maximum profit label height
MaxProfitsTextLow = 20 -- Minimum profit label height(opposite)
InpIsEstimateDialog = true -- Hide Or Show EstimateDialog
InpModeProfits = ByMaxProfits -- ByMaxProfits or ByOppositeClosed
InpStartDate = "19700101" -- Statistical start date