Equity Curve MT5 Indicator by PipTick
- Utilità
-
Michal Jurnik
 "Talent is cheaper than table salt. What separates the talented individual from the successful one is a lot of hard work." - Stephen King. Those few words reflect myself very well. I am probably not the most talented developer in the world but I truly believe in hard work, professional attitude and
 - Versione: 1.2
- Aggiornato: 1 dicembre 2021
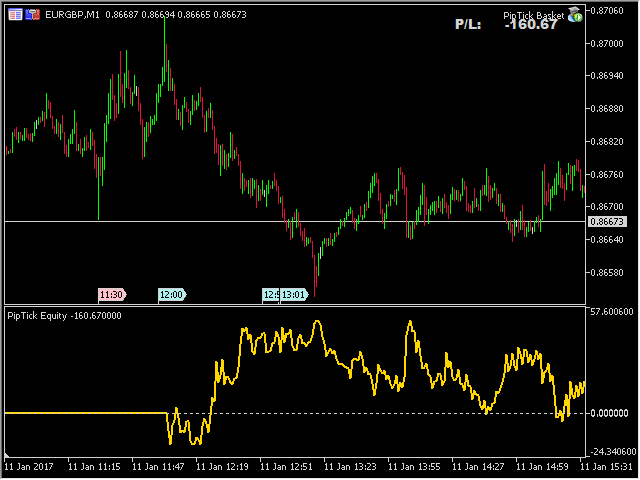
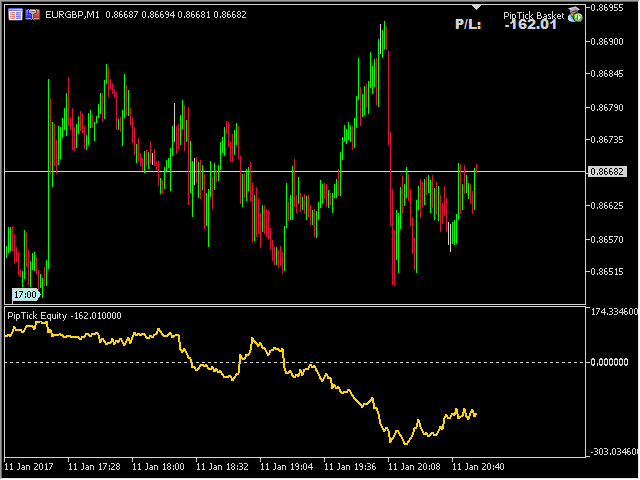
The Equity Curve indicator is a simple and helpful tool that shows the development of the equity curve in real time.
For precision measurement, it should be used in a separate window with a period of M1.
Main features
- The indicator shows the development of the equity curve in real time.
- High precision on the minute chart.
- High-speed calculation.
- Available for MT4 and MT5.

L'utente non ha lasciato alcun commento sulla valutazione.