OHLC Indicator by PipTick MT5
- Indicatori
-
Michal Jurnik
 "Talent is cheaper than table salt. What separates the talented individual from the successful one is a lot of hard work." - Stephen King. Those few words reflect myself very well. I am probably not the most talented developer in the world but I truly believe in hard work, professional attitude and
 - Versione: 1.3
- Aggiornato: 1 dicembre 2021
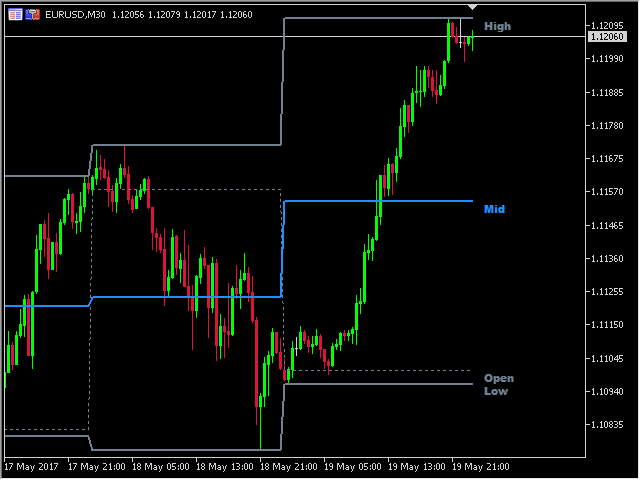
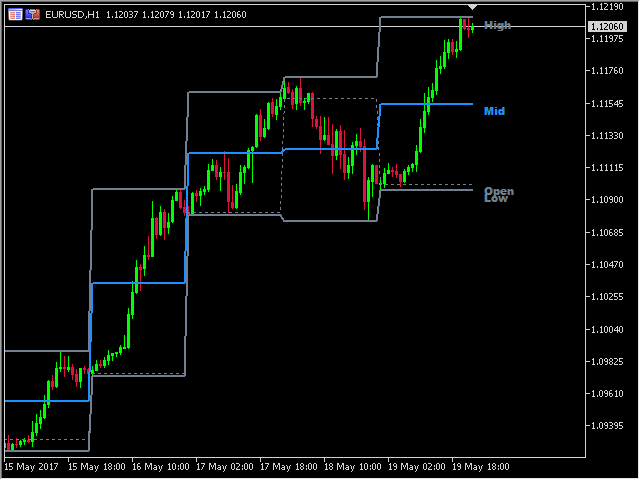
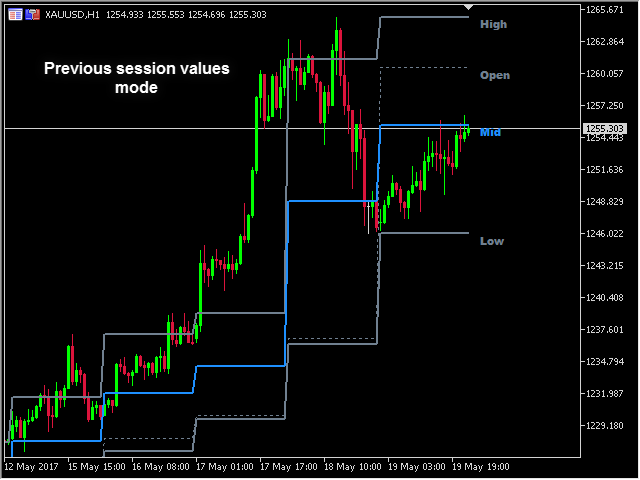
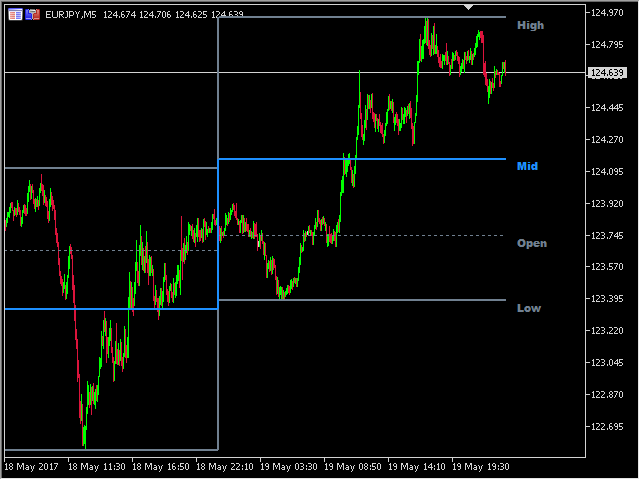
The OHLC indicator shows the current and historical values of High, Low, Open, Close and Mid for a specific time period. It can plot the current values or the values from the previous session. The indicator's range can be calculated from a daily, weekly, monthly, or user-specified session.
Levels
- High of the current or previous session.
- Low of the current or previous session.
- Open of current or previous session.
- Close of the current or previous session.
- Midpoint of the current or previous session.
Recommendations
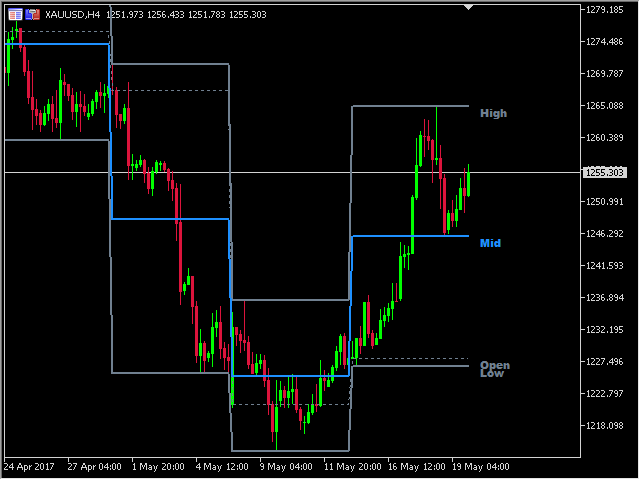
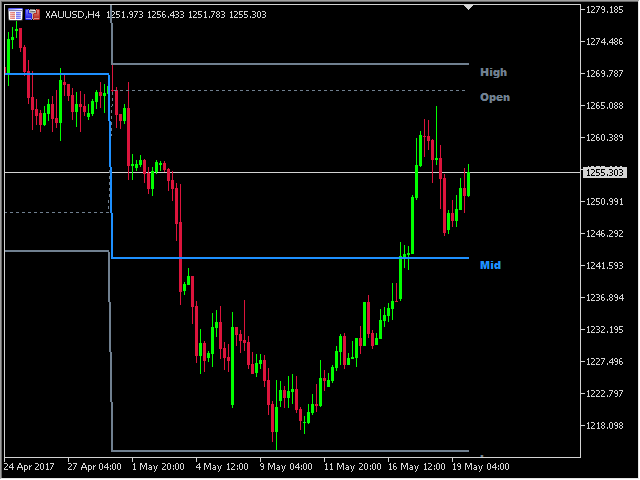
- Using previous session values of High, Low, Close and Mid is beneficial for support and resistance levels. It tends to work very well.
Main features
- The indicator shows the actual levels of High, Low, Open, Close and mid.
- Current or previous session values.
- Alert notifications for indicator lines.
- Custom session time.
- Works on every timeframe (M1, M5, M15, M30, H1, H4, D1, W1, MN).
- The indicator is non-repainting.
- Ready for backtesting.
- Customizable parameters (Colors, Line thickness, Visibility...).
- High-speed calculation.
- Available for MT4 and MT5.
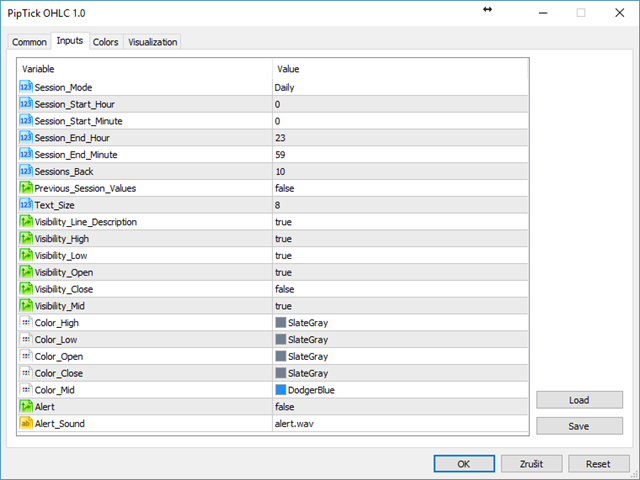
Please visit the OHLC indicator product page for the input and output parameters settings.


Great indicator, Ive set up hi-lo-cl daily, weekly, monthly in colours of my choice no problem.