Mario KLine Platformer

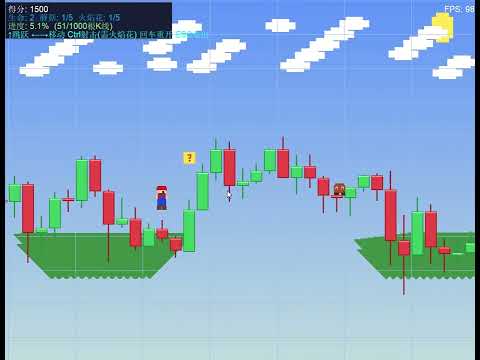
# Mario KLine Platformer - Side-scrolling Candlestick Platformer 🎮📊

`Mario KLine Platformer` is an incredibly creative side-scrolling platformer game for MetaTrader 5 (MT5). this script cleverly merges financial charts with classic Super Mario-style mechanics—**using the real-time candlestick data (OHLC) of the current chart as the level terrain**. Run, jump, and shoot fireballs across market trends in a unique "chart adventure"!

---

## 🌟 Key Concepts & Features

1. **Candlesticks as Playable Terrain (K-Line Terrain)**
   * Upon launch, the game fetches historical candlestick data (Open, High, Low, Close) from the active chart and translates it into grounds and cliffs.
   * Green bull candles and red bear candles form steps of various heights. The tops of the candle bodies serve as the walkable floor. Shadows and high-light borders add retro-style 3D aesthetics to the charts.
   * **Market Trends Dictate Difficulty**: A strong uptrend creates steep "mountains" to climb, while a severe downtrend forms deep "gorges" that require precise jumps to cross.

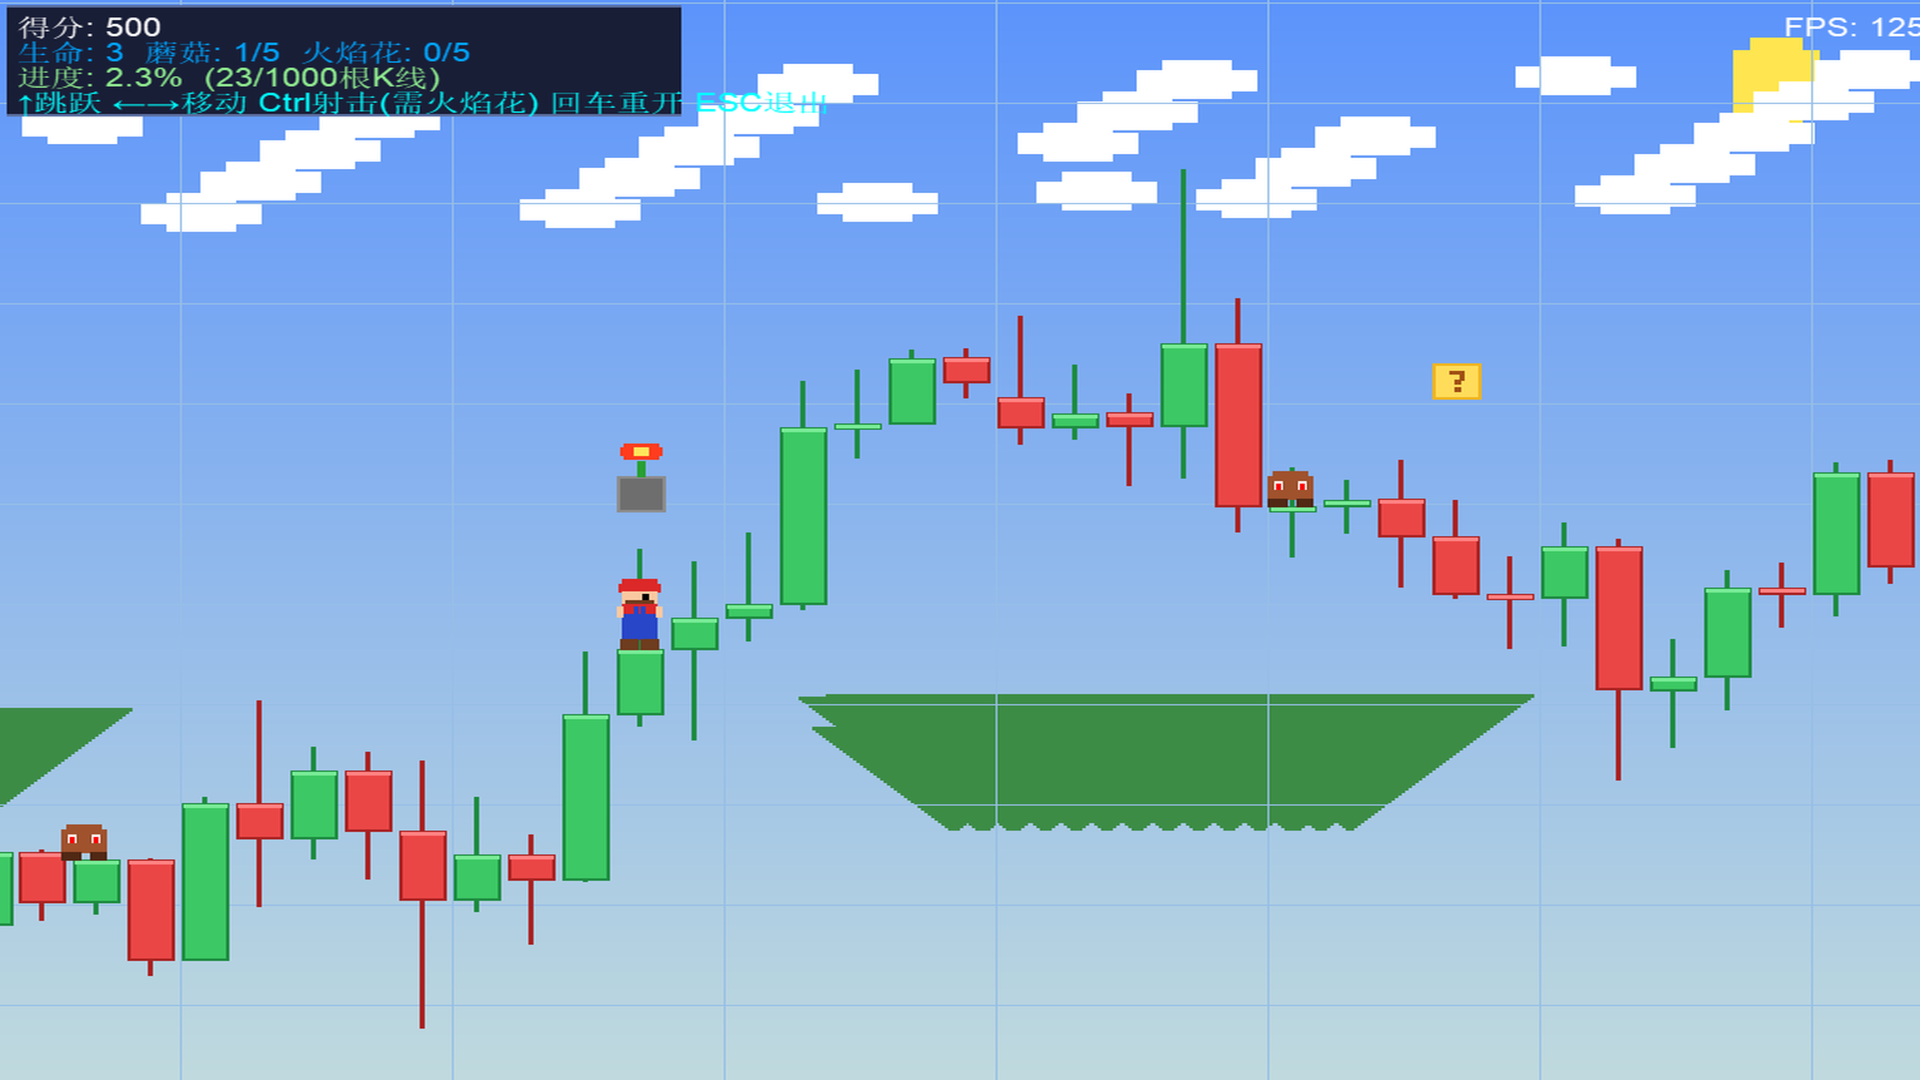
2. **Upgrades & Power-Up System**
   * Hitting the floating golden Question Blocks randomly spawns different power-ups:
     * 🍄 **Super Mushroom**: Enlarges Mario's sprite (up to 40 pixels taller) and upgrades the growth level (up to 5). Each level acts as a shield, absorbing one hit of damage.
     * 🔥 **Fire Flower**: Upgrades Mario's shooting capability up to level 5. Higher levels allow shooting more fireballs simultaneously (multi-directional spread), at faster speeds, and with reduced cooldown.
     * 🪙 **Coins**: Hits the coin blocks to bounce gold coins and immediately gain 200 points.

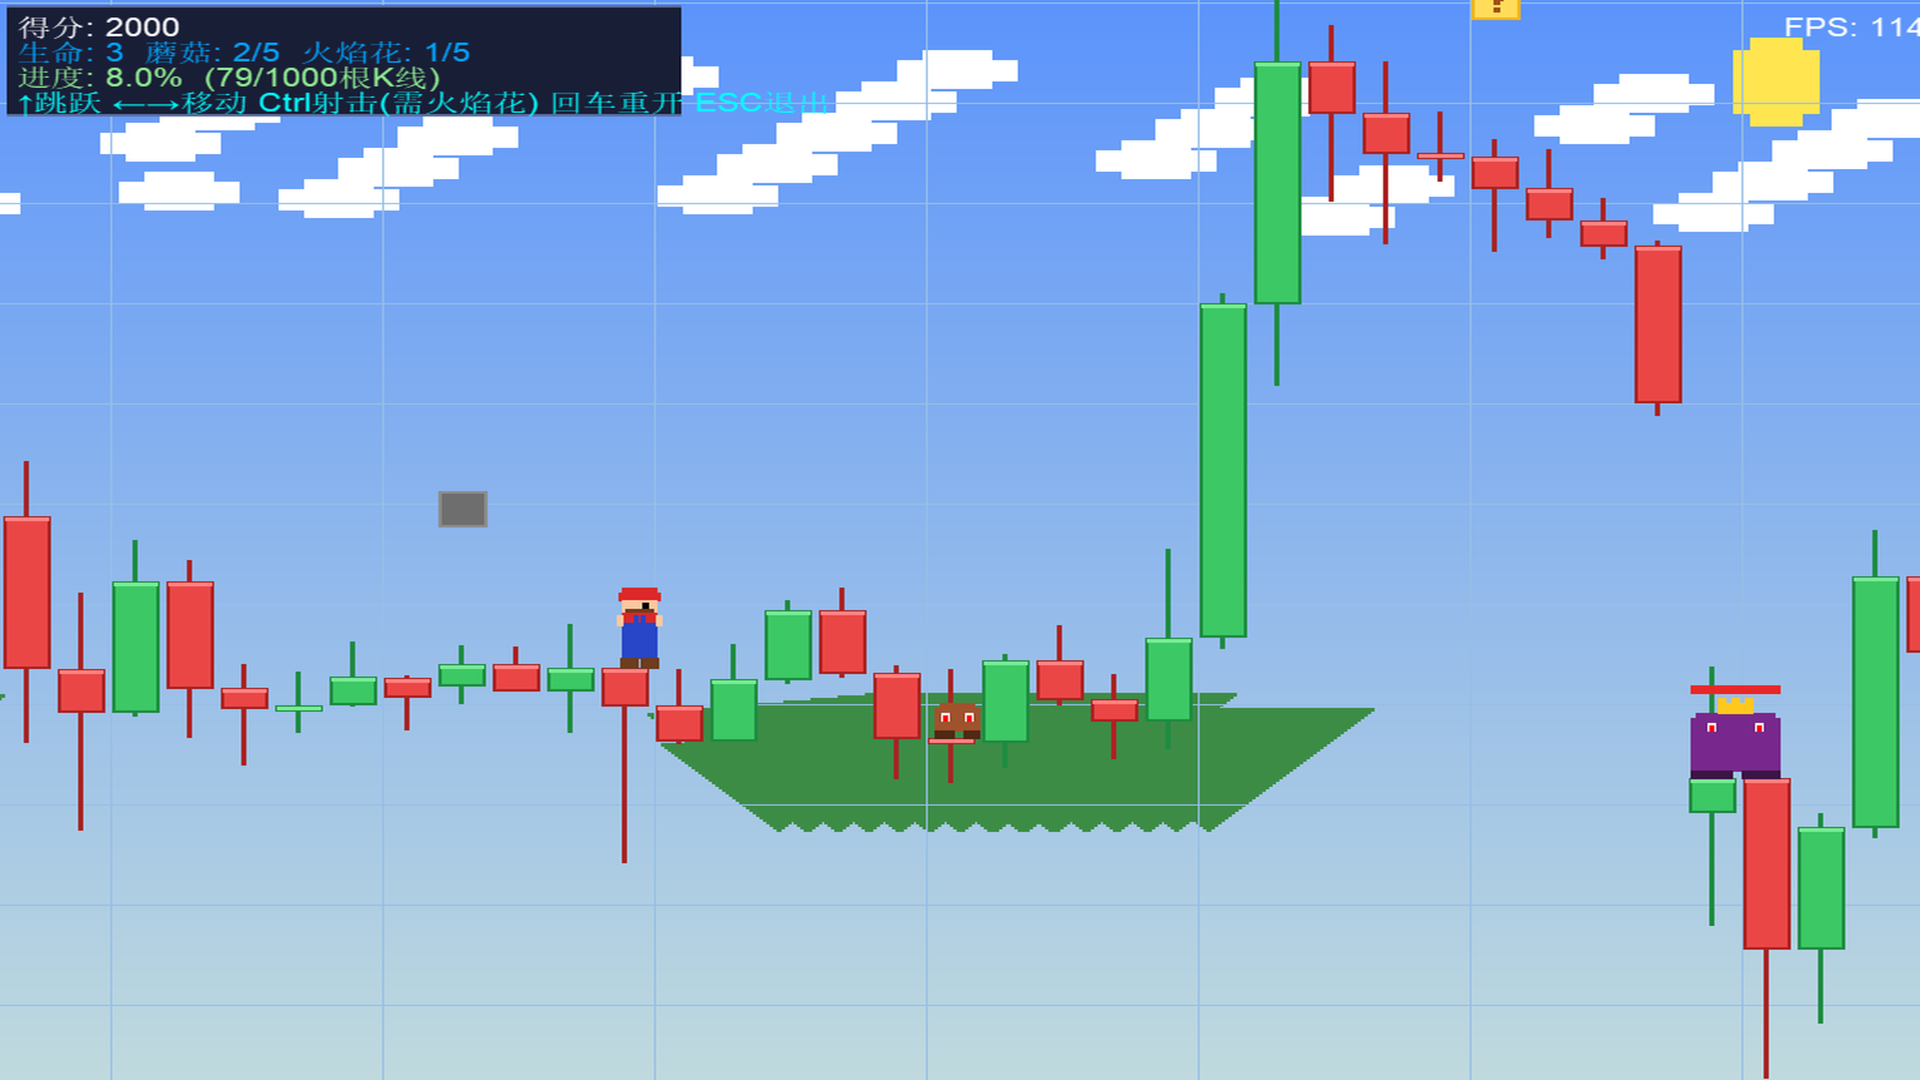
3. **Diverse Enemies & Mini-Boss Encounters**
   * **Goombas (Regular Enemies)**: Patrol between candlestick ledges, jump randomly, and shoot dark-purple energy bullets towards Mario.
   * **Mini-Bosses**: Spawn at parameter-defined intervals of candlesticks. Boasting 5 HP (with a health bar displayed above), golden crowns, and purple armor, they shoot a 3-way spread of projectiles.
   * **Combat Mechanics**: You can eliminate enemies by jumping on top of their heads (instantly kills Goombas, deals 1 damage to Bosses and triggers a high bounce) or by shooting them with fireballs.

4. **Advanced Movement Mechanics**
   * **Step Assist**: Mario automatically steps onto low candle edges, saving you from constant jumping.
   * **Wall Slide & Wall Jump**: When airborne next to a high wall, holding the direction key triggers a slow slide. Pressing the Jump key during a slide performs a Wall Jump off the wall in the opposite direction, allowing you to scale high walls easily.

5. **Built-in 2D Software Rasterizer**
   * The game requires no external GDI dependencies. It utilizes MQL5's raw pixel buffer arrays (`g_image[]`) to draw pixels and shapes (`FillRect`), which are updated inside an `OBJ_BITMAP_LABEL` resource.
   * Immersive background system: Gradient skies, a glowing sun, parallax scrolling clouds (0.3x speed) and far-mountains (0.5x speed), overlayed with trading grid lines.

---

## 🕹️ Controls Guide

* **←** and **→**: Move Mario left and right.
* **↑**: Jump. Press when sliding on a wall to trigger a "Wall Jump".
* **Ctrl (Control)**: Shoot fireballs (Requires Fire Flower level $\ge 1$).
* **Enter**: Restart/Reset the game.
* **ESC**: Exit the game and restore the normal chart view.

---

## 🛠️ Code Architecture

The codebase is clean and follows standard retro game loop designs:

1. **`BuildTerrain()` (Terrain Builder)**
   * Downloads current candlestick OHLC data (up to 10,000 bars) and maps price ranges to screen pixels (a typical candlestick occupies 32 horizontal pixels and roughly 110 vertical pixels).
   * Stores values into `g_highH`, `g_lowH`, `g_bodyTopH`, `g_bodyBotH` arrays.

2. **`SpawnEnemies()` & `SpawnBoxes()` (Scene Generators)**
   * Spawns enemies, bosses, and items based on mathematical distributions across the candlesticks.
   * Generates blocks at 110 pixels above the candle heights.

3. **`UpdateGame(double dt)` (Game State Tick)**
   * Computes player positions, gravity physics, collision with the terrain, and wall slide inputs.
   * Checks block-head-hits, updates power-up movements, and handles item collection.
   * Handles bullet movements, bullet-to-enemy damage, and enemy-to-player collisions.
   * Stage completion: If the player coordinates `g_px` reach the final candlestick, it triggers the victory state (+1,000 points and shows completion message).

4. **`RenderGame()` & `DrawMario()` (Pixel Rasterizer)**
   * Draws sky gradients, shifts parallax mountains and clouds relative to camera `g_camX`.
   * Loops through visible ranges to draw candlesticks, flags, blocks, particles, and health bars.
   * Renders the animated Mario sprite (alternating leg frames for walk cycle) and flashes the sprite during invincibility frames.

---

## ⚙️ Configuration Parameters

Adjust these settings when launching the script:

* **InpMaxBars** (`Candlesticks Count`): Default `1000`. Set the total length of the level (up to 10,000 bars).
* **InpBossBars** (`Boss Interval`): Default `100`. Defines how many candlesticks pass before a Mini-Boss spawns.

---

## 🚀 How to Run

1. Open MetaTrader 5.
2. Select your desired symbol and chart timeframe (e.g., EURUSD, H1).
3. In the "Navigator" window, browse to **Scripts -> My_Scripts -> 3D动画 -> Mario_KLine_Platformer**.
4. Double-click or drag `Mario_KLine_Platformer` onto the chart.
5. Set the level parameters in the dialog box, then click "OK".
6. The chart will be hidden, and the game will begin. Press **ESC** at any time to return to your normal trading chart.

---


Prodotti consigliati
L'indicatore costruisce le quotazioni attuali, che possono essere confrontate con quelle storiche e su questa base fanno una previsione del movimento dei prezzi. L'indicatore ha un campo di testo per una rapida navigazione fino alla data desiderata. Opzioni: Simbolo - selezione del simbolo che visualizzerà l'indicatore; SymbolPeriod - selezione del periodo da cui l'indicatore prenderà i dati; IndicatorColor - colore dell'indicatore; HorisontalShift - spostamento delle virgolette disegnate d
SmartRAL
Jemy Yeferson Dimu Ludji
SmartRAL (Smart Risk Auto-Lot EA) SmartRAL: The Ultimate Risk & Lot Management Expert Advisor (EA) SmartRAL is an essential tool for traders who demand precise risk management and automated position sizing in MetaTrader 5. Stop guessing your lot size and let the algorithm handle the calculations. This EA allows you to trade with confidence by guaranteeing your risk exposure on every single trade, while offering absolute flexibility in setting your Stop Loss (SL). Key Features & Benefits Guarante
This indicator created based on original John Carter's TTM_Squeeze indicator and represents "squeeze" of the market which can be followed (or maybe not) by significant moves. Original indicator prints black dots when Bollinger Bands are inside Kelthner Channels and exactly this implemented in this custom version. Instead of original implementation as momentum indicator MACD indicator with standard settings 12-26-9 is being used. Mainly, the indicator is useful for understanding when it's better
LT Rainbow Trend
Thiago Duarte
5 (1)
== LT RAINBOW TREND - L'INDICATORE DI TREND CON 36 MEDIE MOBILI == PANORAMICA Il LT Rainbow Trend è un indicatore tecnico avanzato per l'analisi dei trend che utilizza 36 Medie Mobili simultanee gestite da un sistema di colori intelligente (Rainbow). Sviluppato per i trader che desiderano operare nella direzione del trend principale con la massima chiarezza visiva, l'indicatore trasforma la complessità dell'analisi multi-timeframe in una visualizzazione semplice, colorata e altamente intuitiva
MrRexo Trade Panel
ARKADIUSZ KROL MULTIPRO
La invitiamo a visitare mrtp.eu per scoprire le funzionalità del pannello. La demo scaricata dal sito offre il 100% delle funzionalità del pannello, ad eccezione dell’apertura e della gestione delle posizioni. MrRexo Trade Panel è una utility multifunzionale on-chart progettata per operazioni di trading manuale in MetaTrader 5. Integra controlli di esecuzione ordini, strumenti di gestione del rischio e overlay tecnici di mercato in un’unica interfaccia. Il pannello è compatibile con account H
ALIEN Dashboard
Youssef Esseghaiar
ALIEN DASHBOARD FULL EDITION – Professional ICT & Precision Trading Dashboard for MT5 ( HYBRID ENGINE ) Overview The   Alien Dashboard Full Edition   is a comprehensive, all‑in‑one technical indicator for MetaTrader 5 that merges the most powerful concepts from Inner Circle Trader (ICT) methodology with advanced precision‑entry logic, multi‑timeframe analysis, and an intuitive on‑chart dashboard. Designed for serious traders who want to visualise institutional order flow, identify high‑probabili
Key Features: 200+ Fully Implemented Patterns   across all categories Advanced Market Structure Analysis Smart Money Integration   (Wyckoff, Order Blocks, Liquidity) Professional Risk Management Multi-Timeframe Analysis AI-Powered Confidence Scoring Advanced Visualization Real-time Alerts Pattern Categories: Single Candle Patterns (Hammer, Doji, Marubozu, etc.) Multi-Candle Patterns (Engulfing, Stars, Harami, etc.) Chart Patterns (Head & Shoulders, Cup & Handle, Triangles, etc.) Harmonic Pattern
FREE
Ping
Vagif Shabanov
Ping: il tuo strumento indispensabile per un trading affidabile Il tuo provider internet e il tuo VPS promettono una connessione stabile, ma puoi davvero fidarti? In un mondo in cui ogni millisecondo conta, una connessione lenta o instabile può tradursi in profitti mancati o perdite. Lo script Ping ti permette di: Prendere decisioni informate: confronta visivamente la velocità di diversi server VPS e broker per scegliere la connessione più veloce e affidabile per la tua strategia di trading. Eli
Il livello Premium è un indicatore unico con una precisione superiore all'80% delle previsioni corrette! Questo indicatore è stato testato dai migliori Specialisti di Trading per più di due mesi! L'indicatore dell'autore che non troverai da nessun'altra parte! Dagli screenshot puoi vedere di persona la precisione di questo strumento! 1 è ottimo per il trading di opzioni binarie con un tempo di scadenza di 1 candela. 2 funziona su tutte le coppie di valute, azioni, materie prime, criptovalu
Italian Questo indicatore funge da assistente avanzato per l'analisi dei grafici per i trader che amano operare con i Pattern Grafici (Chart Patterns). È progettato per ridurre il carico dell'analisi visiva e aumentare la precisione nell'ottenere profitti. Caratteristiche principali di questo indicatore dal punto di vista dell'utilizzo pratico: 1. Rilevamento automatico dei pattern (Automated Pattern Detection) Risparmia tempo e riduce le distorsioni (Bias): Non è necessario tracciare manualment
Fastest Trades Copier is the fastest and most lightweight trade copier between MT5 accounts available on the market. Running entirely through the MT5 Common Folder — no DLLs, no external servers, no internet dependency — it copies your trades between two terminals on the same VPS or PC with near-zero latency, polling every 500ms with minimal CPU footprint. Key Features: Ultra-fast local copy via MT5 Common Folder Configurable symbol name translation between brokers (e.g. USDJPY.sc → USDJPY)
My products:   https://www.mql5.com/ru/users/astra077/seller In the product line: Candlestick Pattern Detector   — a free basic version. Candlestick Patterns Standard   — a paid single-chart version with extended patterns and filters:  https://www.mql5.com/ru/market/product/174530 Japanese Candlestick Patterns Pro MT5   — a professional single-chart version with a summary table:  https://www.mql5.com/ru/market/product/173411 Multi-Currency Candlestick Pattern Scanner   — the ultimate version: a
##   ONLY GOLD ##   Тiльки Золото ## **Mercaria Professional Trading Zones - Complete Guide** ## **Mercaria Professional Trading Zones - Повний посібник** ### **How Mercaria Zones Work / Як працюють зони Mercaria** **English:** Mercaria Zones is an advanced trading indicator that identifies high-probability support and resistance areas using ZigZag extremes combined with mathematical zone calculations. The indicator works on multiple timeframes simultaneously, providing a comprehensive view
Trading Advanced Panel - Professional Trading Panel for MT5 Transform Your Trading into a More Professional Experience Trading Advanced Panel is the ultimate control panel for traders seeking precision, agility, simplicity, and professional risk management. Developed with the best management experiences from top-tier platforms, this EA revolutionizes how you trade on MetaTrader 5. KEY FEATURES Real-Time Monitoring Position value updated every second - See the exact financial value of your trad
Order Book, known also as Market Book, market depth, Level 2, - is a dynamically updated table with current volumes of orders to buy and to sell specific financial instument at price levels near Bid and Ask. MetaTrader 5 provides the means for receiving market book from your broker, but in real time only, without access to its history. The indicator OrderBook Cumulative Indicator accumulates market book data online and visualizes them on the chart. In addition, the indicator can show the market
Lot calculator tool MT5
Ernestas Kvedaras
3.67 (3)
More stable MetaTrader 4 version is available here:  Lot Calculator Tool . This tool helps you to automatically calculate and manage risk, conveniently place orders visually, schedule orders, trail stops, move them to break-even and more. Features Place market or pending orders using draggable lines Schedule orders Calculate and limit risk using various methods See current spread See time till next candle Set custom order comments Trail stops Move stops to break-even See order profit/loss in p
SolarTrade Suite Financial Robot: LaunchPad Market Expert - progettato per aprire le negoziazioni! Questo è un robot di trading che utilizza speciali algoritmi innovativi e avanzati per calcolare i suoi valori, il tuo assistente nel mondo dei mercati finanziari. Utilizza il nostro set di indicatori della serie SolarTrade Suite per scegliere meglio il momento in cui lanciare questo robot. Dai un'occhiata agli altri nostri prodotti della serie SolarTrade Suite in fondo alla descrizione. Vuoi n
CosmiCLab SMC FIBO CosmiCLab SMC FIBO is a professional trading indicator designed for traders who use Smart Money Concepts (SMC), market structure analysis and Fibonacci retracement levels. The indicator automatically detects market swings and builds Fibonacci levels based on the latest impulse movement. It also identifies market structure changes such as BOS (Break of Structure) and CHOCH (Change of Character), helping traders understand the current market direction. CosmiCLab SMC FIBO also pr
Fvg Edge
Ahmad Meftah Abdulsalam Alawwami
5 (3)
FVG Smart Zones – Edizione Gratuita Indicatore di Rilevamento dei Gap di Valore Equo per MetaTrader 5 (MT5) Cerchi uno strumento di trading reale – non solo un altro indicatore casuale? FVG Smart Zones – Edizione Gratuita fornisce una visione professionale del mercato rilevando automaticamente i Fair Value Gap (FVG) e evidenziando zone di trading ad alta probabilità direttamente sul grafico. Ideato per trader che seguono: Smart Money Concepts (SMC) ICT Trading Concepts Price Action
FREE
Utility per la gestione automatica degli ordini e dei rischi. Ti permette di trarre il massimo dai profitti e limitare le tue perdite. Creato da un trader praticante per i trader. L'utilità è facile da usare, funziona con qualsiasi ordine di mercato aperto manualmente da un trader o con l'aiuto di consulenti. Può filtrare gli scambi per numero magico. L'utilità può funzionare con qualsiasi numero di ordini contemporaneamente. Ha le seguenti funzioni: 1. Impostazione dei livelli di stop loss
DAILY OH/OL SDEV QUANT MODEL - STATISTICAL TRADING WITH PRECISION RISK MANAGEMENT TRADE WITH MATHEMATICAL CERTAINTY - KNOW YOUR EXACT STOP-LOSS AND TAKE-PROFIT BEFORE YOU ENTER This indicator analyzes 5,000+ days of price history to give you: Exact entry levels (sigma bands locked at daily open) Exact stop-loss distance (from M
Price Magnet — Price Density and Attraction Levels Indicator Price Magnet is a professional analytical tool designed to identify key support and resistance levels based on statistical Price Density. The indicator analyzes a specified historical period and detects price levels where the market spent the most time. These zones act as “magnets,” attracting price action or forming a structural base for potential reversals. Unlike traditional Volume Profile tools, Price Magnet focuses on price-time d
Crash300 Pro Trader è un Expert Advisor (EA) completamente automatizzato progettato per operare sull’indice Crash 300 utilizzando una combinazione di rilevamento del trend, filtro RSI e gestione delle operazioni basata su logica di recupero. L’EA identifica la direzione del mercato tramite il Parabolic SAR sul timeframe giornaliero (D1) ed esegue operazioni solo nella direzione del trend. Per migliorare la precisione degli ingressi, utilizza un filtro RSI per evitare falsi segnali nelle zone d
Overview Harmonic Patterns MT5 is a technical analysis indicator designed for the MetaTrader 5 platform. It identifies and displays harmonic price patterns, such as Butterfly, Cypher, Crab, Bat, Shark, and Gartley, in both bullish and bearish directions. The indicator calculates key price levels, including entry, stop loss, and three take-profit levels, to assist traders in analyzing market movements. Visual elements and customizable alerts enhance usability on the chart. Features Detects six ha
L'indicateur SMC Venom Model BPR est un outil professionnel pour les traders travaillant dans le concept Smart Money (SMC). Il identifie automatiquement deux modèles clés sur le graphique des prix: FVG   (Fair Value Gap) est une combinaison de trois bougies, dans laquelle il y a un écart entre la première et la troisième bougie. Forme une zone entre les niveaux où il n'y a pas de support de volume, ce qui conduit souvent à une correction des prix. BPR   (Balanced Price Range) est une combinaiso
TradeForge AlphaGain AI
Akshay Chunilal Patil
AlphaGain AI – Trading preciso con intelligenza artificiale avanzata AlphaGain AI è un Expert Advisor (EA) per MetaTrader 5 ad alte prestazioni, alimentato da AI e dati storici per generare segnali di qualità, adatti a trader che desiderano risultati costanti e automatizzati. Caratteristiche principali: Motore IA: rileva configurazioni candlestick, zone di volatilità, logica di momentum; Addestrato su oltre 10 anni di dati; Strategia dinamica di entrata/uscita: SL/TP, trailing stop, pun
Adaptive Vertical Chart Scaling Forget about constantly adjusting your chart manually! The market moves — your chart should adapt automatically. ScaleFix Smart Auto Scaling is an intelligent utility for MetaTrader 5 that automatically keeps price action within a comfortable viewing zone: • upper extremes — with approximately 10% spacing from the top border; • lower extremes — with approximately 10% spacing from the bottom border. Your chart always looks clean, professional, and easy to read — re
World Session Zone Clock for MetaTrader 5 (MT5) *NO DEMO VERSION AVAILABLE* World Session Clock is a professional market session clock for MetaTrader 5 that visually displays global trading sessions in real time . It helps traders quickly identify market opens, closes, and session overlaps without manual time calculations or time-zone adjustments. The product combines a 24-hour analog clock , digital time display , session arcs , and optional chart session zones into a clean, lightweight interf
Gino Renko EA
Stephane, Andr Valette
Here is an EA based on the Renko indicator, it can be used with currencies, commodities, and forex. Just associate it with the corresponding graph. The indicator used for the EA is available here, but it is not necessary for its operation, they are 2 independent products: https://www.mql5.com/fr/market/product/87852?source=Site +Market+MT5+Indicator+Search+Rating006%3agino+renko Personally I don't like renko like EA, and I haven't done any tests to find out which configuration is the best. Th
Noize Absorption Index - is the manual trading system that measures the difference of pressure between bears forces and bulls forces. Green line - is a noize free index that showing curent situation. Zero value of index shows totally choppy/flat market.Values above zero level shows how powerfull bullish wave is and values below zero measures bearish forces.Up arrow appears on bearish market when it's ready to reverse, dn arrow appears on weak bullish market, as a result of reverse expectation.
Gli utenti di questo prodotto hanno anche acquistato
Trade Assistant MT5
Evgeniy Kravchenko
4.43 (211)
It helps to calculate the risk per trade, the easy installation of a new order, order management with partial closing functions, trailing stop of 7 types and other useful functions. Additional materials and instructions Installation instructions - Application instructions - Trial version of the application for a demo account Line function -   shows on the chart the Opening line, Stop Loss, Take Profit. With this function it is easy to set a new order and see its additional characteristics bef
Forex Trade Manager MT5
InvestSoft
4.98 (661)
Benvenuto a Trade Manager EA, lo strumento definitivo per la gestione del rischio , progettato per rendere il trading più intuitivo, preciso ed efficiente. Non è solo uno strumento per l'esecuzione degli ordini, ma una soluzione completa per la pianificazione delle operazioni, la gestione delle posizioni e il controllo del rischio. Che tu sia un principiante, un trader avanzato o uno scalper che necessita di esecuzioni rapide, Trade Manager EA si adatta alle tue esigenze, offrendo flessibilità s
Local Trade Copier EA MT5
Juvenille Emperor Limited
4.96 (139)
Sperimenta una copia di trading eccezionalmente veloce con il   Local Trade Copier EA MT5 . Con la sua facile configurazione in 1 minuto, questo copiatore di trading ti consente di copiare i trades tra diversi terminali di MetaTrader sullo stesso computer Windows o su Windows VPS con velocità di copia ultra veloci inferiori a 0.5 secondi. Che tu sia un trader principiante o professionista,   Local Trade Copier EA MT5   offre una vasta gamma di opzioni per personalizzarlo alle tue esigenze speci
Versione Beta Telegram to MT5 Signal Trader è quasi pronto per il rilascio ufficiale in versione alpha. Alcune funzionalità sono ancora in fase di sviluppo e potresti riscontrare piccoli bug. Se riscontri problemi, ti preghiamo di segnalarli, il tuo feedback aiuta a migliorare il software per tutti. Telegram to MT5 Signal Trader è uno strumento potente che copia automaticamente segnali di trading da canali o gruppi Telegram al tuo account MetaTrader 5 . Supporta canali pubblici e privati e cons
TradePanel MT5
Alfiya Fazylova
4.87 (157)
Trade Panel è un assistente commerciale multifunzionale. L'applicazione contiene più di 50 funzioni di trading per il trading manuale e permette di automatizzare la maggior parte delle attività commerciali. Prima dell'acquisto, è possibile testare la versione dimostrativa su un conto demo. Scaricare la versione di prova dell'applicazione per un account dimostrativo: https://www.mql5.com/it/blogs/post/762419 . Istruzioni complete qui . Commercio. Consente di effettuare operazioni di trading con u
Quant AI Agents
Ho Tuan Thang
5 (1)
Quant AI Agents are independent trading Expert Advisors. Instead of trading using a fixed strategy like other conventional EAs, Quant AI Agents   is a   multi-agent AI trading framework   that turns natural-language strategy prompts into live.  WANT THE SAME RESULTS AS MY LIVE SIGNAL?   Use the exact same brokers I do:   IC MARKETS , IC TRADING   .  Unlike the centralized stock market, Forex has no single, unified price feed.  Every broker sources liquidity from different providers, creating un
Trade Dashboard MT5
Fatemeh Ameri
4.95 (129)
Trade Dashboard simplifies how you open, manage, and control your trades, with built-in lot size calculation. It allows you to execute trades, manage risk, and control positions directly on the chart, with tools such as partial close, breakeven, and trailing stop. Designed to reduce manual work and help you stay focused on your trading decisions. A demo version is available for testing. Detailed explanations of features are provided within the MQL5 platform. Installation instructions are include
AI Agents Supervisor
Ho Tuan Thang
5 (1)
AI Agent Supervisor is NOT an Expert Advisor. AI Agent Supervisor   is a   multi-agent AI risk & portfolio supervisor   that watches every EA on your account and intervenes in real time.  WANT AN AI PORTFOLIO MANAGER WATCHING YOUR FLEET 24/7?   Run your fleet on the same brokers I do:   IC MARKETS , IC TRADING   .  Unlike the centralized stock market, Forex has no single, unified price feed.  Every broker sources liquidity from different providers, creating unique data streams. The Supervisor r
Power Candles Strategy Scanner - Strumento di ricerca configurazioni multi-simbolo con ottimizzazione automatica Power Candles Strategy Scanner utilizza lo stesso motore di auto-ottimizzazione che alimenta l'indicatore Power Candles, applicandolo a tutti i simboli presenti nel tuo Market Watch, uno accanto all'altro. Un unico pannello ti indica quali simboli sono statisticamente negoziabili in questo momento, quale strategia è vincente su ciascuno di essi, la coppia ottimale di Stop Loss / Take
Exp COPYLOT CLIENT for MT5
Vladislav Andruschenko
3.91 (33)
Copiatore professionale di trade per MetaTrader 5 Un copiatore di trade veloce, professionale e affidabile per MetaTrader . COPYLOT consente di copiare operazioni Forex tra terminali MT4 e MT5 con supporto per conti Hedge e Netting . La versione MT5 di COPYLOT supporta: - MT5 Hedge → MT5 Hedge - MT5 Hedge → MT5 Netting - MT5 Netting → MT5 Hedge - MT5 Netting → MT5 Netting - MT4 → MT5 Hedge - MT4 → MT5 Netting Versione MT4 Descrizione completa + DEMO + PDF Come acquistare Come installare Come ot
Premium Trade Manager - Gestione dei trade rapida e disciplinata per MetaTrader 5 Premium Trade Manager è per i trader che vogliono tenere il focus sulla decisione mentre il pannello gestisce la routine: dimensionamento, piazzamento, parziali, trailing, news e limiti prop-firm, gestiti con la stessa disciplina su ogni trade. È un pannello rapido sul grafico per MetaTrader 5 che si occupa di tutto il lavoro meccanico in ogni trade. Decidi tu direzione, simbolo e momento; il pannello calcola la di
Footprint Chart Pro — Professional OrderFlow EA for MetaTrader 5 Version 6.34 | Professional tool for real traders | Institutional-Grade Visualization DEMO USERS - PLEASE SELECT EVERY TICK / REAL TICK WHEN TESTING AND YOU HAVE DOWNLOADED HISTORICAL DATA. IF YOU SEE A WAITING SCREEN AND IT IS NOT DOWNLOADING, IT MEANS YOU HAVE LOW HISTORICAL DATA. TRY 1 MIN AND 5 MIN FIRST ON 1 DAY DATA. ONE DAY DATA SHOULD BE THE NEWEST AND MOST CURRENT DATE. PLEASE WAIT UNTIL THE MARKET HAS ROLLED OVER PERIOD.
FarmedHedge Pair Trading Dashboard
Tanapisit Tepawarapruek
5 (3)
Farmed Hedge Yield Farming | All Markets (Manual - Hybrid - Semi/Automated EA) MULTI-ASSET SUPPORT Trade any asset available on your broker - Forex: Major, Minor, Exotic pairs - Crypto: BTC, ETH, XRP, SOL, BNB - Stocks: Apple, Tesla, Amazon, Google, etc. - Commodities: Gold, Silver, Oil, Gas - Indices: US30, NAS100, SPX500, DAX40 - Any CFD your broker offers VERIFIED TRADING RESULTS - Farmed Hedge Yield Axi Copy:  https://www.mql5.com/en/signals/2356376 - Farmed Hedge Yield Exn Copy:   https:/
Timeless Charts
Samuel Manoel De Souza
5 (6)
Timeless Charts è un'utilità di trading completa progettata per trader professionisti. Combina tipi di grafici personalizzati come Grafici a Secondi e Renko con analisi avanzata del flusso ordini tramite Footprints , Clusters , Profili di Volume , studi VWAP e strumenti di analisi ancorata per una visione più approfondita del mercato. Il trading e la gestione delle posizioni vengono eseguiti direttamente dal grafico tramite un pannello integrato di gestione delle operazioni , mentre Market Repla
================================================================================ POC BREAKOUT - V20.72. Full Professional Grade Toolkit ================================================================================ POC Breakout is a full MetaTrader 5 trading dashboard for discretionary traders who want breakout signals, Point of Control (POC) context, volume profiles, order flow, market structure, news, alerts, and advanced trade planning in one professional workspace. Attached directly to you
The product will copy all telegram signal to MT5 ( which you are member) , also it can work as remote copier.  Easy to set up, copy order instant, can work with almost signal formats, image signal,  s upport to translate other language to English Work with all type of channel or group, even channel have "Restrict Saving Content", work with  multi channel, multi MT5 Work as remote copier: with signal have ticket number, it will copy exactly via ticket number. Support to backtest signal. How to s
Trade copier MT5
Alfiya Fazylova
4.56 (45)
Trade Copier è un'utilità professionale progettata per copiare e sincronizzare le transazioni tra conti di trading. La copiatura avviene dal conto/terminale del fornitore al conto/terminale del destinatario, che sono installati sullo stesso computer o vps. PROMOZIONE - Se avete già acquistato il "Trade copier MT5", potete ottenere gratuitamente il "Trade copier MT4" (per la copia MT4 > MT5 e MT4 < MT5). Per maggiori informazioni sulle condizioni, vi preghiamo di contattarci tramite messaggi priv
AntiOverfit PRO MT5
Enrique Enguix
5 (6)
Prima di comprare un EA, verifica se regge davvero oppure se in backtest è sembrato forte solo per fortuna. La maggior parte dei robot viene venduta con un backtest bello da vedere. Curva in crescita. Buon profit factor. Pochi dubbi. Eppure molti di questi EA crollano non appena il mercato smette di muoversi come in quello storico. Perché? Perché un backtest dimostra una cosa sola: che quella strategia ha funzionato su un percorso di prezzo ben preciso. Non dimostra che reggerà su percorsi diver
Custom Alerts AIO: Monitora tutti i mercati — senza alcuna configurazione Panoramica Custom Alerts AIO è una soluzione di monitoraggio dei mercati pronta all’uso che non richiede alcuna configurazione. Tutti gli indicatori necessari — FX Power, FX Volume, FX Dynamic, FX Levels, IX Power — sono integrati internamente. Non vengono mostrati grafici, rendendolo ideale per generare alert in tempo reale in modo discreto ed efficiente. Supporta tutte le classi di asset offerte dal tuo broker: Forex,
The News Filter MT5
Leolouiski Gan
4.78 (23)
Questo prodotto filtra tutti gli esperti consulenti e i grafici manuali durante il periodo delle notizie, così non dovrai preoccuparti di improvvisi picchi di prezzo che potrebbero distruggere le tue impostazioni di trading manuali o le negoziazioni effettuate da altri esperti consulenti. Questo prodotto viene fornito anche con un sistema completo di gestione degli ordini che può gestire le tue posizioni aperte e gli ordini in sospeso prima della pubblicazione di qualsiasi notizia. Una volta che
Seconds Chart MT5
Boris Sedov
4.59 (17)
Seconds Chart - uno strumento unico per creare grafici in secondi su MetaTrader 5 . Con Seconds Chart , puoi generare grafici con timeframe definiti in secondi, ottenendo una flessibilità e una precisione d'analisi ideali, non disponibili nei grafici standard in minuti o ore. Ad esempio, il timeframe S15 indica un grafico con candele di 15 secondi. Puoi utilizzare qualsiasi indicatore e Expert Advisor con supporto per simboli personalizzati. Lavorare con loro è comodo quanto operare sui grafici
Copy Cat More Trade Copier MT5 (Gatto Copiatore MT5) è un copiatore di trade locale e un framework completo di gestione del rischio ed esecuzione progettato per le sfide di trading odierne. Dalle sfide delle prop firm alla gestione di portafogli personali, si adatta a ogni situazione con una combinazione di esecuzione robusta, protezione del capitale, configurazione flessibile e gestione avanzata dei trade. Il copiatore funziona sia in modalità Master (mittente) che Slave (ricevente), con sincro
Prop Firm Os
Gayathiri Gopalakrishnan
5 (1)
PROP FIRM OS Structured Trading Assistant for MetaTrader 5 PROP FIRM OS is a structured trading assistant designed for MetaTrader 5 users who prefer rule-based market analysis and organized trading workflows. The Expert Advisor combines market analysis tools, scanner functions, dashboard monitoring, alerts, risk-control settings, and trade management features inside one system. PROP FIRM OS is designed to help traders follow selected rules, filters, and monitoring conditions during trading activ
MT5 to Telegram Signal Provider è un'utilità facile da usare e completamente personalizzabile che consente l'invio di segnali specificati a una chat, canale o gruppo Telegram, rendendo il tuo account un fornitore di segnali. A differenza della maggior parte dei prodotti concorrenti, non utilizza importazioni DLL. [ Dimostrativo ] [ Manuale ] [ Versione MT4 ] [ Versione Discord ] [ Canale Telegram ]  New: [ Telegram To MT5 ] Configurazione Una guida utente passo-passo è disponibile. Nessuna cono
EA Portfolio Analyzer
Jimmy Peter Eriksson
4 (1)
Guida all'installazione:    clicca qui! Analizzare più consulenti esperti insieme Confronta i risultati EA per numero magico Traccia la redditività e i ribassi Filtra i risultati per intervallo di date Curva di equità visiva e metriche dettagliate Pronto all'uso in meno di un minuto Analizzatore di portafoglio EA EA Portfolio Analyzer è uno   strumento di analisi professionale   progettato per monitorare   in tempo reale le prestazioni di più Expert Advisor   in modo chiaro e strutturato. Quand
Take a Break MT5
Eric Emmrich
4.75 (24)
News filter, equity guard & session control for all your EAs — one tool, full protection — Free Demo | Latest Updates Take a Break has evolved from a basic news filter into a comprehensive account protection solution . It pauses your other Expert Advisors during news events or based on custom filters. When trading resumes, it automatically restores your entire chart setup , including all EA settings. New in v10: an integrated AI Trade Assessment evaluates each new trade entry directly on your ch
HINN MagicEntry Extra
ALGOFLOW OÜ
4.73 (15)
HINN MAGIC ENTRY – the ultimate tool for entry and position management! Place orders by selecting a level directly on the chart! full description   ::  demo-version  :: 60-sec-video-description Key features: - Market, limit, and pending orders - Automatic lot size calculation - Automatic spread and commission accounting - Unlimited partitial take-profits  - Breakeven and trailing stop-loss and take-profit  functions - Invalidation leves - Intuitive, adaptive, and customizable interface - Works
SMC Trade Pilot MT5
Prime Horizon
5 (1)
SMC Trade Pilot MT5 Assistente di trading semi-automatico per trader Smart Money Concepts. Ricevi segnali su Telegram con screenshot del grafico, poi piazza il trade con un singolo tap. Gestisci le tue posizioni dal telefono, anche lontano dal computer. Il problema che risolve I setup Smart Money non aspettano. Order Blocks e Liquidity Sweeps si formano durante l'apertura di Londra, di New York o nel mezzo della sessione asiatica, spesso quando sei al lavoro, in riunione o lontano dallo schermo.
YuClusters
Yury Kulikov
4.93 (42)
Attention: You can view the program operation in the free version  YuClusters DEMO .  YuClusters is a professional market analysis system. The trader has unique opportunities to analyze the flow of orders, trade volumes, price movements using various charts, profiles, indicators, and graphical objects. YuClusters operates on data based on Time&Sales or ticks information, depending on what is available in the quotes of a financial instrument. YuClusters allows you to build graphs by combining da
VirtualTradePad One Click Trading Panel
Vladislav Andruschenko
4.59 (74)
Pannello di trading per MetaTrader 5 — controllo professionale del trading in un clic dal grafico e dalla tastiera Un pannello di trading avanzato progettato per trader attivi, pensato per aprire, gestire e chiudere operazioni molto più velocemente rispetto all’interfaccia standard di MetaTrader. Questa soluzione è dedicata a chi desidera controllare posizioni, ordini pendenti, profitto totale ed esecuzione da un unico spazio di lavoro professionale. Non si tratta di un semplice utilitario. È u
Altri dall’autore
1. Why did I develop this series of indicators I found that most traders need to use multiple time frame indicators. They usually switch time frame to see indicators. However, once the timeframe is switched, you cannot see the  corresponding relationship  between  the price in the smaller timeframe  and  the indicator in the larger timeframe . For example: if your price chart is in H1 timeframe, you can see H4, D1 and W1 indicators in H1 timeframe Chart. This is more helpful for you to find th
This product can be used to synchronize multiple Charts, and each Chart can be set to a different sync mode. With this product you can better view and manipulate charts: different time frames for a single Symbol, the same time frame for multiple Symbols... and more. PS: The link below is the FreeDemo product, you can use it on EURUSD/XUAUSD/USDCNH symbol: https://www.mql5.com/en/market/product/38557 Feature: Chart settings  can be synchronized, including : background, indentation, size, etc. M
Do you think it's a bit cumbersome when you need to switch symbols or timeframes with mouse click? 1. What is this? This is a program that can switch symbols and timeframes with direction keys. Fast switching, very convenient, no mouse click required. For traders, one symbol with multi-timeframe charts are usually added,  you can change symbol on those charts easily. For multi-currency traders, different symbol charts are usually added, you can also change those timeframes easily. I wrote this p
1. What is this         Rising volatility and falling volatility are not the same, whether it is academic research or actual testing has shown this point.         The original ATR indicator is calculated by putting up and down fluctuations together. This indicator is to calculate separately the upward volatility and the downward volatility, which can better help you study the market. 2. Indicator description          There are two modes for the calculation of this indicator, as shown in the fo
Have you ever take a long time to watch a Symbol when the network link is not good ? Have you ever wait for a long time when you switch chart between different Symbols or different TimeFrames ? If you do long-term backtesting , Have you ever to be downloaded datas for a long time ? Yes, If there is no data in the system, those will happen.  1. What is this: Download all the Symbol data in Market Watch to the system. PS: This is not outputting data to Files. This Link go to Demo version: https:/
This product can be used to synchronize multiple Charts, and each Chart can be set to a different sync mode. With this product you can better view and manipulate charts: different time frames for a single Symbol, the same time frame for multiple Symbols, system indicators for single/multiple Symbols... and more. Feature: Chart settings can be synchronized, including : background, indentation, size, etc. Multiple Chart window start times  or end times can be synchronized. Multiple Chart time fr
I see that many tools in the market deal with Position and Order in the form of operation panels. Which is loaded into a Chart in the form of an EA. However, once the operator panel EA is loaded, no other EAs can be loaded. So, I wrote the one-click operation of Position and Order as a script, so you can load other EAs and easily complete one-click operation of Trade. 1. What is this: This is a one-click script to close position order. Now you can close position tickets at high speed, for examp
I see that many tools in the market deal with Position and Order in the form of operation panels. Which is loaded into a Chart in the form of an EA. However, once the operator panel EA is loaded, no other EAs can be loaded. So, I wrote the one-click operation of Position and Order as a script, so you can load other EAs and easily complete one-click operation of Trade. 1. What is this: This is a one-click script to delete the pending order . Now you can delete pending tickets at high speed, for
Do you think it's a bit cumbersome when you need to switch symbols or timeframes with mouse click? 1. What is this? This is a program that can switch symbols and timeframes with direction keys. Fast switching, very convenient, no mouse click required. For traders, one symbol with multi-timeframe charts are usually added,  you can change symbol on those charts  easily . For multi-currency traders, different symbol charts are usually added, you can also change those timeframes easily. I wrote thi
According to trading experience: Some symbols are easy to reverse on certain days, such as Monday, or afternoon, and so on. So comparing the current price with the corresponding historical moment price is valuable. If the price coordinate system uses a logarithmic price, you will get a lot of valuable information. 1. What is this? This program can convert the symbol price and add it to your Chart. You can compare it with your major chart. The DEMO version Link: https://www.mql5.com/en/market/pr
What is this: Violent trading: means sending a large number of orders to your brokerage server,  it can conduct a stress test of the trading. In this program you can run a variety of trading tests.  Now you can trade at high speed, For example 1000 orders in an instant. The Demo version's link:  https://www.mql5.com/en/market/product/38431/ Why to use: Whether manual trading or EA trading,  the status of the broker server is very important. So it is beneficial to conduct a trading stress test on
1. Why did I develop this series of indicators I found that most traders need to use multiple time frame indicators. They usually switch time frame to see indicators. However, once the timeframe is switched, you cannot see the  corresponding relationship  between  the price in the smaller timeframe  and  the indicator in the larger timeframe . For example: if your price chart is in H1 timeframe, you can see H4, D1 and W1 indicators in H1 timeframe Chart. This is more helpful for you to find th
Filtro:
Nessuna recensione
Rispondi alla recensione