Mario KLine Platformer

# Mario KLine Platformer - Side-scrolling Candlestick Platformer 🎮📊

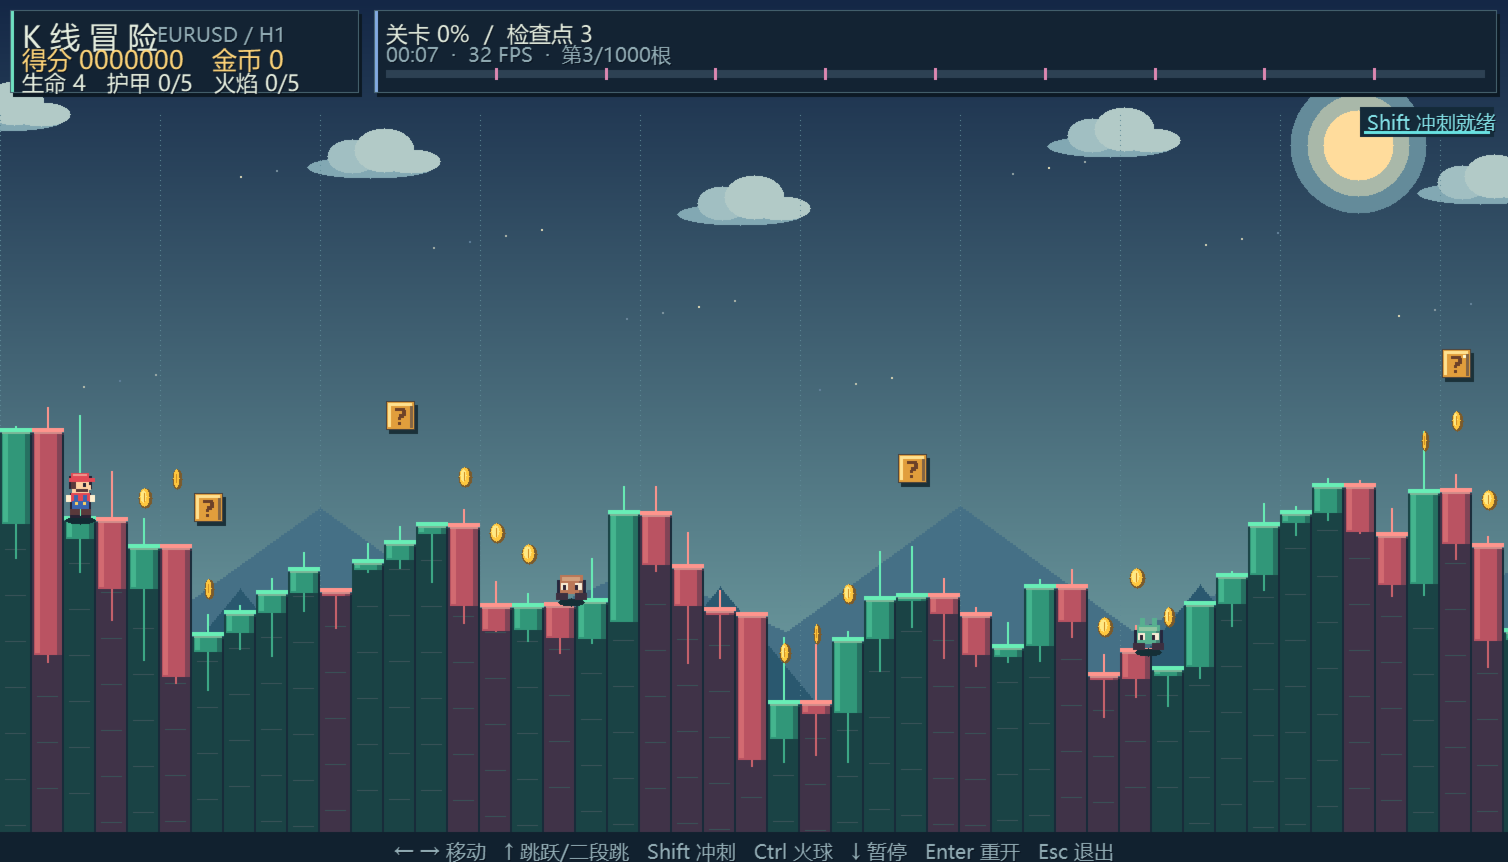
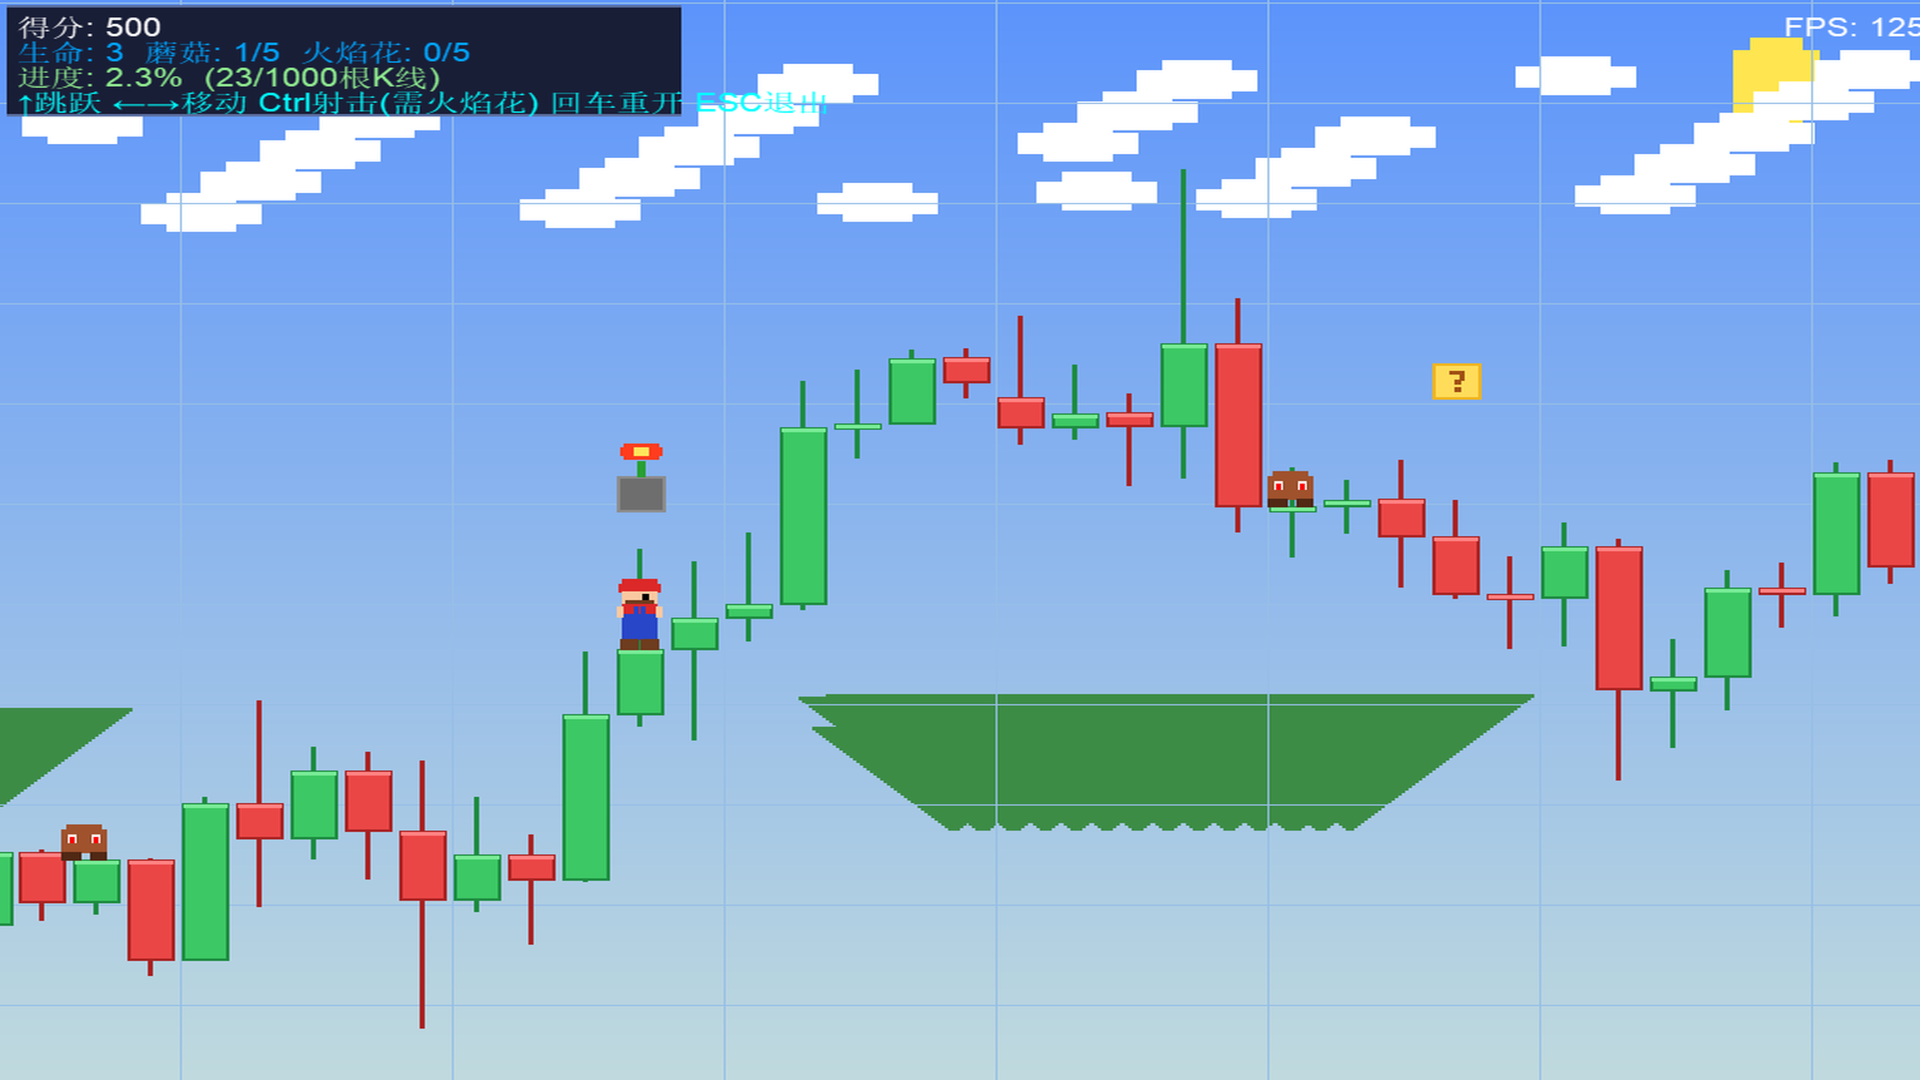
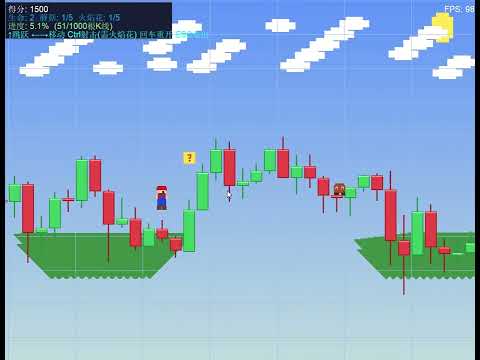
`Mario KLine Platformer` is an incredibly creative side-scrolling platformer game for MetaTrader 5 (MT5). this script cleverly merges financial charts with classic Super Mario-style mechanics—**using the real-time candlestick data (OHLC) of the current chart as the level terrain**. Run, jump, and shoot fireballs across market trends in a unique "chart adventure"!

---

## 🌟 Key Concepts & Features

1. **Candlesticks as Playable Terrain (K-Line Terrain)**
   * Upon launch, the game fetches historical candlestick data (Open, High, Low, Close) from the active chart and translates it into grounds and cliffs.
   * Green bull candles and red bear candles form steps of various heights. The tops of the candle bodies serve as the walkable floor. Shadows and high-light borders add retro-style 3D aesthetics to the charts.
   * **Market Trends Dictate Difficulty**: A strong uptrend creates steep "mountains" to climb, while a severe downtrend forms deep "gorges" that require precise jumps to cross.

2. **Upgrades & Power-Up System**
   * Hitting the floating golden Question Blocks randomly spawns different power-ups:
     * 🍄 **Super Mushroom**: Enlarges Mario's sprite (up to 40 pixels taller) and upgrades the growth level (up to 5). Each level acts as a shield, absorbing one hit of damage.
     * 🔥 **Fire Flower**: Upgrades Mario's shooting capability up to level 5. Higher levels allow shooting more fireballs simultaneously (multi-directional spread), at faster speeds, and with reduced cooldown.
     * 🪙 **Coins**: Hits the coin blocks to bounce gold coins and immediately gain 200 points.

3. **Diverse Enemies & Mini-Boss Encounters**
   * **Goombas (Regular Enemies)**: Patrol between candlestick ledges, jump randomly, and shoot dark-purple energy bullets towards Mario.
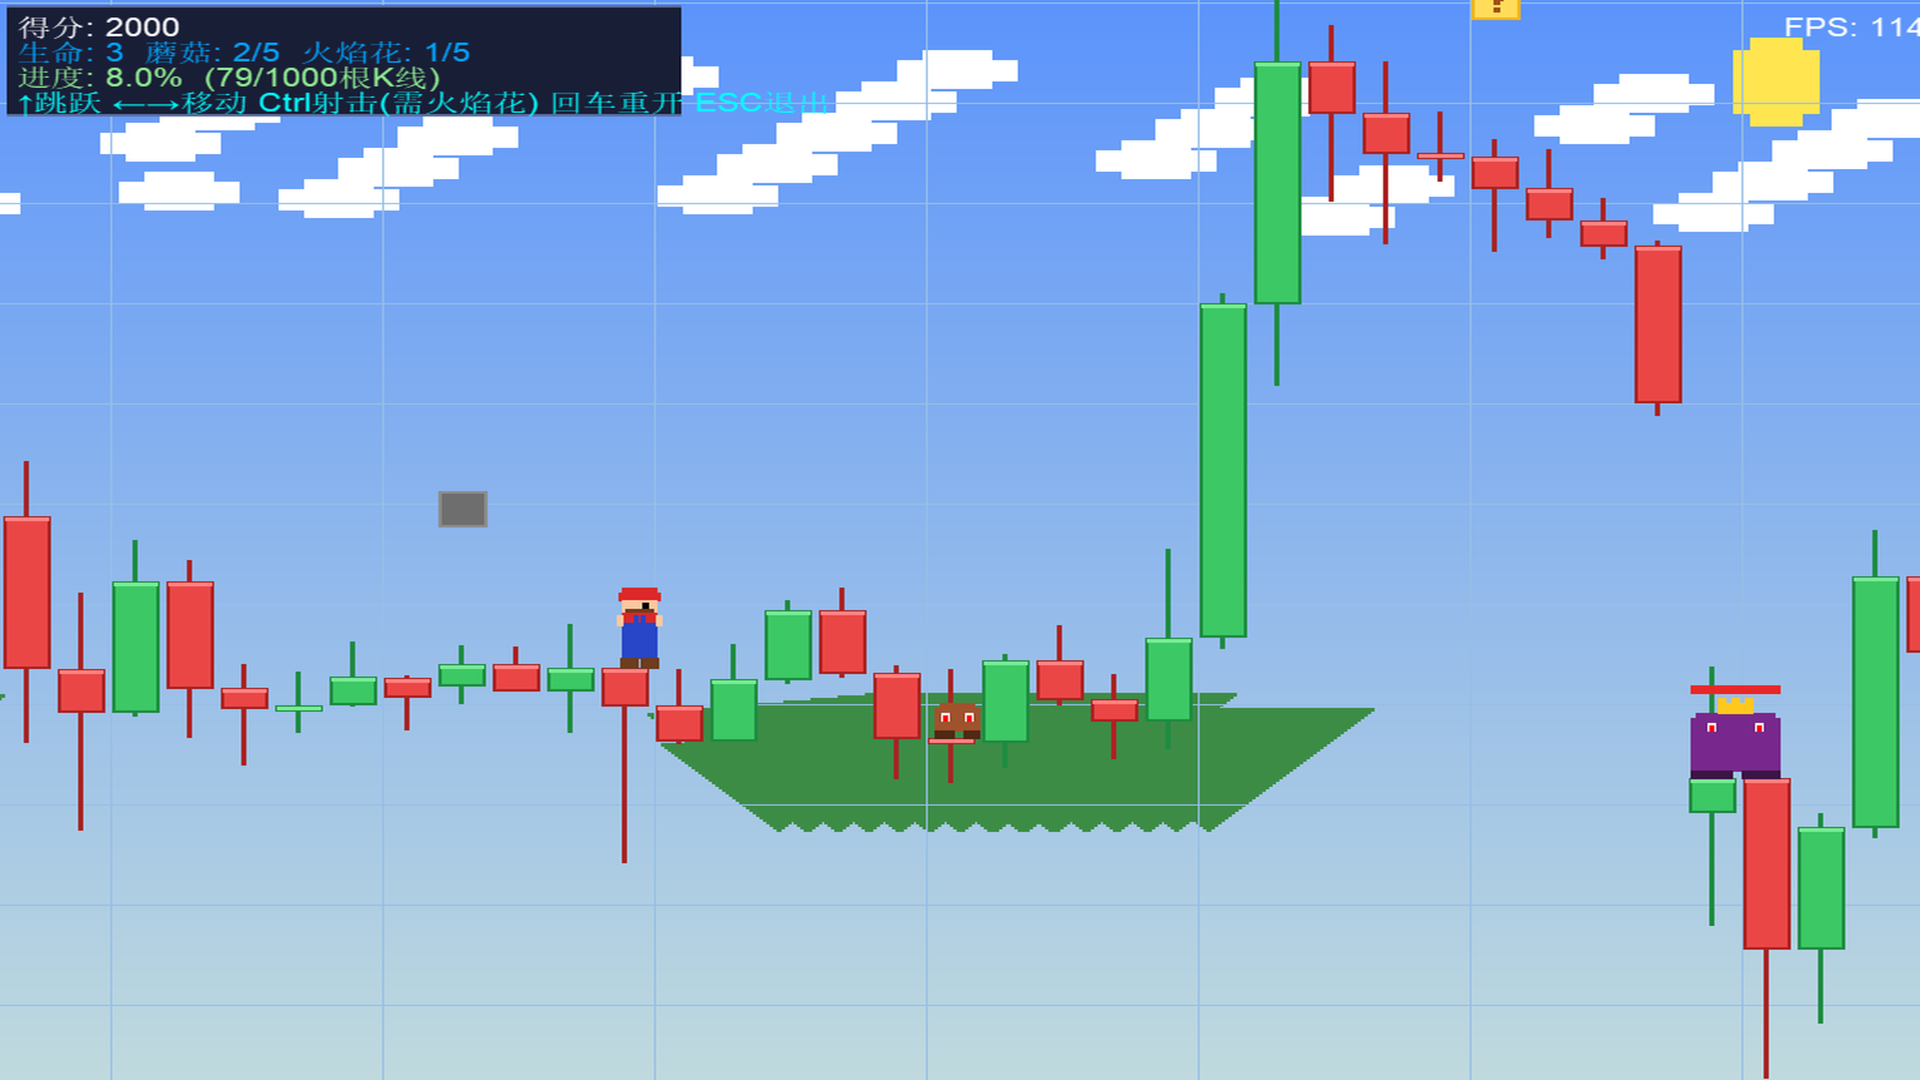
   * **Mini-Bosses**: Spawn at parameter-defined intervals of candlesticks. Boasting 5 HP (with a health bar displayed above), golden crowns, and purple armor, they shoot a 3-way spread of projectiles.
   * **Combat Mechanics**: You can eliminate enemies by jumping on top of their heads (instantly kills Goombas, deals 1 damage to Bosses and triggers a high bounce) or by shooting them with fireballs.

4. **Advanced Movement Mechanics**
   * **Step Assist**: Mario automatically steps onto low candle edges, saving you from constant jumping.
   * **Wall Slide & Wall Jump**: When airborne next to a high wall, holding the direction key triggers a slow slide. Pressing the Jump key during a slide performs a Wall Jump off the wall in the opposite direction, allowing you to scale high walls easily.

5. **Built-in 2D Software Rasterizer**
   * The game requires no external GDI dependencies. It utilizes MQL5's raw pixel buffer arrays (`g_image[]`) to draw pixels and shapes (`FillRect`), which are updated inside an `OBJ_BITMAP_LABEL` resource.
   * Immersive background system: Gradient skies, a glowing sun, parallax scrolling clouds (0.3x speed) and far-mountains (0.5x speed), overlayed with trading grid lines.

---

## 🕹️ Controls Guide

* **←** and **→**: Move Mario left and right.
* **↑**: Jump. Press when sliding on a wall to trigger a "Wall Jump".
* **Ctrl (Control)**: Shoot fireballs (Requires Fire Flower level $\ge 1$).
* **Enter**: Restart/Reset the game.
* **ESC**: Exit the game and restore the normal chart view.

---

## 🛠️ Code Architecture

The codebase is clean and follows standard retro game loop designs:

1. **`BuildTerrain()` (Terrain Builder)**
   * Downloads current candlestick OHLC data (up to 10,000 bars) and maps price ranges to screen pixels (a typical candlestick occupies 32 horizontal pixels and roughly 110 vertical pixels).
   * Stores values into `g_highH`, `g_lowH`, `g_bodyTopH`, `g_bodyBotH` arrays.

2. **`SpawnEnemies()` & `SpawnBoxes()` (Scene Generators)**
   * Spawns enemies, bosses, and items based on mathematical distributions across the candlesticks.
   * Generates blocks at 110 pixels above the candle heights.

3. **`UpdateGame(double dt)` (Game State Tick)**
   * Computes player positions, gravity physics, collision with the terrain, and wall slide inputs.
   * Checks block-head-hits, updates power-up movements, and handles item collection.
   * Handles bullet movements, bullet-to-enemy damage, and enemy-to-player collisions.
   * Stage completion: If the player coordinates `g_px` reach the final candlestick, it triggers the victory state (+1,000 points and shows completion message).

4. **`RenderGame()` & `DrawMario()` (Pixel Rasterizer)**
   * Draws sky gradients, shifts parallax mountains and clouds relative to camera `g_camX`.
   * Loops through visible ranges to draw candlesticks, flags, blocks, particles, and health bars.
   * Renders the animated Mario sprite (alternating leg frames for walk cycle) and flashes the sprite during invincibility frames.

---

## ⚙️ Configuration Parameters

Adjust these settings when launching the script:

* **InpMaxBars** (`Candlesticks Count`): Default `1000`. Set the total length of the level (up to 10,000 bars).
* **InpBossBars** (`Boss Interval`): Default `100`. Defines how many candlesticks pass before a Mini-Boss spawns.

---

## 🚀 How to Run

1. Open MetaTrader 5.
2. Select your desired symbol and chart timeframe (e.g., EURUSD, H1).
3. In the "Navigator" window, browse to **Scripts -> My_Scripts -> 3D动画 -> Mario_KLine_Platformer**.
4. Double-click or drag `Mario_KLine_Platformer` onto the chart.
5. Set the level parameters in the dialog box, then click "OK".
6. The chart will be hidden, and the game will begin. Press **ESC** at any time to return to your normal trading chart.

---


おすすめのプロダクト
インディケータは現在のクオートを作成し、これを過去のものと比較して、これに基づいて価格変動予測を行います。インジケータには、目的の日付にすばやく移動するためのテキスト フィールドがあります。 オプション: シンボル - インジケーターが表示するシンボルの選択; SymbolPeriod - 指標がデータを取る期間の選択; IndicatorColor - インジケータの色; HorisontalShift - 指定されたバー数だけインディケータによって描画されたクオートのシフト; Inverse - true は引用符を逆にします。false - 元のビュー。 ChartVerticalShiftStep - チャートを垂直方向にシフトします (キーボードの上下矢印)。 次は日付を入力できるテキストフィールドの設定で、「Enter」を押すとすぐにジャンプできます。
SmartRAL
Jemy Yeferson Dimu Ludji
SmartRAL (Smart Risk Auto-Lot EA) SmartRAL: The Ultimate Risk & Lot Management Expert Advisor (EA) SmartRAL is an essential tool for traders who demand precise risk management and automated position sizing in MetaTrader 5. Stop guessing your lot size and let the algorithm handle the calculations. This EA allows you to trade with confidence by guaranteeing your risk exposure on every single trade, while offering absolute flexibility in setting your Stop Loss (SL). Key Features & Benefits Guarante
This indicator created based on original John Carter's TTM_Squeeze indicator and represents "squeeze" of the market which can be followed (or maybe not) by significant moves. Original indicator prints black dots when Bollinger Bands are inside Kelthner Channels and exactly this implemented in this custom version. Instead of original implementation as momentum indicator MACD indicator with standard settings 12-26-9 is being used. Mainly, the indicator is useful for understanding when it's better
== LT RAINBOW TREND - 36本の移動平均線を持つトレンドインジケーター == 概要 LT Rainbow Trendは、36本の移動平均線を同時に処理し、スマートなカラーシステム(レインボー)を搭載した先進的なトレンド分析テクニカルインジケーターです。主力のトレンド方向へ最大の視覚的明瞭さをもって取引したいトレーダーのために開発され、マルチタイムフレーム分析の複雑さを、シンプルでカラフル、かつ非常に直感的なビジュアルへと変換します。 「トレンドは友達(The trend is your friend)」であることを理解しているトレーダーに最適です。このインジケーターは、トレンドの強さ、方向、そして潜在的な反転を常に事前に見極めることを可能にします。 仕組み インジケーターは、4つのトレンドゾーンに分散された36本の移動平均線を監視します: 赤(トレンド転換ゾーン) 31〜20番目の移動平均線 トレンドが反転する可能性を示す強いサイン オレンジ(トレンド減速ゾーン) 19〜10番目の移動平均線 トレンドの勢いが失われつつあるが、継続の可能性もあるサ
ALIEN DASHBOARD FULL EDITION – Professional ICT & Precision Trading Dashboard for MT5 ( HYBRID ENGINE ) Overview The   Alien Dashboard Full Edition   is a comprehensive, all‑in‑one technical indicator for MetaTrader 5 that merges the most powerful concepts from Inner Circle Trader (ICT) methodology with advanced precision‑entry logic, multi‑timeframe analysis, and an intuitive on‑chart dashboard. Designed for serious traders who want to visualise institutional order flow, identify high‑probabili
Key Features: 200+ Fully Implemented Patterns   across all categories Advanced Market Structure Analysis Smart Money Integration   (Wyckoff, Order Blocks, Liquidity) Professional Risk Management Multi-Timeframe Analysis AI-Powered Confidence Scoring Advanced Visualization Real-time Alerts Pattern Categories: Single Candle Patterns (Hammer, Doji, Marubozu, etc.) Multi-Candle Patterns (Engulfing, Stars, Harami, etc.) Chart Patterns (Head & Shoulders, Cup & Handle, Triangles, etc.) Harmonic Pattern
FREE
Ping:信頼できる取引のための不可欠なツール あなたのインターネットプロバイダーとVPSは安定した接続を約束していますが、本当に信頼できますか?1ミリ秒が重要となる世界では、遅いまたは不安定な接続は、利益の損失や損失につながる可能性があります。 Ping スクリプトを使用すると、次のことが可能になります。 情報に基づいた意思決定: 異なるVPSサーバーやブローカーの速度を視覚的に比較し、あなたの取引戦略に最適な最速で最も信頼性の高い接続を選択できます。 リスクの排除: これは、注文の実行速度が結果に直接影響するスキャルパーや高頻度トレーダーにとって特に有用です。 問題の特定: インターネットやVPSがいつ故障しているかを素早く検出し、取引に影響が出る前に対応できます。 妥協のない作業: 私たちのスクリプトは、他のExpert Advisorと競合することなく、あらゆるチャートと時間足で動作します。可能な限り便利で目立たないように設計されています。 Ping スクリプトは、MetaTrader 5ターミナル専用に開発された、接続速度と信頼性を監視するあなた自身のモニターです。ブローカー
プレミアムレベルは、正しい予測の精度が80%を超える独自の指標です。 この指標は、最高のトレーディングスペシャリストによって2か月以上テストされています。 あなたが他のどこにも見つけられない作者の指標! スクリーンショットから、このツールの正確さを自分で確認できます。 1は、1キャンドルの有効期限を持つバイナリーオプションの取引に最適です。 2はすべての通貨ペア、株式、商品、暗号通貨で機能します 手順: 赤い矢印が表示されたらすぐにダウントレードを開き、青い矢印が表示されたら閉じます。青い矢印の後に開くこともできます。 試してテストしてください!推奨設定はデフォルトです! 日足チャートで最高の精度を示します! インディケータは、2600 Pipsの収益性に対して、約10Pipsという非常に小さなマージンを使用します。
QuickTrade Panel – Fast Execution & Smart Risk Management The QuickTrade Panel is a professional trading utility for MetaTrader 5 that makes order execution faster, safer, and easier. It allows traders to place market and pending orders directly from the chart while automatically managing position size based on their risk settings. Key Features Interactive On-Chart Panel: Easily adjust Lot Size, Risk %, Stop Loss (SL), Take Profit (TP), and Pending Order Distance without opening EA settings. Sma
Japanese このインジケーターは、チャートパターンでのトレードを好むトレーダーにとって、高度なチャート分析アシスタントとして機能します。目視での分析負担を軽減し、利益を上げるための精度を高めるように設計されています。 実際の使用においての、このインジケーターの主な利点と特徴は以下の通りです: 1. 自動パターン検出 (Automated Pattern Detection) 時間の節約とバイアスの軽減: 手動でトレンドラインを引く必要はありません。価格のスイングポイント(Pivot High/Low)を検索し、価格構造が条件を満たすと、ライジングウェッジ(上昇楔形)とフォーリングウェッジ(下降楔形)を自動的に描画します。 あらゆる状況を網羅: パターン形成中、ブレイクアウト、さらにはパターン失敗(Failed)まで検出でき、市場の全体像を明確に把握できます。 2. ターゲットとフィボナッチTPの内蔵 (Built-in Targets & Fibonacci TP) ターゲットを自動計算: ブレイクアウトが発生すると、システムはウェッジの開き幅に基づいてメインターゲットの距離を即
Fastest Trades Copier is the fastest and most lightweight trade copier between MT5 accounts available on the market. Running entirely through the MT5 Common Folder — no DLLs, no external servers, no internet dependency — it copies your trades between two terminals on the same VPS or PC with near-zero latency, polling every 500ms with minimal CPU footprint. Key Features: Ultra-fast local copy via MT5 Common Folder Configurable symbol name translation between brokers (e.g. USDJPY.sc → USDJPY)
##   ONLY GOLD ##   Тiльки Золото ## **Mercaria Professional Trading Zones - Complete Guide** ## **Mercaria Professional Trading Zones - Повний посібник** ### **How Mercaria Zones Work / Як працюють зони Mercaria** **English:** Mercaria Zones is an advanced trading indicator that identifies high-probability support and resistance areas using ZigZag extremes combined with mathematical zone calculations. The indicator works on multiple timeframes simultaneously, providing a comprehensive view
Trading Advanced Panel - Professional Trading Panel for MT5 Transform Your Trading into a More Professional Experience Trading Advanced Panel is the ultimate control panel for traders seeking precision, agility, simplicity, and professional risk management. Developed with the best management experiences from top-tier platforms, this EA revolutionizes how you trade on MetaTrader 5. KEY FEATURES Real-Time Monitoring Position value updated every second - See the exact financial value of your trad
Order Book, known also as Market Book, market depth, Level 2, - is a dynamically updated table with current volumes of orders to buy and to sell specific financial instument at price levels near Bid and Ask. MetaTrader 5 provides the means for receiving market book from your broker, but in real time only, without access to its history. The indicator OrderBook Cumulative Indicator accumulates market book data online and visualizes them on the chart. In addition, the indicator can show the market
More stable MetaTrader 4 version is available here:  Lot Calculator Tool . This tool helps you to automatically calculate and manage risk, conveniently place orders visually, schedule orders, trail stops, move them to break-even and more. Features Place market or pending orders using draggable lines Schedule orders Calculate and limit risk using various methods See current spread See time till next candle Set custom order comments Trail stops Move stops to break-even See order profit/loss in p
SolarTrade Suite 金融ロボット: LaunchPad Market Expert - 取引を開始するために設計されています! これは、革新的で高度なアルゴリズムを使用して値を計算する取引ロボットであり、金融​​市場の世界でのアシスタントです。 SolarTrade Suite シリーズのインジケーター セットを使用して、このロボットを起動するタイミングをより適切に選択してください。 説明の下部にある SolarTrade Suite シリーズの他の製品をご覧ください。 投資と金融市場の世界を自信を持ってナビゲートしたいですか? SolarTrade Suite 金融ロボット: LaunchPad Market Expert は、情報に基づいた投資決定を行い、利益を増やすのに役立つ革新的なソフトウェアです。 SolarTrade Suite 金融ロボット: LaunchPad Market Expert の利点: - 正確な計算: 当社のロボットは、高度なアルゴリズムと分析方法を使用して、市場の動きを正確に予測します。 資産を売買するのに最適なタイミングを
CosmiCLab SMC FIBO CosmiCLab SMC FIBO is a professional trading indicator designed for traders who use Smart Money Concepts (SMC), market structure analysis and Fibonacci retracement levels. The indicator automatically detects market swings and builds Fibonacci levels based on the latest impulse movement. It also identifies market structure changes such as BOS (Break of Structure) and CHOCH (Change of Character), helping traders understand the current market direction. CosmiCLab SMC FIBO also pr
Fvg Edge
Ahmad Meftah Abdulsalam Alawwami
5 (3)
FVG Smart Zones – 無料版 MetaTrader 5 (MT5)用 公正価値ギャップ(FVG)検出インジケーター ただのランダムなインジケーターではなく、 本格的なトレーディングツール をお探しですか? FVG Smart Zones – 無料版 は、公正価値ギャップ(FVG)を自動で検出し、チャート上に 高確率トレーディングゾーン をハイライトして、プロフェッショナルな市場の洞察を提供します。 以下のトレーダー向けに設計されています: スマートマネーコンセプト (SMC) ICTトレーディングコンセプト プライスアクション (Price Action) 需給分析 (Supply & Demand) 機関投資家向けトレーディング戦略 このインジケーターは、 価格が反応しやすいゾーン に集中するのを助けます。 主な機能 スマートゾーン検出 上昇・下降FVGの自動検出 クリーンでプロフェッショナルなビジュアルゾーン 弱い、または関連性の低いギャップを除去するインテリジェントフィルター 高度な確認機能 上位時間軸(HTF)
FREE
HMA Scalper Pro EA
Vladimir Shumikhin
5 (2)
HMA Scalper Pro EA — Hull Moving Average (HMA) インジケーターに基づく MetaTrader 5 用自動売買アドバイザー 概要 HMA Scalper Pro EA は、Hull Moving Average (HMA) の方向にトレードする MetaTrader 5 用のプロフェッショナルなトレーディングロボット(Expert Advisor)です。HMA インジケーターは現在のトレンド方向を判定し、アドバイザーはその方向にトレードを執行し、Smart Risk キャピタルマネジメント、アダプティブグリッドトレーディング、トレイリングストップ、ブレイクイーブン、タイムフィルターでエントリーを補完します。 このアドバイザーは Netting アカウントと Hedging アカウントの両方をサポートし、金(XAU/USD)、外国為替通貨ペア、原油、指数、暗号資産の取引に適しています。 HMA SCALPER PRO EA を選ぶ理由 - Hull Moving Average シグナル — HMA の方向に基づくエントリー。HMA
DAILY OH/OL SDEV QUANT MODEL - STATISTICAL TRADING WITH PRECISION RISK MANAGEMENT TRADE WITH MATHEMATICAL CERTAINTY - KNOW YOUR EXACT STOP-LOSS AND TAKE-PROFIT BEFORE YOU ENTER This indicator analyzes 5,000+ days of price history to give you: Exact entry levels (sigma bands locked at daily open) Exact stop-loss distance (from M
Price Magnet — Price Density and Attraction Levels Indicator Price Magnet is a professional analytical tool designed to identify key support and resistance levels based on statistical Price Density. The indicator analyzes a specified historical period and detects price levels where the market spent the most time. These zones act as “magnets,” attracting price action or forming a structural base for potential reversals. Unlike traditional Volume Profile tools, Price Magnet focuses on price-time d
Crash300 Pro Trader は、トレンド判定、RSIフィルタリング、リカバリー(回復)ベースの取引管理を組み合わせて設計された、完全自動のエキスパートアドバイザー(EA)です。 このEAは、日足(D1)時間足の Parabolic SAR を使用して市場の方向を判断し、トレンド方向にのみ取引を行います。エントリー精度を向上させるためにRSIフィルターを使用し、買われすぎ・売られすぎの偽シグナルを回避します。 組み込みのリカバリーシステムは、損失ポジションを管理するために使用され、損失が設定レベルに達した場合に同じ方向へ追加取引を行います。これにより、トレンド相場における含み損の回復を支援します。 また、利益目標に到達すると自動的にポジションを決済するテイクプロフィット機能も搭載されています。 主な機能: - 完全自動トレードシステム - Parabolic SAR(D1)によるトレンド判定 - RSIによるエントリーフィルター - ドローダウン時のリカバリーシステム - 自動利益確定機能 - Crash 300 インデックス専用 このEAは、リスク管理を重視しな
Overview Harmonic Patterns MT5 is a technical analysis indicator designed for the MetaTrader 5 platform. It identifies and displays harmonic price patterns, such as Butterfly, Cypher, Crab, Bat, Shark, and Gartley, in both bullish and bearish directions. The indicator calculates key price levels, including entry, stop loss, and three take-profit levels, to assist traders in analyzing market movements. Visual elements and customizable alerts enhance usability on the chart. Features Detects six ha
AlphaGain AI – 次世代AIによるエリートトレーディング精度 AlphaGain AIは、MetaTrader 5向けに設計された高性能エキスパートアドバイザー(EA)で、AIと過去10年以上のデータを活用し、マーケット環境に応じた自動適応戦略で正確なシグナルを提供します。 主な特徴: AIコア:ローソク足パターン、ボラティリティゾーン、モメンタムロジックを解析; 10年以上のヒストリカルデータで学習; 高度なエントリー/エグジットロジック:SL/TP、トレーリングストップ、ブレイクイーブン、ボラティリティに応じたTP; 資金保護:ドローダウン制限、エクイティガード、最大スプレッドフィルター、取引時間制限; 完全自動運用:人間の介入不要; 低レイテンシー対応:ECN環境に最適化。 推奨設定: 通貨ペア:EUR/USD 時間足:15分(M15) 最低残高:100ドル アカウントタイプ:ECNまたはRaw Spread レバレッジ:1:100以上 AlphaGain AIを選ぶ理由: 簡単導入:.ex5ファイル、.set設定、PDFガイド付属;
Sweeper PRO – Advanced Candle Sweep Detector (3-in-1)   WhatsApp Support: Contact1 Money.transporter@gmail.com Overview Sweeper PRO is a powerful and fully customizable indicator designed to detect three unique types of candle sweeps — smart entry and reversal patterns commonly used by professional price action traders. It automatically identifies potential fakeouts, liquidity grabs, and continuation signals , helping you anticipate market reversals and confirm strong directional moves
チャートの自動垂直スケーリング もうチャートを手動で調整する必要はありません! 市場は常に動いています — チャートも自動で調整されるべきです。 ScaleFix Smart Auto Scaling は、MetaTrader 5 向けのスマートツールで、価格を常に快適な表示ゾーン内に自動で維持します: • 上部の高値 — 上端から約 10% のマージンを確保 • 下部の安値 — 下端から約 10% のマージンを確保 市場のボラティリティに関わらず、チャートは常に見やすく、プロフェッショナルで、整理された状態を保ちます。 なぜトレーダーは ScaleFix Smart Auto Scaling を選ぶのか 集中力の節約 アクティブなトレード中、一瞬の集中も重要です。 価格の変動ごとに手動でスケールを調整する必要はもうありません。 分析の快適性向上 価格がチャートの端に「張り付く」ことがありません。 市場の構造、勢い、ゾーン、フォーメーションをより鮮明に把握できます。 特に有効な場面: スキャルピング 日中取引(デイトレード) プライスアクション分析 レベルトレード(サポート・レジスタ
MetaTrader 5 (MT5) 用ワールドセッションクロック ワールドセッションクロックは、MetaTrader 5 用のプロフェッショナルなマーケットセッションクロックで、世界の取引セッションをリアルタイムで視覚的に表示します。 トレーダーは、手動での時間計算やタイムゾーン調整を行うことなく、市場の開始、終了、セッションの重複を迅速に把握できます。 この製品は、24時間表示のアナログ時計、デジタル時間表示、セッションアーク、およびオプションのチャートセッションゾーンを、日々の取引に最適な、すっきりとした軽量インターフェースに統合しています。 主な機能 リアルタイム世界市場セッションクロック ウェリントン、シドニー、東京、ロンドン、ニューヨークのセッションに対応 GMT/UTCの自動処理 サマータイムに完全対応 セッションアークとオプションのチャートゾーン(長方形または垂直線) 将来のセッションの視覚化(事前に描画) 時計とデジタル表示のドラッグ可能なアンカーポイント クリーンなオブジェクトベースの描画(インジケーター、バッファなし) あらゆるEAまたはイン
Gino Renko EA
Stephane, Andr Valette
Here is an EA based on the Renko indicator, it can be used with currencies, commodities, and forex. Just associate it with the corresponding graph. The indicator used for the EA is available here, but it is not necessary for its operation, they are 2 independent products: https://www.mql5.com/fr/market/product/87852?source=Site +Market+MT5+Indicator+Search+Rating006%3agino+renko Personally I don't like renko like EA, and I haven't done any tests to find out which configuration is the best. Th
CRT Candle Range Theory HTF MT5.   Ultimate CRT Indicator: Advanced ICT Concepts and Malaysian SnR Trading System Master the Market Maker's Footprints with the Most Advanced Candle Range Theory Indicator Unlock the true power of  Smart Money Concepts (SMC)  and trade precisely like the institutions with the  Ultimate CRT Indicator . Built exclusively for serious traders, this indicator automates the highly effective  Candle Range Theory (CRT) , a core pillar of  ICT Concepts (Inner Circle Trader
Noize Absorption Index - is the manual trading system that measures the difference of pressure between bears forces and bulls forces. Green line - is a noize free index that showing curent situation. Zero value of index shows totally choppy/flat market.Values above zero level shows how powerfull bullish wave is and values below zero measures bearish forces.Up arrow appears on bearish market when it's ready to reverse, dn arrow appears on weak bullish market, as a result of reverse expectation.
このプロダクトを購入した人は以下も購入しています
Trade Assistant MT5
Evgeniy Kravchenko
4.43 (214)
取引 ごとのリスクの 計算、新規注文 の 簡単 な 設置、部分的 な 決済機能 を 持 つ 注文管理、 7 種類 のトレーリングストップなど 、便利 な 機能 を 備 えています 。 追加の資料と説明書 インストール手順   -   アプリケーションの手順   -   デモアカウント用アプリケーションの試用版 ライン機能 チャート上にオープニングライン、ストップロス、テイクプロフィットを表示します。この機能により、新規注文を簡単に設定することができ、注文を出す前にその特徴を確認することができます。   リスク計算 リスク計算機能は、設定されたリスクとストップロス注文のサイズを考慮して、新規注文のボリュームを計算します。ストップロスの大きさを自由に設定できると同時に、設定したリスクを守ることができます。 Lot calc ボタン - リスク 計算 を 有効 / 無効 にします 。 Risk フィールドでは 、必要 なリスクの 値 を 0 から 100 までのパーセンテージまたは 預金通貨 で 設定 します 。 設定」 タブで 、 リスク 計算 の 種類 を 選択 します :「 $ 通
Trade Manager EAへようこそ。これは、取引をより直感的、正確、そして効率的にするために設計された究極の リスク管理ツール です。これは単なるオーダー実行ツールではなく、包括的な取引計画、ポジション管理、リスク管理のためのソリューションです。初心者から上級者、迅速な実行を必要とするスキャルパーまで、Trade Manager EAはあらゆるニーズに対応し、為替、指数、商品、暗号通貨などさまざまな市場で柔軟に対応します。 Trade Manager EAを使用すると、複雑な計算が過去のものになります。市場を分析し、エントリーポイント、ストップロス、テイクプロフィットのレベルをチャート上のラインでマークし、リスクを設定するだけで、Trade Managerが最適なポジションサイズを即座に計算し、SLとTPをピップ、ポイント、口座通貨でリアルタイムに表示します。すべての取引が簡単かつ効果的に管理されます。 主な機能: ポジションサイズ計算機 :定義されたリスクに基づいて取引サイズを瞬時に決定します。 簡単な取引計画 :エントリー、ストップロス、テイクプロフィットを設定するためのド
Local Trade Copier EA MT5
Juvenille Emperor Limited
4.97 (143)
Local Trade Copier EA MT5 による、驚くほど高速な取引コピーを体験してください。1分で簡単にセットアップできるこの取引コピー機は、同じWindowsコンピュータまたはWindows VPS上の複数のMetaTrader端末間で取引をコピーすることができ、0.5秒未満の高速コピースピードを実現します。 初心者であろうとプロのトレーダーであろうと、 Local Trade Copier EA MT5 には、あなたの特定のニーズに合わせてカスタマイズするための幅広いオプションが用意されています。これは、利益の可能性を高めたい人にとって究極のソリューションです。 今すぐ試してみて、これが市場で最も速くて簡単なトレードコピー機である理由を理解してください。 ヒント: デモアカウントで Local Trade Copier EA MT5 デモバージョンをダウンロードして試すことができます: ここ ダウンロードした無料のデモ ファイルを MT5 >> ファイル >> データ フォルダを開く >> MQL5 >> Experts フォルダに貼り付けて、ターミナルを再起動しま
TradePanel MT5
Alfiya Fazylova
4.88 (162)
Trade Panelは多機能なトレーディングアシスタントです。アプリには手動取引用の50以上のトレーディング機能が搭載されており、ほとんどの取引作業を自動化することができます。 購入前に、デモアカウントでアプリのデモ版をテストすることができます。デモアカウント用のアプリの試用版をダウンロードするには、次のリンクをご利用ください: https://www.mql5.com/en/blogs/post/750865 。 完全な手順 こちら 。 取引。 ワンクリックで取引操作を行うことができます: リスクを自動計算して指値注文やポジションを開く。 複数の注文やポジションをワンクリックで開く。 注文のグリッドを開く。 保留中の注文やポジションをグループごとに閉じる。 ポジションの方向を反転(Buyを閉じてSellを開く、またはSellを閉じてBuyを開く)。 ポジションをブロックする(不足している量のポジションを開くことでBuyとSellのポジション量を等しくする)。 すべてのポジションを部分的にワンクリックで閉じる。 すべてのポジションの利食い(Take Profit)および損切り(Sto
ベータリリース Telegram to MT5 Signal Trader はまもなく正式なアルファ版をリリースします。いくつかの機能はまだ開発中で、小さな不具合に遭遇する可能性があります。問題が発生した場合はぜひご報告ください。皆さまのフィードバックがソフトウェア改善に役立ちます。 Telegram to MT5 Signal Trader は、 Telegram のチャンネルやグループからの取引シグナルを自動的に MetaTrader 5 にコピーする強力なツールです。 パブリックおよびプライベートの両方のチャネルに対応し、複数のシグナル提供元を複数のMT5口座に接続可能です。ソフトウェアは高速で安定し、すべての取引を細かく制御できます。 インターフェースは直感的で、ダッシュボードとチャートは見やすく設計されており、リアルタイムで動作状況をモニターできます。 必要環境 MQL の制限により、EA は Telegram と通信するためのデスクトップアプリが必要です。 インストーラーは公式の インストールガイド にあります。 主な機能 マルチプロバイダー: 複数の Telegram
================================================================================ POC BREAKOUT - V20.72. Full Professional Grade Toolkit ================================================================================ POC Breakout is a full MetaTrader 5 trading dashboard for discretionary traders who want breakout signals, Point of Control (POC) context, volume profiles, order flow, market structure, news, alerts, and advanced trade planning in one professional workspace. Attached directly to you
Telegram to MT5 Multi-Channel Copier は、Telegram チャンネルのトレードシグナルを MetaTrader 5 に自動的に直接コピーします。ボットも、ブラウザ拡張機能も、手動コピーも不要。Telegram でシグナルを受信すると、EA が数秒でターミナル上でトレードをオープンします。 本製品は 2 つのコンポーネントで構成されています:Telegram チャンネルを監視する Windows アプリケーションと、MT5 ターミナルでシグナルを実行するこの Expert Advisor です。MT4 版も利用可能です。 セットアップガイドとアプリケーションのダウンロード: https://www.mql5.com/en/blogs/post/768988 動作原理 Windows アプリケーションは、ボットではなくあなた自身の API 認証情報を使用して Telegram に接続します。つまり、プライベートおよび VIP チャンネルを含む、購読しているあらゆるチャンネル、グループ、トピックを読み取ることができます。シグナルを検出すると、それを解析し
Trade Manager は、リスクを自動的に計算しながら、取引を迅速に開始および終了するのに役立ちます。 過剰取引、復讐取引、感情的な取引を防止する機能が含まれています。 取引は自動的に管理され、アカウントのパフォーマンス指標はグラフで視覚化できます。 これらの機能により、このパネルはすべてのマニュアル トレーダーにとって理想的なものとなり、MetaTrader 5 プラットフォームの強化に役立ちます。多言語サポート。 MT4バージョン  |  ユーザーガイド + デモ Trade Manager はストラテジー テスターでは機能しません。 デモについてはユーザーガイドをご覧ください。 危機管理 % または $ に基づくリスクの自動調整 固定ロットサイズを使用するか、ボリュームとピップに基づいた自動ロットサイズ計算を使用するオプション RR、Pips、または価格を使用した損益分岐点ストップロス設定トレーリングストップロス設定 目標に達したときにすべての取引を自動的に終了するための 1 日あたりの最大損失 (%)。 過度のドローダウンからアカウントを保護し、オーバートレードを防ぎます
Farmed Hedge Yield Farming | All Markets (Manual - Hybrid - Semi/Automated EA) MULTI-ASSET SUPPORT Trade any asset available on your broker - Forex: Major, Minor, Exotic pairs - Crypto: BTC, ETH, XRP, SOL, BNB - Stocks: Apple, Tesla, Amazon, Google, etc. - Commodities: Gold, Silver, Oil, Gas - Indices: US30, NAS100, SPX500, DAX40 - Any CFD your broker offers VERIFIED TRADING RESULTS - Farmed Hedge Yield Axi Copy:  https://www.mql5.com/en/signals/2356376 - Farmed Hedge Yield Exn Copy:   https:/
YuClusters
Yury Kulikov
4.93 (43)
Attention: You can view the program operation in the free version  YuClusters DEMO .  YuClusters is a professional market analysis system. The trader has unique opportunities to analyze the flow of orders, trade volumes, price movements using various charts, profiles, indicators, and graphical objects. YuClusters operates on data based on Time&Sales or ticks information, depending on what is available in the quotes of a financial instrument. YuClusters allows you to build graphs by combining da
Power Candles Strategy Scanner - 自動最適化型マルチシンボル設定ファインダー パワーキャンドル・ストラテジー・スキャナーは 、パワーキャンドル・インジケーターを駆動するのと全く同じ自己最適化エンジンを、マーケットウォッチに登録されているすべての銘柄に対して並行して実行します。1つのパネルで、現在統計的に取引可能な銘柄、各銘柄で勝率の高い戦略、最適なストップロス/テイクプロフィットの組み合わせが表示され、新たなシグナルが発生した瞬間に通知が届きます。 このツールは、Stein Investmentsのエコシステムの一部です。  18種類以上のツールをすべて閲覧し、AIを活用したセットアップの推奨を受け取り、  https://stein.investments でコミュニティに参加しましょう 市場動向を網羅。銘柄ごとに3,000件以上の自動最適化。2種類のアラート。ワンクリックでチャートを切り替えて即座にアクション。 なぜこれが必要なのか 多くのマルチ銘柄スキャナーは、 価格の動き (ボラティリティ、変動率、銘柄ごとのRSI)を表示するだけです。それ
Trade copier MT5
Alfiya Fazylova
4.59 (49)
Trade Copierは、取引口座間の取引をコピーして同期するように設計された専門的なユーティリティです。 コピーは、同じコンピューターまたはvps にインストールされている、サプライヤーのアカウント/端末から受信者のアカウント/端末に行われます。 キャンペーン - すでに「Trade copier MT5」をご購入の方は、「Trade copier MT4」を無料で入手できます(MT4 → MT5 および MT4 ← MT5 のコピー用)。詳細な条件については、どうぞ個別メッセージでお問い合わせください。 購入する前に、デモ アカウントでデモ バージョンをテストできます。 デモ版 こちら 。 詳細な説明は こちら 。 主な機能と利点: MT5ネッティングアカウントを含む、MT5> MT5、MT4> MT5、MT5> MT4のコピーをサポートします。 高いコピー速度(0.5秒未満)。 ベンダーモードと受信者モードは同じ製品内に実装されています。 チャートから直接リアルタイムでコピーを制御できる、簡単で直感的なインターフェイス。 接続が切断されたり、端末が再起動されたりしても、設定と位
Exp COPYLOT CLIENT for MT5
Vladislav Andruschenko
3.97 (35)
MetaTrader 5 用のプロフェッショナル取引コピー機 MetaTrader 向けの高速・高性能・信頼性の高い 取引コピー機 です。 COPYLOT は、MT4 と MT5 のターミナル間で Forex 取引をコピーでき、 Hedge 口座と Netting 口座の両方に対応しています。 COPYLOT MT5 版の対応構成: - MT5 Hedge → MT5 Hedge - MT5 Hedge → MT5 Netting - MT5 Netting → MT5 Hedge - MT5 Netting → MT5 Netting - MT4 → MT5 Hedge - MT4 → MT5 Netting MT4 版 完全な説明 + DEMO + PDF 購入方法 インストール方法 ログファイルの取得方法 テストと最適化の方法 Expforex のすべての製品 MT4 ターミナルへのコピーも可能です(MT4 → MT4、MT5 → MT4): COPYLOT CLIENT for MT4 COPYLOT は、2台、3台、さらには10台のターミナル間で同時に動作できる、プロフェッ
EA Auditor
Stephen J Martret
5 (4)
EA Auditor is an independent analysis tool for traders evaluating Expert Advisors and trading signals on MetaTrader 5. It audits backtest reports, reviews posted developer signals, and cross-verifies the two against each other to help traders assess strategies before committing capital. The MQL5 market offers a wide range of Expert Advisors from many developers, with varying approaches, quality, and transparency. EA Auditor provides a consistent, data-driven framework for reviewing them, answer
Anchor: The EA Manager Run your full EA portfolio without conflicts, without stacked risk, and without watching every chart yourself. Anchor coordinates up to 64 Expert Advisors on a single account, including daily loss protection built for prop firm rules. Attach Anchor to any chart. Type your EA names and magic numbers in one line. Click OK. Anchor begins coordinating immediately. Built for portfolios. Built for prop firms. Built for discipline. The Problem Running multiple EAs on the same acc
Trade Dashboard simplifies how you open, manage, and control your trades, with built-in lot size calculation. It allows you to execute trades, manage risk, and control positions directly on the chart, with tools such as partial close, breakeven, and trailing stop. Designed to reduce manual work and help you stay focused on your trading decisions. A demo version is available for testing. Detailed explanations of features are provided within the MQL5 platform. Installation instructions are include
Unlimited Trade Copier Pro MT5 is a tool to copy trade remotely to multiple MT4, MT5 and cTrader accounts at different computers/locations over internet. This is an ideal solution for you if you are a signal provider and want to copy your trades to other receivers globally on your own rules. One provider can copy trades to multiple receivers and one receiver can get trade from multiple providers as well. The provider can even set the subscription expiry for each receiver, so that receiver will n
EASY Insight AIO – スマートで手間いらずな取引のオールインワンソリューション 概要 数秒で市場全体——FX、ゴールド、暗号資産、指数、さらには株式まで——を、手作業のチャート確認や複雑なセットアップ・インジケーター導入なしにスキャンできたらどうでしょうか? EASY Insight AIO はAIトレードのための究極のプラグ&プレイ型エクスポートツールです。市場全体のスナップショットを、クリーンなCSVファイルで一括出力。ChatGPT、Claude、Gemini、Perplexityなど、さまざまなAIプラットフォームで即座に解析できます。 ウィンドウの切り替えやグラフのごちゃごちゃしたオーバーレイはもう不要。自動エクスポートされる純粋で構造化されたインサイトだけで、無駄なチャート監視に悩まされず、スマートなデータ主導の判断に集中できます。 なぜEASY Insight AIOなのか? 本当のオールインワン • セットアップ不要、インジケーターのインストール不要、チャートへのオーバーレイ不要。インストールして起動し、エクスポートするだけです。 マルチアセット対
LIMITED SUMMER SALE -40% ! ONLY $470 insead of $790!  Maximum real discount! ONLY UNTIL 08/22 The core idea: using the user interface, you configure the parameters the chart must meet before entering a position (or positions), choose which entry models to use, and set the rules for when trading and planning should end. Lazy Trader  handles the rest: it  takes over all the routine chart watching and execution! full description  :: 3 key videos [1] ->  [2]   ->  [3] What can it do? - Understand
FUTURES ORDERFLOW FOOTPRINT CHART Professional OrderFlow EA for MetaTrader 5 Version 1.01| Professional tool for real traders | Institutional-Grade Visualization STRATEGY TESTER USERS - PLEASE SELECT EVERY REAL TICK WHEN TESTING AND YOU HAVE DOWNLOADED HISTORICAL DATA. IF YOU SEE A WAITING SCREEN AND IT IS NOT DOWNLOADING, IT MEANS YOU HAVE LOW HISTORICAL DATA. TRY 1 MIN AND 5 MIN FIRST ON 1 DAY DATA. ONE DAY DATA SHOULD BE THE NEWEST AND MOST CURRENT DATE. PLEASE WAIT UNTIL THE MARKET HAS ROL
Seconds Chart - MetaTrader 5で秒足チャートを作成するユニークなツールです。 Seconds Chart を使用すると、秒単位のタイムフレームでチャートを構築でき、標準的な分足や時間足チャートでは得られない柔軟性と分析精度を実現します。例えば、 S15 は15秒足を表します。カスタムシンボルをサポートしているインジケーターやEAをすべて使用できます。標準的なチャートと同様に便利に操作できます。 標準的なツールとは異なり、 Seconds Chart は超短期のタイムフレームでも高い精度と遅延なく作業できるように設計されています。 Free Demo: Seconds Chart v2.29 Demo.ex5 無料デモをダウンロードしてご自身でお確かめください: 完全機能版 - すべての機能が利用可能 24時間テスト - 精度と利便性を評価するのに十分な時間 デモ口座のみ - ほとんどのブローカーで簡単に開設可能 GBPCADチャートのみ - ほとんどの端末で利用可能 これらの制限はデモ版のみに適用されます。製品版は、あらゆる口座タイプ(リアル、デモ、コンテス
Timeless Charts
Samuel Manoel De Souza
5 (7)
Timeless Charts is an all-in-one trading utility for professional traders. It combines custom chart types such as Seconds Charts and Renko with advanced order flow analysis using Footprints , Clusters , Volume Profiles , VWAP studies, and anchored analysis tools for deeper market insight. Trading and position management are handled directly from the chart through an integrated trade management panel , while Market Replay and Virtual Accounts provide environments for practicing trading skills and
ManHedger MT5
Peter Mueller
4.83 (6)
THIS EA IS A SEMI-AUTO EA, IT NEEDS USER INPUT. Manual & Test Version Please TEST this product before BUYING  and watch my video about it. The price of the ManHedger will increase to 250$ after 20 copies sold. Contact me for user support or bug reports or if you want the MT4 version! MT4 Version  I do not guarantee any profits or financial success using this EA. With this Expert Advisor, you can: Implement your own Zone Recovery strategy to capitalize on trending markets. Create Grid trading s
The product will copy all telegram signal to MT5 ( which you are member) , also it can work as remote copier.  Easy to set up, copy order instant, can work with almost signal formats, image signal,  s upport to translate other language to English Work with all type of channel or group, even channel have "Restrict Saving Content", work with  multi channel, multi MT5 Work as remote copier: with signal have ticket number, it will copy exactly via ticket number. Support to backtest signal. How to s
Footprint Chart Pro — Professional OrderFlow EA for MetaTrader 5 Version 6.34 | Professional tool for real traders | Institutional-Grade Visualization DEMO USERS - PLEASE SELECT EVERY TICK / REAL TICK WHEN TESTING AND YOU HAVE DOWNLOADED HISTORICAL DATA. IF YOU SEE A WAITING SCREEN AND IT IS NOT DOWNLOADING, IT MEANS YOU HAVE LOW HISTORICAL DATA. TRY 1 MIN AND 5 MIN FIRST ON 1 DAY DATA. ONE DAY DATA SHOULD BE THE NEWEST AND MOST CURRENT DATE. PLEASE WAIT UNTIL THE MARKET HAS ROLLED OVER PERIOD.
動作デモ版ダウンロード Copy Cat More (コピーキャット・モア) MT5 トレードコピー (Trade Copier) は、ローカルのトレードコピーであり、今日のトレード課題のために設計された完全なリスク管理・執行フレームワークです。プロップファーム (prop firm) のチャレンジから個人のポートフォリオ管理まで、堅牢な執行、資金保護、柔軟な設定、高度なトレード処理の組み合わせによって、あらゆる状況に適応します。 このコピーは、マスター (Master、送信側) とスレーブ (Slave、受信側) の両モードで動作し、成行注文・指値注文、トレードの変更、部分決済、両建て決済 (Close By) 操作をリアルタイムで同期します。デモ口座と実口座、トレード用ログインと投資家ログインの両方に対応し、永続的トレードメモリ (Persistent Trade Memory) システムにより、EA・端末・VPS が再起動しても復旧を保証します。一意の ID により複数のマスターとスレーブを同時に管理でき、ブローカー間の差異は接頭辞/接尾辞の調整やカスタムシンボルマッピングに
この製品は、ニュースタイム中にすべてのエキスパートアドバイザーと手動チャートをフィルタリングするため、急激な価格変動によるマニュアルトレードのセットアップの破壊や他のエキスパートアドバイザーによって入力された取引について心配する必要はありません。この製品には、ニュースのリリース前にオープンポジションとペンディングオーダーを処理できる完全な注文管理システムも付属しています。 The News Filter  を購入すると、将来のエキスパートアドバイザーのためにビルトインのニュースフィルターに頼る必要はなく、今後はすべてのエキスパートアドバイザーをここからフィルタリングできます。 ニュース選択 ニュースソースは、Forex Factoryの経済カレンダーから取得されます。 USD、EUR、GBP、JPY、AUD、CAD、CHF、NZD、CNYなど、任意の通貨数に基づいて選択できます。 Non-Farm(NFP)、FOMC、CPIなどのキーワード識別に基づいて選択することもできます。 影響レベルによってフィルタリングするニュースを選択することができ、低、中、高の影響範囲から選択できます。
Quant AI Agents are independent trading Expert Advisors. Instead of trading using a fixed strategy like other conventional EAs, Quant AI Agents   is a   multi-agent AI trading framework   that turns natural-language strategy prompts into live.  WANT THE SAME RESULTS AS MY LIVE SIGNAL?   Use the exact same brokers I do:   IC MARKETS , IC TRADING   .  Unlike the centralized stock market, Forex has no single, unified price feed.  Every broker sources liquidity from different providers, creating un
Equity Protect Pro: 安心取引のための総合的な口座保護エキスパート 口座保護、資産保護、ポートフォリオ保護、マルチ戦略保護、利益保護、利益確定、取引セキュリティ、リスク管理プログラム、自動リスク管理、自動決済、条件付き決済、スケジュール決済、動的決済、トレーリングストップロス、ワンクリッククローズ、ワンクリック決済、ワンクリック復元などの機能をお探しなら、Equity Protect Pro が最適なプログラムです。 設定は簡単で、事前設定された条件に達すると、すべてのチャートを閉じることができ、シグナルサブスクリプションのキャンセルもサポートします(これは、すべての取引プログラムも停止することを意味します)。この時点で、新しい注文は生成されなくなり、最終的にすべての注文が閉じられ、予期せぬ損失を効果的に防止し、安心して取引できるようになります。 Equity Protect Pro (Technical Manual) Equity Protect Pro Demo Version for yo u to test   Equity Protect Pro MT4
作者のその他のプロダクト
1. Why did I develop this series of indicators I found that most traders need to use multiple time frame indicators. They usually switch time frame to see indicators. However, once the timeframe is switched, you cannot see the  corresponding relationship  between  the price in the smaller timeframe  and  the indicator in the larger timeframe . For example: if your price chart is in H1 timeframe, you can see H4, D1 and W1 indicators in H1 timeframe Chart. This is more helpful for you to find th
This product can be used to synchronize multiple Charts, and each Chart can be set to a different sync mode. With this product you can better view and manipulate charts: different time frames for a single Symbol, the same time frame for multiple Symbols... and more. PS: The link below is the FreeDemo product, you can use it on EURUSD/XUAUSD/USDCNH symbol: https://www.mql5.com/en/market/product/38557 Feature: Chart settings  can be synchronized, including : background, indentation, size, etc. M
Do you think it's a bit cumbersome when you need to switch symbols or timeframes with mouse click? 1. What is this? This is a program that can switch symbols and timeframes with direction keys. Fast switching, very convenient, no mouse click required. For traders, one symbol with multi-timeframe charts are usually added,  you can change symbol on those charts easily. For multi-currency traders, different symbol charts are usually added, you can also change those timeframes easily. I wrote this p
1. What is this         Rising volatility and falling volatility are not the same, whether it is academic research or actual testing has shown this point.         The original ATR indicator is calculated by putting up and down fluctuations together. This indicator is to calculate separately the upward volatility and the downward volatility, which can better help you study the market. 2. Indicator description          There are two modes for the calculation of this indicator, as shown in the fo
Have you ever take a long time to watch a Symbol when the network link is not good ? Have you ever wait for a long time when you switch chart between different Symbols or different TimeFrames ? If you do long-term backtesting , Have you ever to be downloaded datas for a long time ? Yes, If there is no data in the system, those will happen.  1. What is this: Download all the Symbol data in Market Watch to the system. PS: This is not outputting data to Files. This Link go to Demo version: https:/
This product can be used to synchronize multiple Charts, and each Chart can be set to a different sync mode. With this product you can better view and manipulate charts: different time frames for a single Symbol, the same time frame for multiple Symbols, system indicators for single/multiple Symbols... and more. Feature: Chart settings can be synchronized, including : background, indentation, size, etc. Multiple Chart window start times  or end times can be synchronized. Multiple Chart time fr
I see that many tools in the market deal with Position and Order in the form of operation panels. Which is loaded into a Chart in the form of an EA. However, once the operator panel EA is loaded, no other EAs can be loaded. So, I wrote the one-click operation of Position and Order as a script, so you can load other EAs and easily complete one-click operation of Trade. 1. What is this: This is a one-click script to close position order. Now you can close position tickets at high speed, for examp
I see that many tools in the market deal with Position and Order in the form of operation panels. Which is loaded into a Chart in the form of an EA. However, once the operator panel EA is loaded, no other EAs can be loaded. So, I wrote the one-click operation of Position and Order as a script, so you can load other EAs and easily complete one-click operation of Trade. 1. What is this: This is a one-click script to delete the pending order . Now you can delete pending tickets at high speed, for
Do you think it's a bit cumbersome when you need to switch symbols or timeframes with mouse click? 1. What is this? This is a program that can switch symbols and timeframes with direction keys. Fast switching, very convenient, no mouse click required. For traders, one symbol with multi-timeframe charts are usually added,  you can change symbol on those charts  easily . For multi-currency traders, different symbol charts are usually added, you can also change those timeframes easily. I wrote thi
According to trading experience: Some symbols are easy to reverse on certain days, such as Monday, or afternoon, and so on. So comparing the current price with the corresponding historical moment price is valuable. If the price coordinate system uses a logarithmic price, you will get a lot of valuable information. 1. What is this? This program can convert the symbol price and add it to your Chart. You can compare it with your major chart. The DEMO version Link: https://www.mql5.com/en/market/pr
What is this: Violent trading: means sending a large number of orders to your brokerage server,  it can conduct a stress test of the trading. In this program you can run a variety of trading tests.  Now you can trade at high speed, For example 1000 orders in an instant. The Demo version's link:  https://www.mql5.com/en/market/product/38431/ Why to use: Whether manual trading or EA trading,  the status of the broker server is very important. So it is beneficial to conduct a trading stress test on
1. Why did I develop this series of indicators I found that most traders need to use multiple time frame indicators. They usually switch time frame to see indicators. However, once the timeframe is switched, you cannot see the  corresponding relationship  between  the price in the smaller timeframe  and  the indicator in the larger timeframe . For example: if your price chart is in H1 timeframe, you can see H4, D1 and W1 indicators in H1 timeframe Chart. This is more helpful for you to find th
フィルタ:
レビューなし
レビューに返信